Selector AI Documentation
Welcome to Selector AI documentation! Find everything you need to understand and use our AIOps platform effectively.
Getting Started
Start your journey with Selector AI by exploring our comprehensive guides:
Integrations
Analytics & Queries
Security & Compliance
AI & Machine Learning
Support & Training
Quick Navigation
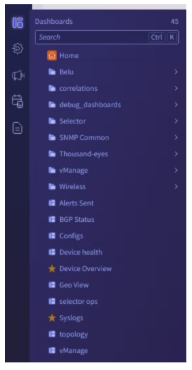
Use the sidebar menu to navigate through our documentation sections. Each section provides detailed information, examples, and best practices for using Selector AI effectively.
1 - Getting Started
1.1 - Introduction to Selector
Overview
Selector is an AIOps and event intelligence platform that enables operations teams to quickly detect and remediate incidents before customer-facing impact. It is a unified monitoring, observability, and event-intelligent AI for IT Operations (AIOps) platform. It provides a single pane of glass view and key functionality that was historically addressed by multiple tools. Selector’s innovative platform enables operations leaders to address tool sprawl, cut costs, enhance operational efficiency, and focus efforts on improving the customer experience.
Once network and infrastructure data are collected, Selector applies AI and ML to drive powerful features such as event correlation, root-cause analysis, and smart alerting. With Selector, operators gain comprehensive visibility across their network environments and dramatically lower the operational burden in detecting and remediating problems.
Selector supports purpose-built capabilities to enable operations teams to better detect, identify, and resolve operational issues.
A declarative Extract-Transform-Load (ETL) process enables rapid integration with various data sources spanning network, infrastructure, application, and configuration data. This ability to ingest data from any push-or-pull data source (SNMP, Netflow, GRPC, etc.), through any type of transport, helps ensure comprehensive collection of telemetry from WAN devices, wireless devices, controllers, and applications. The data is further normalized to help perform correlations accordingly.
ML-driven autocorrelation and related root-cause analysis provide teams with consolidated, actionable alerts within their preferred collaboration platform. Customers can further automate various operations activities such as ticket creation, maintenance, and automated incident remediation.
The Selector platform has robust notification and ticketing capabilities, with connectors for ServiceNow, Jira, ServiceDesk Plus and many others. Selector is further able to integrate with proprietary platforms as well. Additionally, some customers leverage Selector directly as their ITSM.
A novel Natural Language Model (NLM) using conversational AI helps eliminate the inefficiencies and costs associated with the patchwork of disparate operational tools found in the modern enterprise. GenAI-driven natural language querying allows everyone to interrogate the IT environment, enabling faster identification and resolution of issues.
Selector’s Digital Twin feature dynamically models customer networks and infrastructures. The resulting model enables customers to explore hypothetical situations to predict failures, optimize resource allocation, and inform strategic planning.
The Selector platform is Kubernetes-native, making it easy to deploy on-premises or in a customer’s cloud. Selector also provides a SaaS service, making it easier for the customers to use.
Next: System Architecture
1.2 - System Architecture
Overview
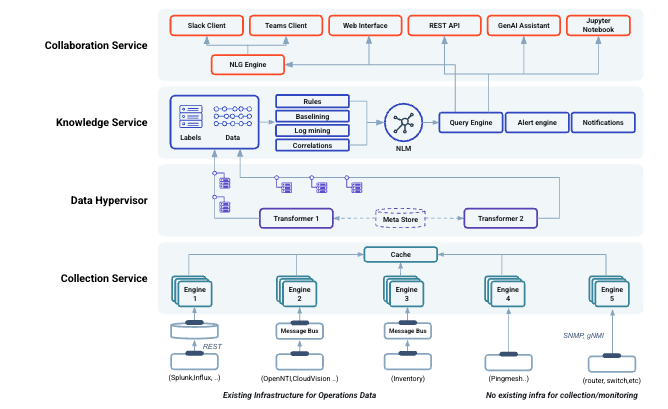
The Selector platform is constructed around four functional layers:
Data Collection Engine - Entry point for data in the system.
Data Hypervisor - The data plane where data gets normalized and enriched for further processing by upper layers.
Knowledge Service - Data is processed and ML analytics are performed.
Collaboration Service - Exposes the various interfaces for the user to interact with Selector Analytics.
Data Collection Engine
Selector Analytics has access to a wide variety of data sources through a set of custom-built collection engines that leverage both push and pull technology.
We collect data from existing monitoring systems such as Solarwinds, Datadog, or Zabbix, as well as log collection systems like Splunk. For these cases, we have pre-integrated engines for each of these systems, making them plug and play. Selector Analytics can also collect data directly from monitored entities (e.g., network devices using SNMP collection, gNMI, syslog, Netconf/CLI, etc.).
All the collection engines are cloud-native and are designed to be able to scale out. The data collection layer is the entry point of the data for the system, and it plays a key role in bringing the wide variety of data that may be necessary for our mission: answering complex questions.
There is another collection capability that is fundamental for the proper infrastructure observability and correlation: inventory. Selector Analytics can connect to an existing inventory or CMDB tool, consume static inventory definitions from a file or dynamic definitions via an API, integrate with an existing Netbox instance or provide inventory as a service using our own Netbox instance. Any of these mechanisms allow us to populate the Selector Analytics Metastore with data that will be used for real-time telemetry and event enrichment. For synthetic testing, lightweight software agents are available to be deployed in servers, VMs, network devices, etc.
Data Hypervisor
Data is ingested from different types of sources, and each one has its own characteristics, schema, encapsulation mechanisms, etc.
Depending on the nature of the data, the type of storage and processing it will require will also be different, which leads to the need to have different mechanisms for that purpose. Standalone data sources lack context, which is necessary for proper analysis, so it must be enriched with the necessary metadata (usually in the form of labels) to make it useful. That context also allows data coming from different sources to become connected so that they can be cross-correlated (metrics, events, logs, configuration, operational state, flow data, etc.)
The hypervisor is in charge of decoupling the physical infrastructure from the applications and provides an abstract view through the concept of VMs, or containers. Our data hypervisor provides the equivalent functionality for data processing: decoupling the various and different types of data sources, normalizing the data and providing a source agnostic mechanism to extract, enrich, process
and redirect the data to the right storage repositories, adequate to each type of data.
We use ML in the Data Hypervisor to automatically extract information from logs, events, and traps despite having unstructured or semi-structured content.
Traditional architectures need hundreds or thousands of regex rules to be created and maintained for that purpose. We use ML techniques to automatically infer and extract the relevant entities and cluster various events into meaningful types. The Data Hypervisor again plays a key role in the delivery of our mission, enabling the processing of any type of data and enriching the data with the contextual information necessary to answering complex questions.
Knowledge Service
The knowledge service uses data and algorithms to answer IT / operational questions. Our ML engine will automatically detect anomalies on any metric and/or apply heuristics-based rules when configured to do so. Alerts will be raised upon anomalies detected, which will be cross-correlated by our ML engine in the Knowledge Service and ranked with other alerts or events on the system. This process provides a cohesive view of the data received from different sources.
The Knowledge Service is the brain of the platform.
It not only provides the insights required to detect and correlate potential problems within the infrastructure, but also provides the interface to query any data on the system, regardless of the type (metric, events, logs, alerts, etc.). It plays a fundamental role in the Selector mission:
provide the right answer to the questions, provide visibility of the problems, whether known or unknown.
At Selector Analytics, our goal is to answer questions, but do it in a way that is operationally affordable. The days of programming hundreds or thousands of rules on a system to analyze logs, set thresholds, raise alarms and correlate events are gone. Networks and IT infrastructure have grown in size and complexity to a level where it is humanly impossible to deal with them using rules. Knowledge is necessary to answer questions, and machine learning techniques are used to extract that knowledge from the data, transform it, analyze it, correlate it with other analyzed data and make that knowledge available through the natural language interface.
Collaboration Service
If having the right answer to a question is important, it is also important to make it easy for users to ask their questions, and get the required answers in the right time, and in the right place.
The goal of the collaboration layer is to provide a human-centered set of interfaces to facilitate collaboration. With seamless integration in Slack and Microsoft Teams, network operation engineers can interact with the Selector Analytics from their collaboration tool of choice, without the need to switch to other interfaces.
It is possible to articulate the questions that need answers using natural human language, and get the right answers, in real-time, right there. It is also possible to get notifications and alerts directly in Slack or Microsoft Teams, and troubleshoot them from the same channel by issuing the necessary follow up questions (in natural language) to the Selector Analytics chatbot
Static dashboards are yesterday’s way of finding data. Our dashboards can be dynamically rendered as a result of the questions asked in Slack, for example, and all the operations teams can have joint access to the information to troubleshoot and address a network or IT incident.
Operations teams need the relevant information to be rendered in order to analyze a problem, for the specific context, and in the place that it is necessary. The days of having to learn complex structured query languages to find the information you need, across multiple tools, are gone. Operations engineers need to be able to articulate questions using natural human language and get the responses they need.
The Selector Analytics Platform mission is to find the right answers to the operational questions in the right time, the right place and the right way – and collaboration service plays a key role.
Next: End-User Features
1.3 - End-User Features
Overview
The Selector platform is more than just a model of features and a series software packages. The use of AI and ML allows Selector to implement several related and helpful end-user features.
Time-Series Anomaly Detection
Hazardous Conditions
Rate-of-Change Analytics
Sample Network Operations Use cases
Log Analytics
Event Correlation and Root Cause Analysis for Smart Alerting
Forecasting and Predietive Analysis
Copilot and Natural Language Queries
The Role of Kubernetes in Auto-Scaling
Selector has a number of attractive features. These features are listed here and detailed below:
-Low Code/No Code
-Notifications
-Flexible UI/UX
-Multi-language
-Storage for On-Premises Solution
Time-Series Anomaly Detection
Selector performs time-series analysis using proprietary AI and ML strategies to identify deviations from the expected values; that is, anomalies. A combination of dynamic and static thresholds provides the flexibility to handle various use cases. The resulting events are enriched with context, such as location, interface name, model, and so on, which further help with contextual correlation.
Selector offers powerful anomaly detection, outlier detection, and correlation capabilities that support the rapid detection of emerging incidents and points staff towards the probable root cause of those incidents. Composite alerting enables customers to leverage a combination of alerting conditions to further filter and tune the types of alerts and notifications sent to staff.
Auto-Baselining for Time-Series Anomaly Detection
- Selector’s “Auto-Baseliner” ML service computes and adjusts periodically a baseline and corresponding threshold for all time-series-based metrics
- This dynamic threshold helps determine the overall “health” of the metric and allows for intelligent detection of anomalies
- Any incoming data for the metric is measured against this dynamic threshold and manifest in color to represent health (red or green) in relevant visualizations
- Auto-baselines with dynamic thresholds coupled with the Alerting and Notification feature unleashes the power of AI in Selector to detect, alert, and notify users on anomalies in time series metrics
Outlier Detection
- An outlier is a data point that lies far beyond the other values in a sample from a general population
- An outlier is also an observation that lies an abnormal distance from other values in a random sample from a population
- Outliers allow for proactive detection of potential problems or anomalies in the network
- The feature is implemented using Z-score-based ML
Sample Network Outlier Use Cases
- Alert to investigate potentially anomalous conditions developing for performance or health or capacity of key network devices (such as optical transceivers) and data transfer
- Identify SecOps concerns brought on by significant point-in-time deviation of key networking metrics
Back to top
Hazardous Conditions (Hazcons)
- Hazcons are “bigger picture” conditions represented as a key network metric threshold violation which signal an imminent threat to the system or regional network operation
- Hazcons typically warrant immediate attention to prevent potential disruption or downtime or an SLA violation
- Alert Rules and Notifications must be defined
- Relevant dashboards showing the key metrics related to the Hazcon allow drilldown for Root Cause Analytics
Examples
- BGP Hazcon: >50% of sessions down
- Port Hazcon: >30% of ports or interfaces down
- Traffic Hazcon: >40% traffic change detected
Sample Network Use Cases
- Ensuring SLA guarantees
- Proactive network operations to fix issues before they become a problem
- Detect SecOps-related issues such as network traffic growth beyond normal expectations
Back to top
Rate-of-Change Analytics
- Measure how frequently the state of a network entity, represented by a relevant metric such as an interface or port or optical transceiver changes over a set time interval
- Provide insights into potentially analamous behavior based on the frequency of changes observed during that time period
Back to top
Sample Network Operations Use Cases
- Ensuring SLAs: a sharp increase in the rate of change of OSPF neighbor states might likely occur with network SLA performance guarantee degradation
- Health: a sharp rise in the number of interface flaps might indicate a health issue
- Instability Detection: a sharp rise in BGP session flaps might indicate growing instability and routing issues, leading to performance degradation or eventual outage
Back to top
Log Analytics
Selector’s log miner collects and analyzes log data in real-time with no manual effort. Unlike other tools where commercial search features and regex patterns are utilized, Selector’s log miner leverages ML techniques to cluster logs together, eliminating the need for regexes. You can also extract entities from the logs to enrich and add context using NER (Named Entity Recognition). These features help translate raw logs into events, which can be further used in correlations.
The ML process acting on the raw logs includes the usual AI steps of training (through normalization and clustering and NER) and operational inference, which helps to render raw and cryptic signals into more natural and helpful information in the mined logs.
Back to top
Event Correlation and Root Cause Analysis for Smart Alerting
Selector Software (S2) includes AI-driven root cause analysis (RCA) to correlate operational violations and automate the detect and repair procedure as much as possible.
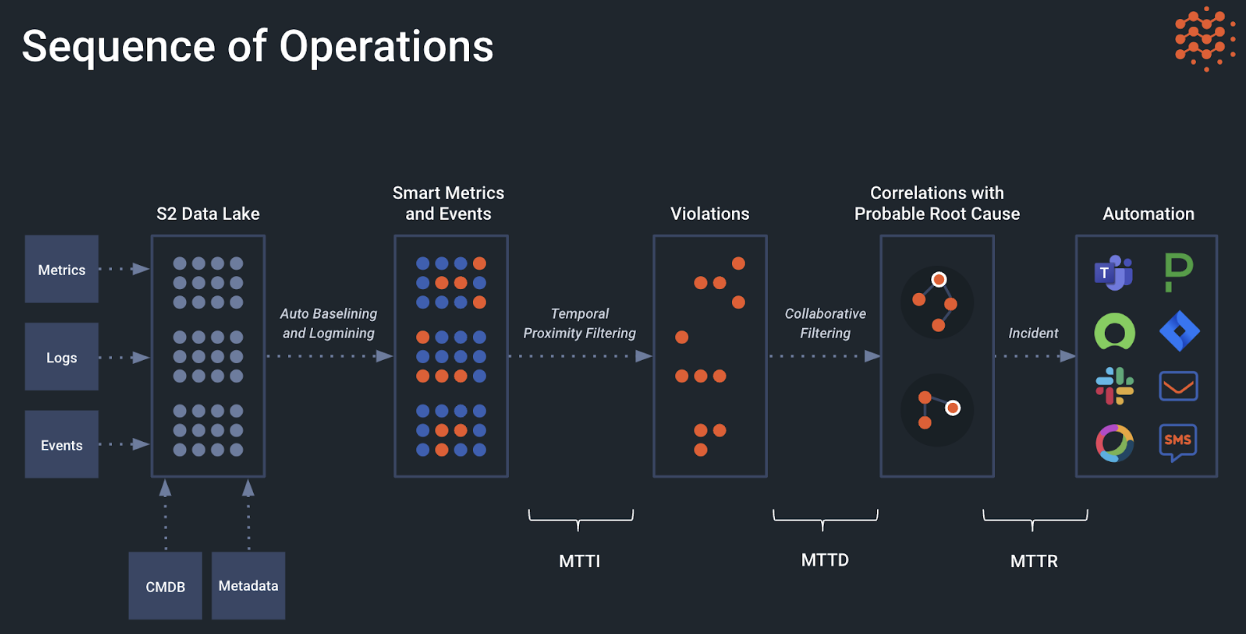
Incident investigating and troubleshooting with legacy tools relies heavily on manual effort to visually identify and confirm anomalies across multiple tools. With Selector’s automated correlation using recommender models, it’s always running in the background to correlate information across time series, logs, and other data ingested in real-time. Information in this deep “data lake” is evaluated and correlated using smart metrics and events to tell a story about the root cause, when it happened, and the reason behind it. This baselining and log mining is then used in smart alerting and ticket creation resulting in improvement to the mean time to identify (MTTI), mean time to detect (MTTD), and mean time to repair (MTTR) sequence. The correlation itself is both temporal and contextual, and hence, the relationship between the events shows a more basic cause and effect. In addition to these, alert deduplication is also performed, helping with alert fatigue.
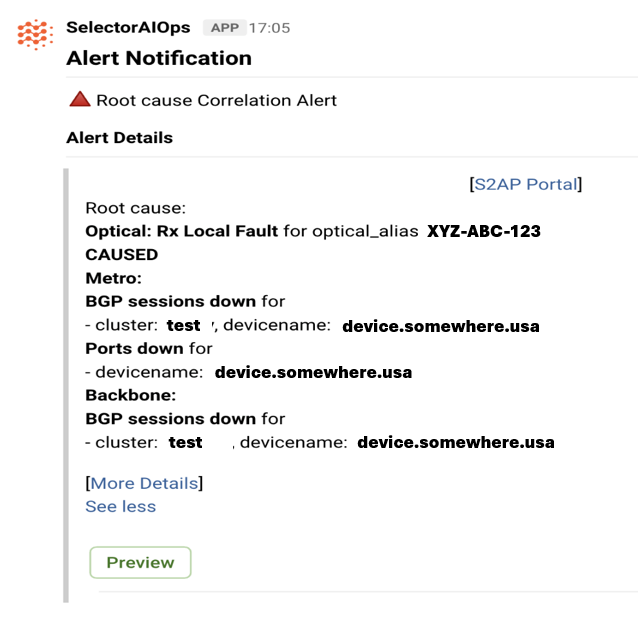
The relationship between source events and the web they create can be hard to understand without Selector’s AI and ML techniques.
Alert Notifications help users focus on the root cause and filter out distracting events.
Back to top
Forecasting and Predictive Analytics
Selector’s robust capacity management and modeling capabilities enables customers, through the automated detection of traffic anomalies, support capacity planning and related operations activities. Selector further supports various forecasting and numerical analysis techniques through which to determine how discrete KPIs will behave in the future.
Forecasting-Based Analytics
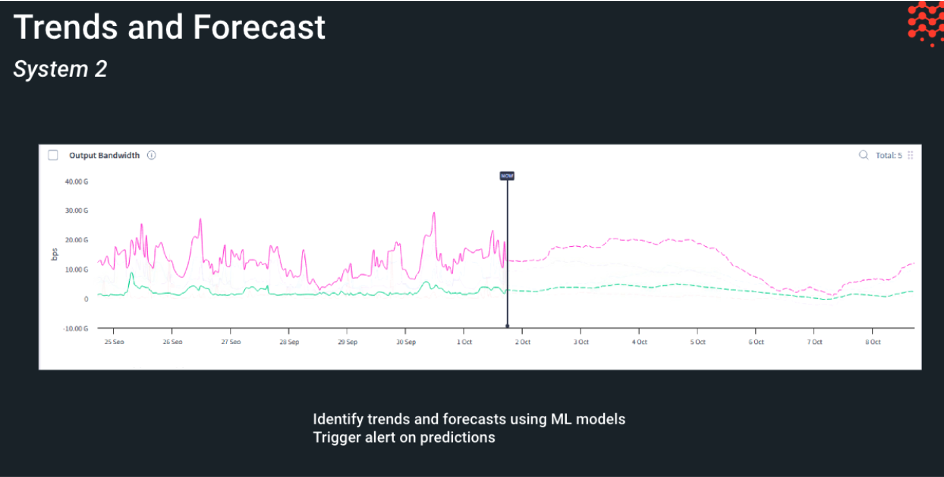
- Establish trends and forecasts to learn when a metric might hit a predefined threshold
- An ideal choice for capacity or some health metrics such as disk, bandwidth, CPU, memory, temperature, and so on
- Proactively generate alerts based on a forecast made for the relevant metric
- Use robust linear and non-linear trend detection LM techniques
- Use the same dashboard-builder UI as other features
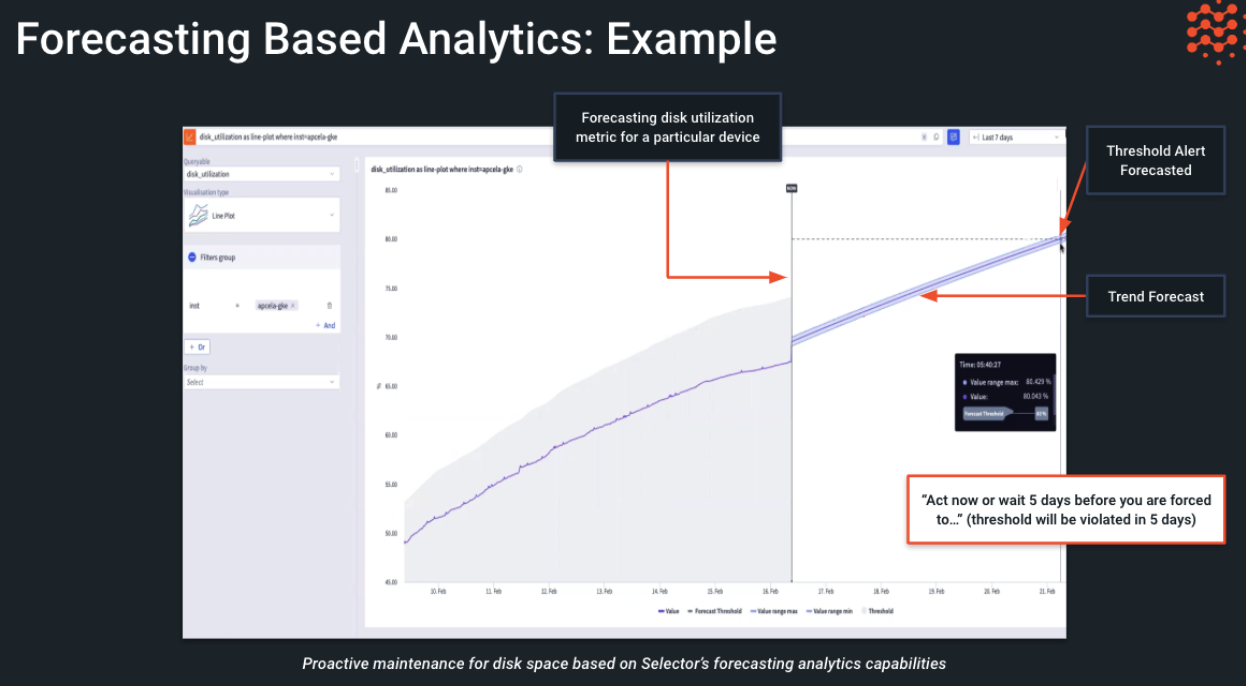
Leveraging previously defined capabilities, the Selector platform also performs predictive analytics in a few ways, such as:
- Time-series forecasting: for metrics where forecasting is needed, the Selector platform provides the capability to zoom out in the widget to predict values for the future. Additionally, there is continuous AI work to create an alert based on a predicted value. These could be applicable for memory utilization, interface utilization, and so on.
Event Trends
- Entities trending high identifies entities that alert frequently based on labels.
Trends are tracked in a variety of ways, summarized and detailed below
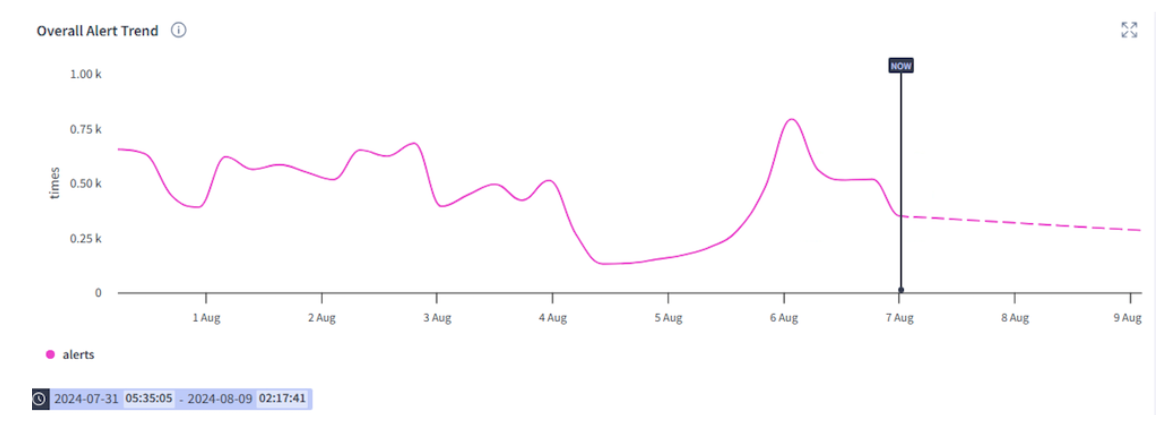
- Overall event trend
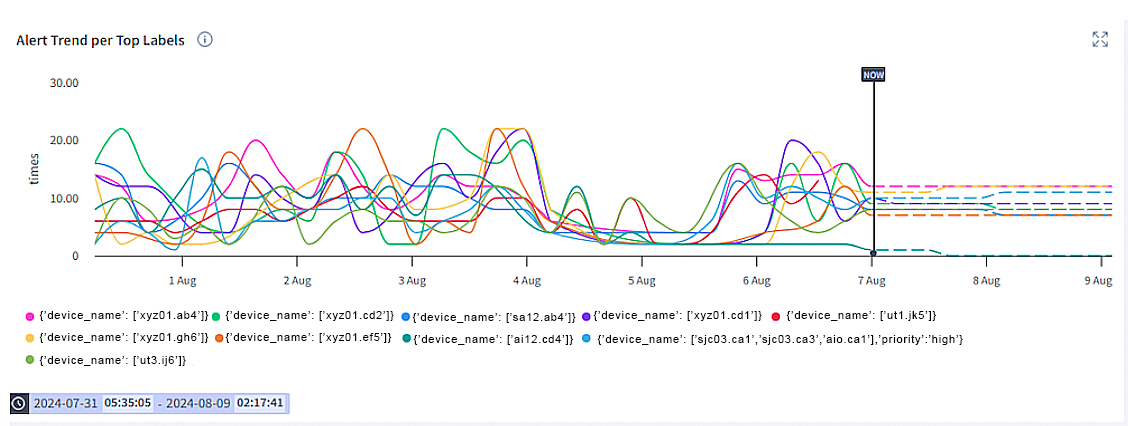
- Event specific trends
- Event predictions
- Sequential mining
Overall event trend observes the overall trend of a particular alert
Event-specific trends: Identify trends of top events and forecast the occurrence accordingly
Selector also performs event predictions based on the number of occurrences of a given event with a given set of labels (a shared factor). These metrics can then be used to forecast the occurrence of the same event occurring in the future.
Event Predictions
- This feature predict events across different networks or sites that are disjoint based on historic event occurrences and deriving hidden connections between networks. Events occurring on (device1, site1) could have an impact on (device2, site2)
- Based on events occurring together historically, Selector can derive connections between them and use this as the base for predictions
Sequential Mining
- This feature performs sequential mining on events occurring in a particular sequence. This would be particularly useful to identify patterns where the sequence of occurrences is important
Selector combines all the above to provide topology-aware correlation analysis
Selector provides the capability to visualize devices and their associated topology. This is visualized to two main ways:
Geographical Representation of Devices Based on Health
Selector can show a geographical and topological representation of all devices in a site based on device health.
Represent the Topology of the Network or Segment
Selector can represent the topology of the entire network or a segment. The topology can be derived in multiple ways including LLDP/CDP, IGP state, or even directly through flat files. There also could be requirements around representing a service layer topology for which Selector can leverage tunnel endpoints or service level information to represent the topology accordingly, as the implementation is generic to accommodate and extend to any type of topology (physical, L2, L3). These can be color-coded based on various metrics, such as interface utilization. Capabilities such as hovering over to provide metric values or clicking for a query chain drill-down to a device or a link level are also available.
Back to top
Copilot and Natural Language Queries
Selector supports an integrated Natural Language Model (NLM) and Copilot to enable users to conversationally query the system. This enables plain language interaction to learn more about evolving incidents and to otherwise interrogate the telemetry being collected by the system. Copilot can be configured to perform a variety of different tasks, with many customers choosing to leverage it for its ability to summarize the various insights being returned by the platform in a clear and concise manner.
Interactions can be done in Slack, Teams, and other Chatops interfaces.
Natural language queries flow down from the user interface through the collaboration service LLM and the S2 query language to knowledge service, which has direct access to recorded events and metrics through a database query language. The database and S2 response is sent through an LLM for summarization, and present to the user as a series of summaries, visualizations, and recommendations.
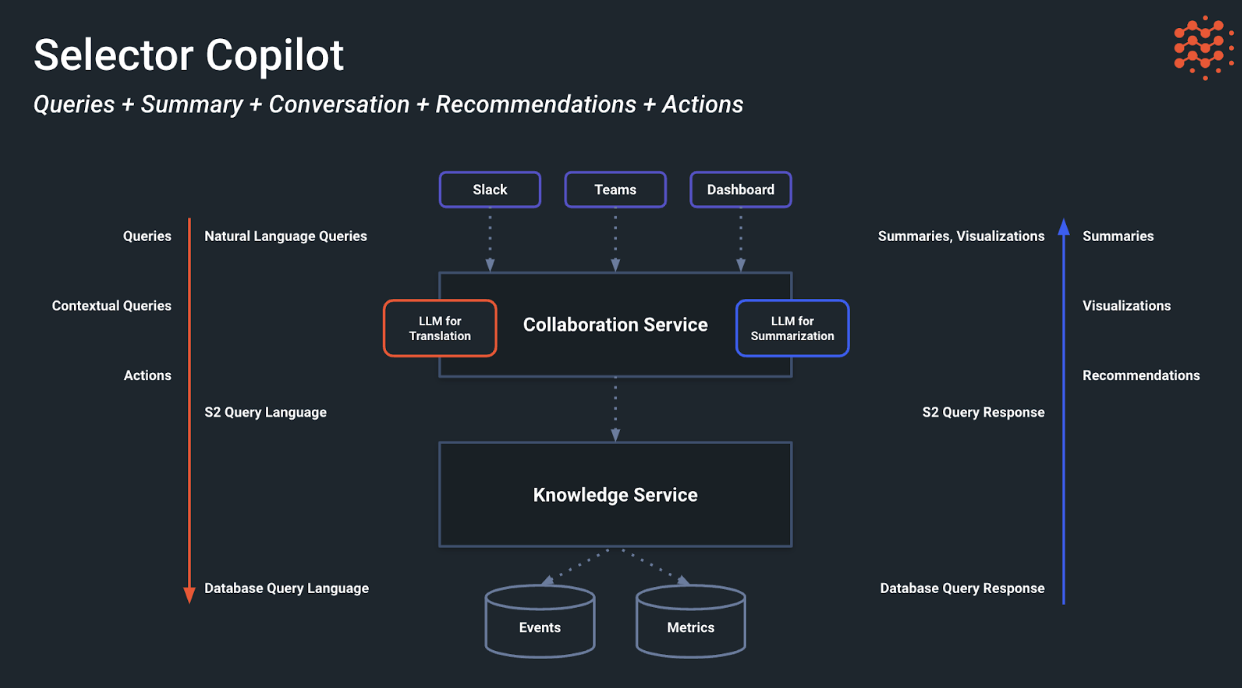
The Selector platform takes natural language input and responds either with widget outputs (if used in the query bar) or provides summarized responses (if the chatbots are used).
Additionally, all interactions can be done using Slack or Microsoft Teams. Additional materials can be provided to see deep-dive material on Selector Copilot and the industry’s first Network Language Model.
Back to top
The Role of Kubernetes in Auto-scaling
Selector is based on Kubernetes microservices and consists of four functional layers. From bottom to top, as detailed above, these are:
- Ingest data from source (the data collection service)
- Transformation through metadata (the data hypervisor)
- Rules and alerts with ML (the knowledge service)
- Presentation in a user-friendly format (the collaboration service)
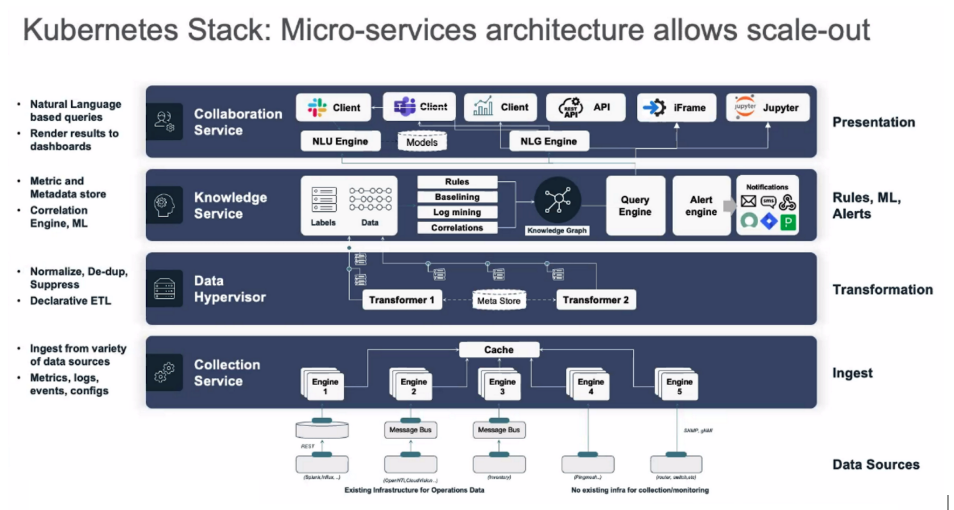
Kubernetes is the factor that allows Selector to auto-scale when events are climbing and scale back when fewer resources are needed.
Back to top
Key Selector Features
Low Code/No Code
The Selector platform is offered as a service. The service includes Selector data scientists and solutions engineers who create, test, and deploy applications that provide automated workflows for network management and service management that the customer wants.
Selector can train customer teams, if desired, on how to develop and customize the Selector platform.
Back to top
Notifications
The Selector platform supports a wide variety of notification formats and templates, and each can be customized to customer requirements. Examples include SMS, MS Teams, Cisco Webex, Slack, Email, Service Now, Jira, PagerDuty, and more.
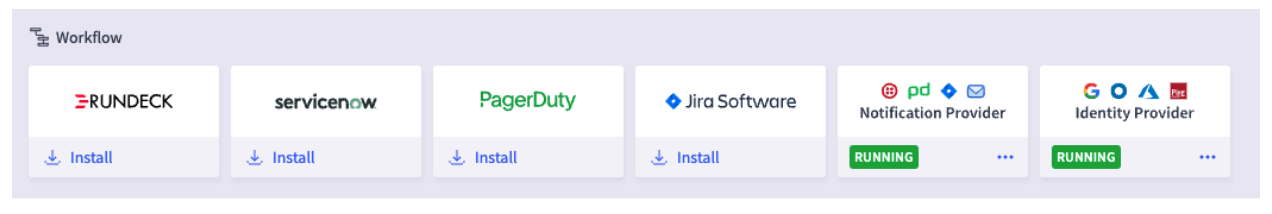
If the customer requires a customized notification endpoint and needed template, the Selector solutions team writes a specification file for it.
Back to top
Flexible UI/UX
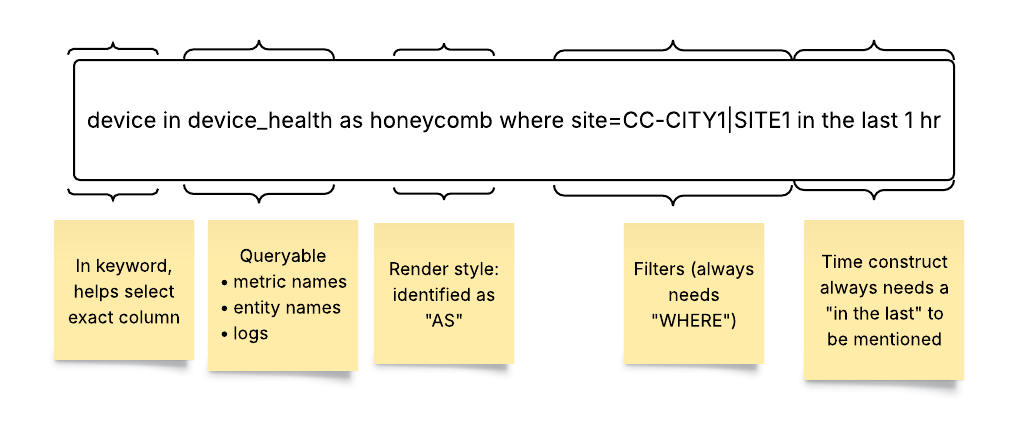
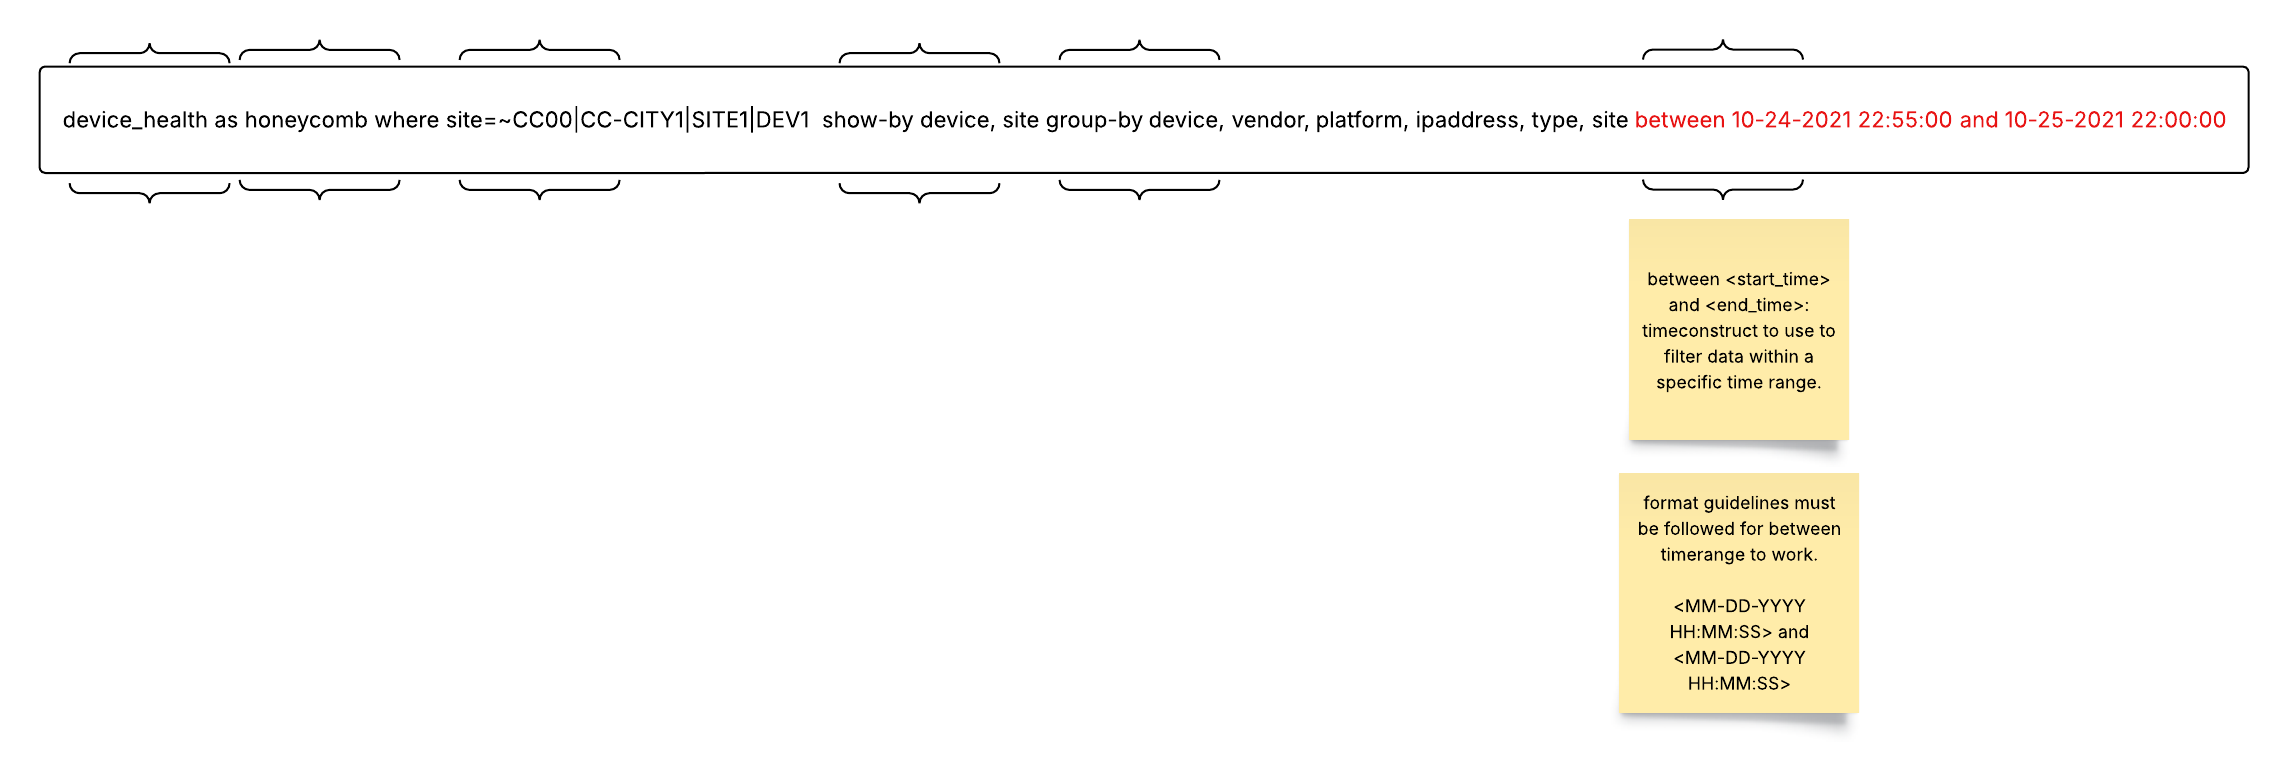
The Selector Structured Query Language (S2QL) is designed to provide users with a powerful and flexible means of retrieving, manipulating, and presenting data.
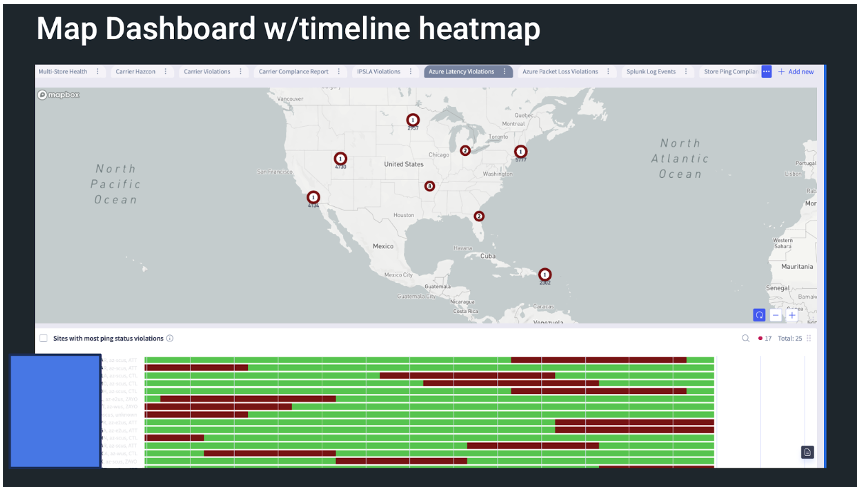
The Selector UI provides a common framework for presenting various data using S2QL. The presentation of the data can be customized for customer formats. The log-based dashboard, sunburst, and map-based dashboard are standard and do NOT require customization. Other UI views are built to customer requirements or customer teams can be trained to build their own.
Here are some examples of the types of data that Selector’s S2QL can present to users.
Logs can be presented with details or as a graphical sunburst.
A map-based dashboard can show a heatmap of normal operation and anomalies.
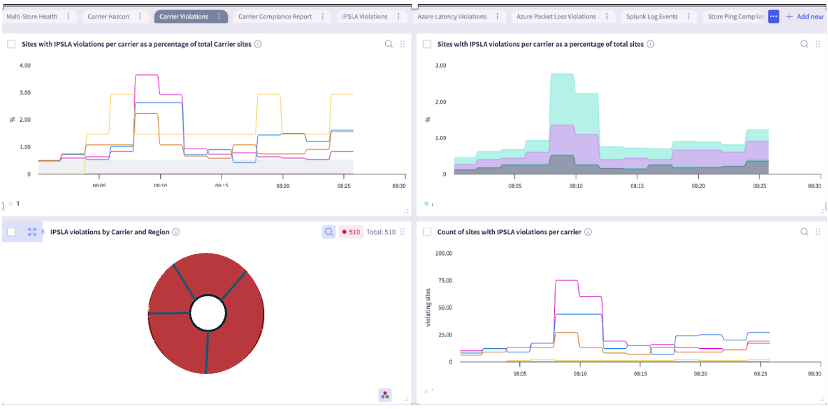
Various widgets can show operational violations in several ways.
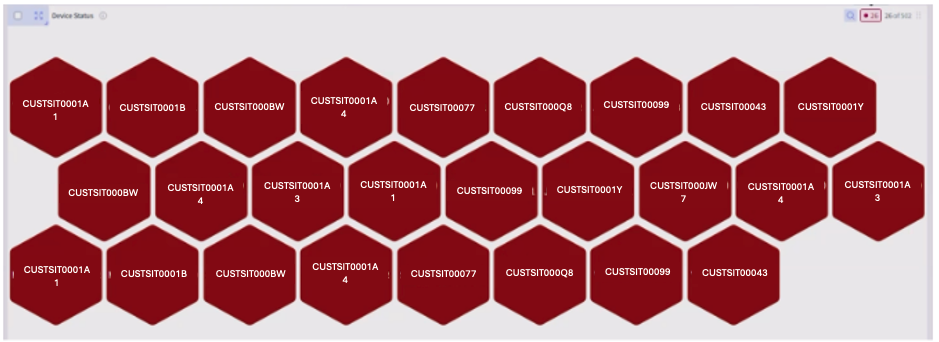
Honeycomb widgets are effective to convey a quick overview of the entire network.
The Selector analytics platform incorporates machine learning and AI in multiple places:
- Auto-baselining of thresholds for metrics
- Clustering of syslogs and named entity recognition
- Event predictions
- Correlations and topology-aware correlations
- LLMs for summarization and Chatops
Back to top
Multi-Language
English is the supported language in the Selector platform. Selector is open to exploring multi-lingual support as part of a commercial engagement.
Back to top
Storage for On-Premises Solutions
The total available storage and storage retention are based on individual customer requirements. For on-premises solutions, the customer hosts the VMs and Disks that the Selector platform uses. Selector uses LongHorn to replicate the data stores across the cluster.
For Selector’s on-premises solution, we guide our customers on best practices for backups, system redundancy, and disaster recovery tailored to their specific setup.
Selector has an internal monitoring solution (using Selector) for on-premise and cloud deployments to monitor the resources being used.
Back to top
Next: System Implementation
1.4 - System Implementation
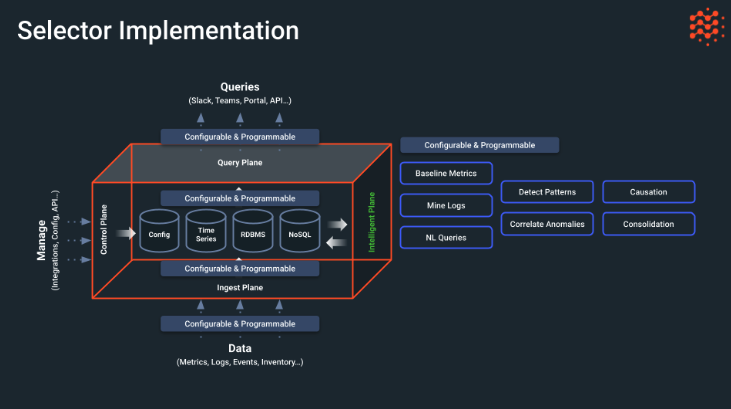
Selector implementation can be visualized as a number of planes representing aspects of software interactions. There are four main planes to the Selector software “cube”:
- Ingest Plane—The data, such as configurations, inventories, logs, or metrics, that flows into Selector is configurable and programmable, both before ingestion and after. The data is kept in a series of data stores for configurations, time series events, a relational database, and in NoSQL format. The other planes all interact with this central information store.
- Control Plane—The Selector software is managed and controlled by a configuration interface. It can also be managed by way of APIs or some other integration technique. The aim here is to be flexible.
- Query Plane—Users can interact with Selector by means of natural language queries instead of arcane commands with cryptic variables. These interactions are also configurable and programmable and can be accessed through portals such as Slack, Teams, and API, or other portal type.
- Intelligent Plane—A special feature of Selector is the inclusion of AI and ML in its operation. Selector uses AI and ML to detect patterns, determine causes, consolidate alerts and alarms to cut down on unhelpful storms, and correlate anomalies when they occur. Here is where the natural language query is interpreted, baseline metrics established, and logs are mined for every hint of useful information.
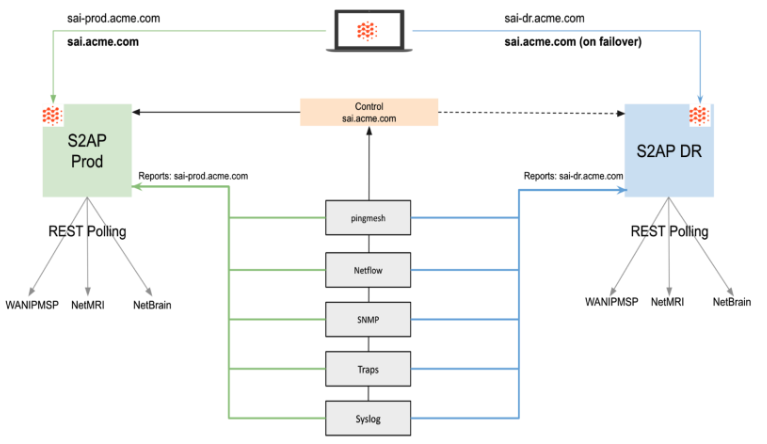
Selector offers a redundant architecture that distributes the Selector application and related data across multiple regions for protection against site-specific failures. Advantages of this model include rapid deployment, minimal application changes, reduced client-to-platform latency, and potential increased read capacity.
The solution is configured as follows:
- Ideally configured in two disparate regions.
- Overlay DNS is used for the active Selector deployment.
- Data Collectors simultaneously publish collected data to each of the two Selector deployments.
- Deployment configuration is also synced between the two associated Selector deployments, ensuring relational data such as user records, dashboards, alerting rules, and so on are present on both deployments.
The architecture has a central control that can connect to either the primary S2AP production environment or the standby S2AP disaster recovery (DR) site. All features are redundant in both areas.
Data Ingestion
Selector integrates with and is otherwise able to ingest telemetry (metrics, logs, events/alerts) from Splunk, cloudwatch, Azure Monitor and Thousand Eyes. Additionally, Selector can both receive alerts from Grafana AlertManagers, while also enabling Grafana to visualize telemetry from the Selector platform.
Selector supports over 300 integrations today and is adding new integrations on a nearly daily basis. Selector supports a native ability to work with Otel metrics and logs. Prometheus data can easily be submitted to the platform via remote-write, or alternatively we can scrape the Prometheus endpoints directly.
Robust anomaly detection and event correlation are applicable to these data sources and many more. Selector customers can either submit standard syslogs directly to the platform’s syslog endpoint. Alternatively, Selector can reach out to intermediate logging platforms such as Splunk and ElasticSearch and pull the logs via their API.
Selector can integrate with and pull topology from ITSM/CMDB tools such as ServiceNow, Netbox, Nautobot, BMC Remedy, and others. Webhooks can be both received and sent by the platform for exactly this purpose. The Selector platform can integrate directly with a broad variety of platforms such as Pagerduty, Opsgenie, Ansible, Puppet, Itential, Gluware and others to enable response workflows and automated remediation.
With Selector, metadata is identified and extracted from a variety of data sources. This metadata is then used to enrich telemetry and ultimately produces higher-fidelity correlations.
This feature is used by nearly all of Selector’s customers, and is one of our most significant differentiators.
Selector Log Miner can process syslog messages. Through a combination of normalization, clustering and name entity recognition (NER) Selector can automatically identify log patterns and robustly extract metadata (e.g., interface name, IP address, etc.)
Selector supports ML-driven baselining of time series to enable the Platform to understand what is normal for time of day (cyclicity) and what is normal for time of year (seasonality). Using the baseline, Selector can robustly identify anomalies within time-series data.
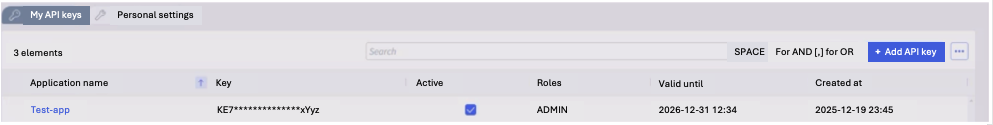
Accessing Data Using APIs
The Selector platform can ingest any data in any format, but users can also access the platform using APIs to better integrate with other tools. Every widget that Selector creates has an API end point created by wrapping the query inside.
The Selector APIs are aligned with the TM Forum industry standard Open APIs/interfaces and support encryption.
The API key can be downloaded and used as part of the API to retrieve data.
Next: System Operations
1.5 - System Operations
Selector Solution Operation
The Selector platform offers many ways to view and control system operations. The major methods are described in this section.
Device Monitoring
Multiple widgets are built to monitor a specific device. Selector dashboards are customizable and provide an easy way to navigate through the platform using multiple ways. Every data source has its own dashboard to view raw data and to derive additional metrics from it. There are also drill-downs associated with each. Note that these drilldowns and dashboards are highly customizable and if the customer desires a different representation, this is easy to do.
Static dashboards are yesterday’s way of finding data. Our dashboards can be dynamically rendered as a result of the questions asked in Slack, for example, and all the operations teams can have joint access to the information to troubleshoot and address a network or IT incident.
Operations teams need the relevant information to be rendered in order to analyze a problem, for the specific context, and in the place that it is necessary. The days of having to learn complex structured query languages to find the information you need, across multiple tools, are gone. Operations engineers need to be able to articulate questions using natural human language and get the responses they need.
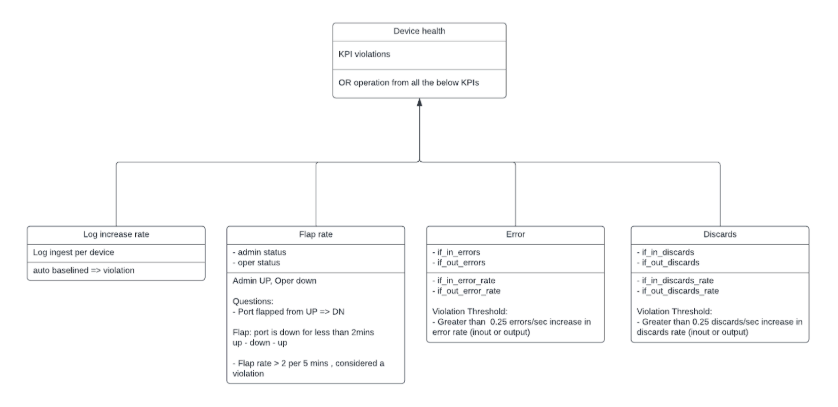
For a specific device, KPIs are derived currently from thousand eyes, vmanage, SNMP and respective device logs. Device health is determined by considering KPIs from all previous sources. Any violation color codes the device health so that the user can easily identify unhealthy devices. Necessary drilldowns are created from each data source to enable the user to view the exact raw detail and the derived metric or KPI.
You can easily view only violated devices when the honeycomb contains many devices.
In addition, Selector reviews the timeline for a specific window to see how the health of devices has changed.
You can view specific device metrics by drilling down into a device, revealing more and more details.
You can also easily search for a given device from the dashboard honeycomb. The search bar is implemented as a screen scrape making it easy to search for multiple patterns.
Selector provides self-monitoring as part of the Selector product suite. This software collects system performance data related to the Selector deployment, collects metric, log and event data, and otherwise supports alerting and notification for the Selector support team, as well as customer staff.
Drilldowns also contain a dashboard called Original Analytics to help the user understand where the drill down came from. You can also navigate to other drilldowns easily with a simple click.
Identification of Anomalies
Anomalies surface when outliers are detected based on the variously derived metrics. Derived metrics are created for generating KPIs and can be helpful in aggregating information.
Labels are also added as part of this activity.
The methodology Selector uses to identify anomalies is customizable. The same customization applies to training windows for baselining and static thresholds. If there are additional parameters that need to be added, they are easy to add.
Device health is determined by several methods:
- SNMP
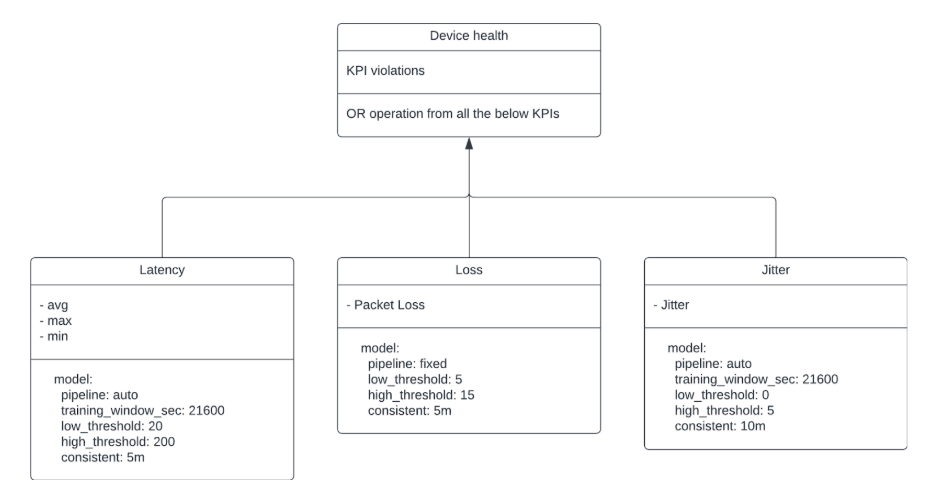
- Thousand eyes model
- Vmanage
- Syslogs
Each is detailed below.
SNMP
Thousand Eyes Model
Not all routers have thousand-eyes agents. When drilling down to a device, the Selector platform might not notice thousand-eyes KPIs.
Vmanage
Only Vmanage inventory and events are considered. The Selector platform catches events associated with Vmanage and uses these events for correlations.
Syslogs
As described previously, Syslogs are mined to capture events and entities. These are used for further correlations. Additional insights are generated based on the number of logs and the number of events occurring for a specific device.
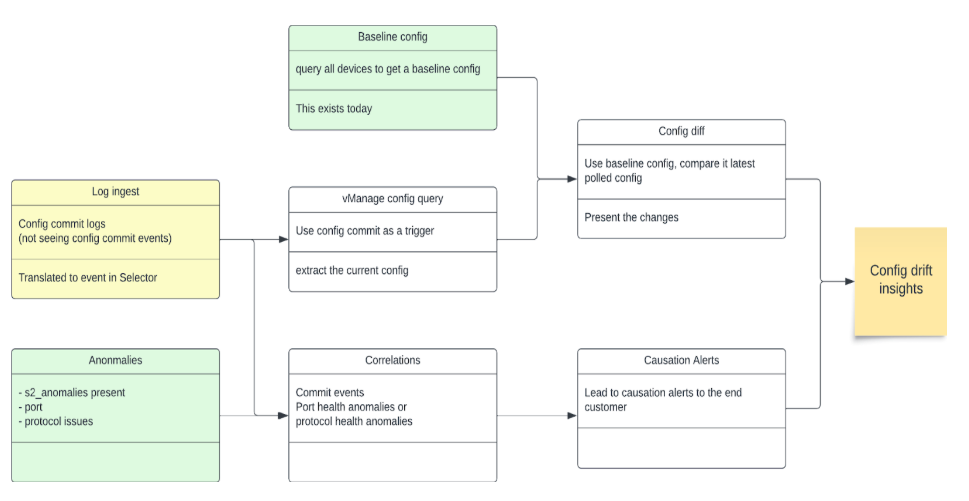
Configuration Drifts
The Selector platform also determines configuration drifts and use that data for correlations to identify specific configuration changes that lead to an event or degradation in performance.
Correlations
Using all data sources, device monitoring, and anomaly identification methods, the Selector platform performs both temporal and contextual correlation. Two models are used in most cases to achieve this post-temporal filtering:
- Recommender models identify the correlation of various events
- Association models identify causal relationships
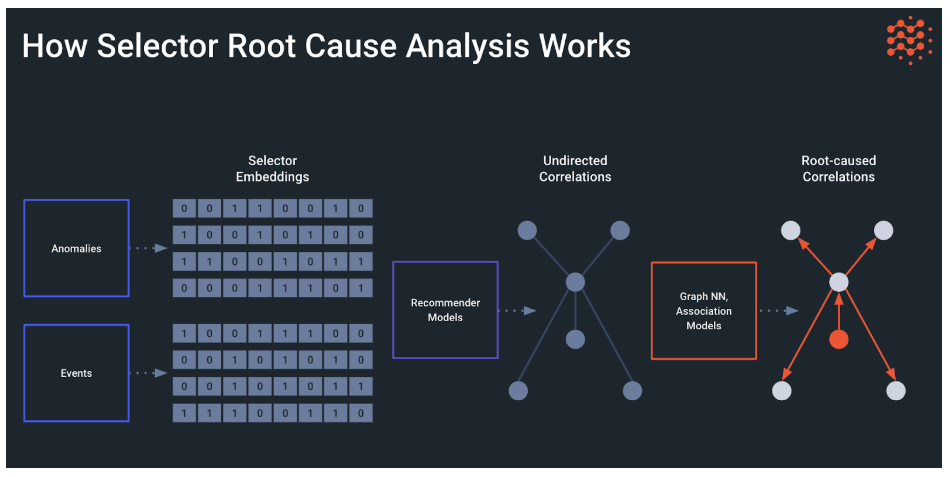
The two models used together helps to provide root cause analysis (RCA) and help in identifying the issue faster reducing MTTI, MTTD and MTTR.
The same concept applies for both WAN and wireless analytics.
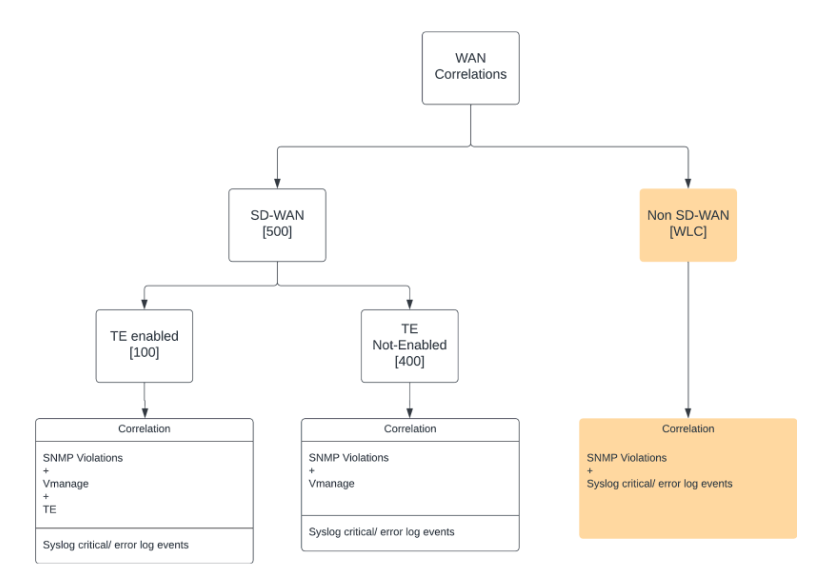
The Selector correlations dashboard has three tabs (wan, wlc, meraki). They are split for user readability because the undirected graph tends to get busy. There are various ways to filter the graphs based on labels and events
For example, the determination of a device whose health violates some condition is made by considering both thousand-eyes data and SNMP data. The same correlation summary is translated into an event.
Correlations are done on a per device basis. Selector can work with the customer to modify the correlations to include more consolidations, including connected sites and devices connected over SDWAN.
Instant Correlations
Instant correlations occur when the Selector platform looks not at 10-minute historic windows to perform correlations but looks at the current time to perform instant correlations based on various events. These events can also be filtered. This is most useful during debugging.
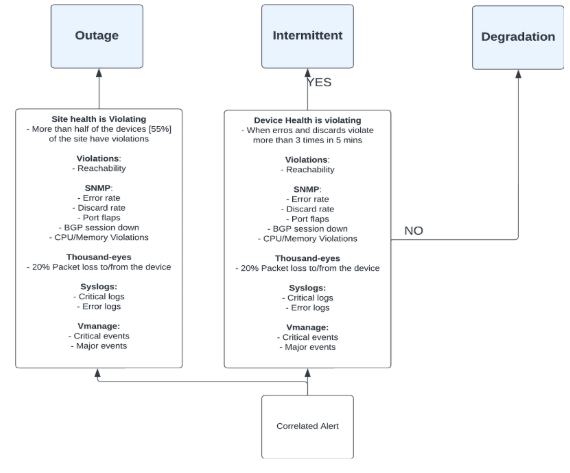
Alert Generation
Alert generation and event-intelligent alert generation are important pieces of the Selector platform. The alerts are not based on individual devices, but on overall associations that have been created. Once the correlated events are identified, alerts can be sent based on various integrations. During the POC, integrations to Email, Moogsoft and Itential can be done. In addition, Slack-related alerts can be demonstrated. If the customer has interest in integrating these alerts into other tools such as Microsoft Teams or others, this can be done easily because these integrations already exist in the Selector platform. The payload is also customizable.
Moogsoft Alert
The Selector platform can also record notifications along with raw and processed payloads that are sent to various tools.
During maintenance windows, the alerts are suppressed and ensure that no alerts are sent out to disrupt maintenance activities.
2 - Integrations
2.1 - Pingmesh Integration
Selector Pingmesh - Advanced Network Observability
Contents
Overview
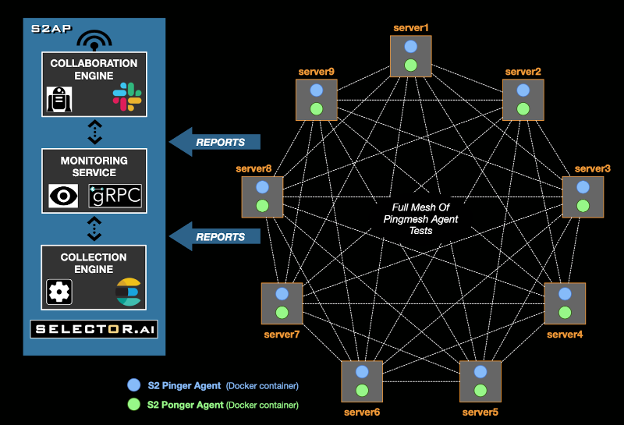
Selector Pingmesh is a comprehensive, synthetic performance measurement solution designed for hybrid networks, applications, and infrastructure. It provides an “over-the-top” mechanism for assessing network health by employing probe agents to continuously exercise the data plane.
The way Pingmesh is used in S2AP is shown in the following figure.
Back to Contents
Key Benefits
Pingmesh operates by deploying agents that generate synthetic traffic to measure critical network metrics. This proactive approach ensures real-time visibility into network performance without relying solely on user traffic.
Core Metrics: Measures latency, packet loss, and jitter.
Path & Reachability: Validates network paths and reachability across the infrastructure.
Protocol Support: Utilizes UDP probes for standard measurements, with support for TCP and ICMP ping probes.
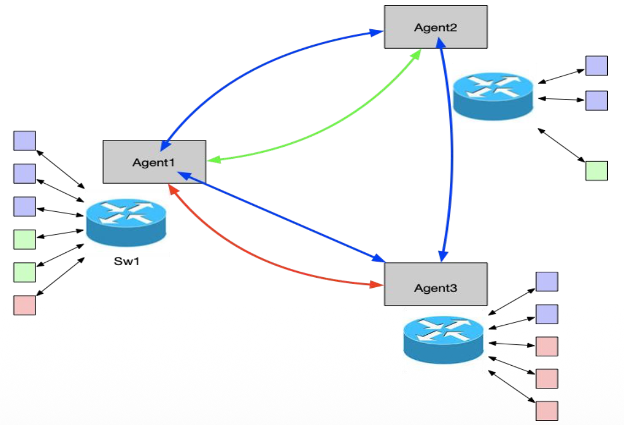
Multi-VRF Awareness for Complex Architectures
Designed for modern, segmented networks, Selector Pingmesh supports multiple Virtual Routing and Forwarding (Multi-VRF) environments.
VRF-Aware Agents: A single agent can act in multiple “pinger” and “ponger” roles simultaneously across different VRFs (e.g., VRF1, VRF2, VRF3).
Resource Efficiency: This architecture reduces the need for multiple agents on a single switch, allowing one agent to validate connectivity across segmented routing domains, as shown in the following figure.
Enhanced Path Validation with ECMP Support
To accurately validate load-balanced networks, Pingmesh employs source port randomization.
Path Diversity: By randomizing the source port or multiple source ports for probe packets, the system exercises different links in an ECMP (Equal-Cost Multi-Path) bundle.
Traffic Simulation: This ensures that probe packets traverse varying paths to the destination, detecting issues that might be hidden by a single static path.
Integrated Analytics with S2AP
The solution is powered by the Selector Software Analytics Platform (S2AP), which acts as the “brain” of the operation.
Correlation: Metrics are correlated with tags (for example, rack, pod, cluster, site) and other logs/events for deeper context.
Visualization: Data is rendered into actionable formats such as threshold violation matrices (heatmaps), line plots, and honeycomb charts.
Back to Contents
Technical Architecture
The Pingmesh architecture consists of distributed agents communicating with a central management and analytics layer.
Components
S2 Agents: Lightweight Docker containers running on network devices (servers/switches) for active Pingmesh.
S2AP: Handles collection, monitoring, and analysis.
Monitoring Service: Manages agent registration and configuration using gRPC.
It is essential to understand the distinction between Active and Passive Pingmesh configurations to select the right deployment model for your network. While both active and passive modes deliver critical health metrics such as RTT and packet loss, they utilize different protocols and have distinct infrastructure requirements. The table below details the operational differences between these two types to help you align the solution with your specific monitoring goals.
| Feature | Active Pingmesh | Passive Pingmesh |
|---|
| Protocol | UDP only | ICMP only |
| Ports | Destination: UDP 52000 (Default) Source: UDP 52001 (Sequential) or 20000-32000 (Randomized) | N/A (Standard ICMP Echo probes do not use transport layer ports) |
| Agent Requirement | Multiple Agents (Requires a “Pinger” and a “Ponger” agent) | Singular Agent (One agent probes a target device or devices) |
| Metrics Collected | Round Trip Time (RTT), Packet Loss, Jitter | Round Trip Time (RTT), Packet Loss, Jitter |
| Traffic Generation | Generates synthetic UDP traffic between agents to stress-test specific paths. | Uses standard ICMP echo requests (Ping) to check reachability of non-agent devices. |
Deployment & Security
Automated Installation: Agents are installed by way of DEB/RPM packages and can be managed using Ansible scripts.
Security: Releases are signed using GnuPG (GPG), and the system supports secure distribution with APT/YUM repositories.
Inventory Management: Devices can be added dynamically using CSV upload or API, with support for automated instance creation.
Key Features at a Glance
| Feature | Description |
|---|
| Probe Types | UDP (default), TCP, ICMP Ping, Traceroute. |
| Topologies | Full mesh, partial mesh, and multi-node S2AP support. |
| Inventory Logic | Flexible grouping by Cluster, Rack, Site, and Suite labels. |
| Visualizations | Heatmaps for quick health checks (Red/Yellow/Green status) and time-series plots for historical trends. |
| Scalability | Supports high-scale environments with automated “fanout” reporting and configurable ping intervals. |
Back to Contents
Example Usage
Network Health Barometer: Acts as a continuous “heartbeat” for the network data plane.
Latency & Loss Monitoring: Precise tracking of packet loss percentages and round-trip latency.
Fabric Verification: Validates connectivity across Spine, Leaf, and ToR switches in complex data center fabrics.
Back to Contents
2.2 - Slack Integration
SelectorAIOps Slack Integration
SelectorAIOps Slack Integration
Selector Software enables customers to monitor, analyze, and share their digital infrastructure performance using Slack and SelectorAIOps. Selector AI’s analytics and collaboration engine hides the complexity of heterogeneous infrastructure and tools. Our turn-key solution sits on top of disparate information sources to provide visibility, monitoring, correlated real time insights and alerting for hosts, devices, infrastructure, and network health and performance. We present these insights in a unique collaborative manner between people, machines, and applications acting in unison enabling teams to interact with the SelectorAIOps platform in the collaboration tool of their choice.
SelectorAIOps provides actionable multi-dimensional insights to network, cloud, and application operators. It provides a query interface to monitor and analyze events and trends. Users can keep their team updated on performance, view alerts, and share dashboards in the specific Slack channels where their team collaborates. SelectorAIOps provides these insights by ingesting metrics from multiple data sources, and doing an analysis on historical metrics and real-time streaming metrics.
Configuration
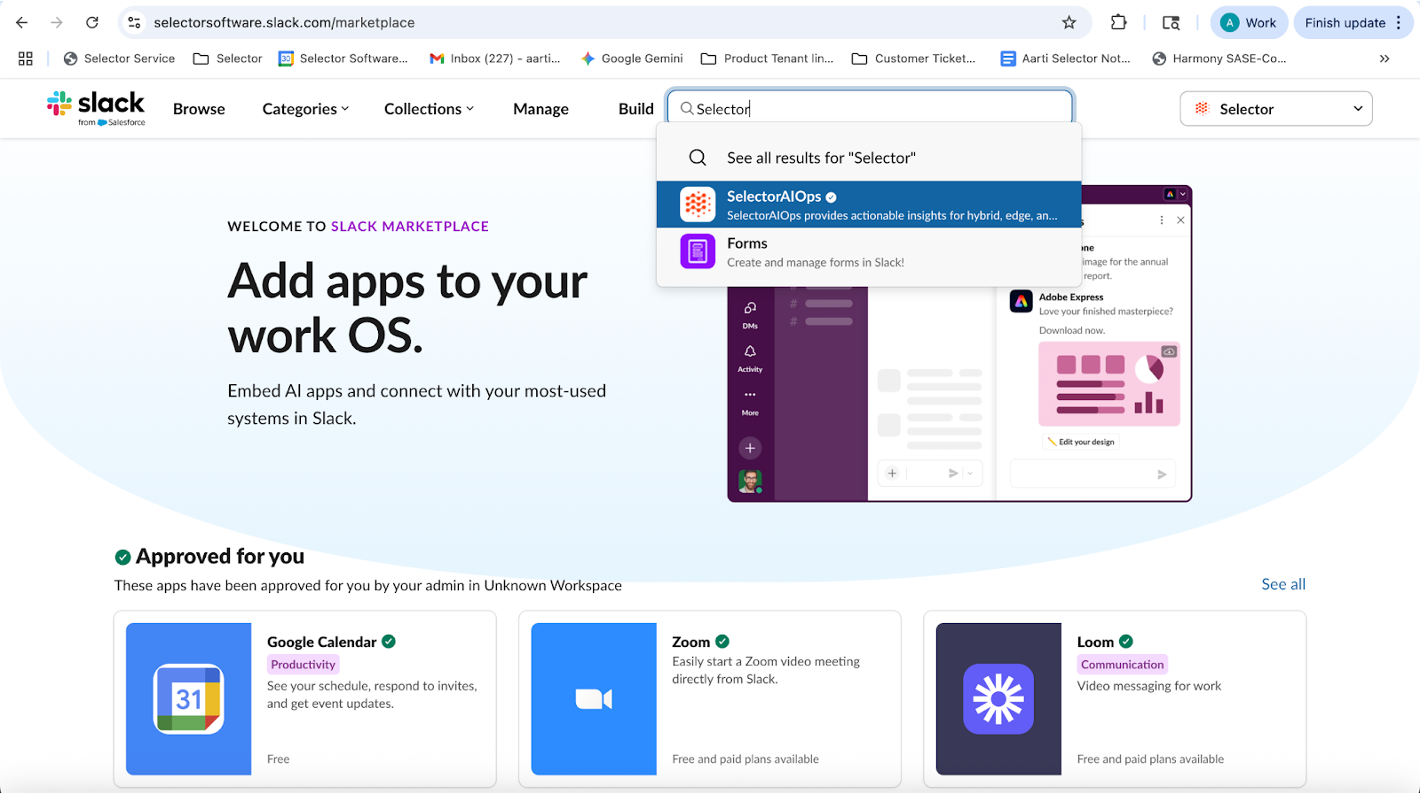
Step 1:Add the Selector AIOPs App to your Slack workspace.
- Ensure that you are signed into your Slack workspace account.
- Find Selector AIOps app in Slack marketplace, and install or add the app to your slack workspace.
- Prior to starting, please ensure that you have the appropriate permissions to install apps in your Slack workspace.
- Reach out to your Selector contact (Solution Engineer or Sales Engineer representative) if you have questions here.

Step 2: Create the Slack channel in your Slack workspace that you want to interact with the Selector AIOPs BOT. You may need appropriate permissions to do this. (For example, test-demo-slack-channel)
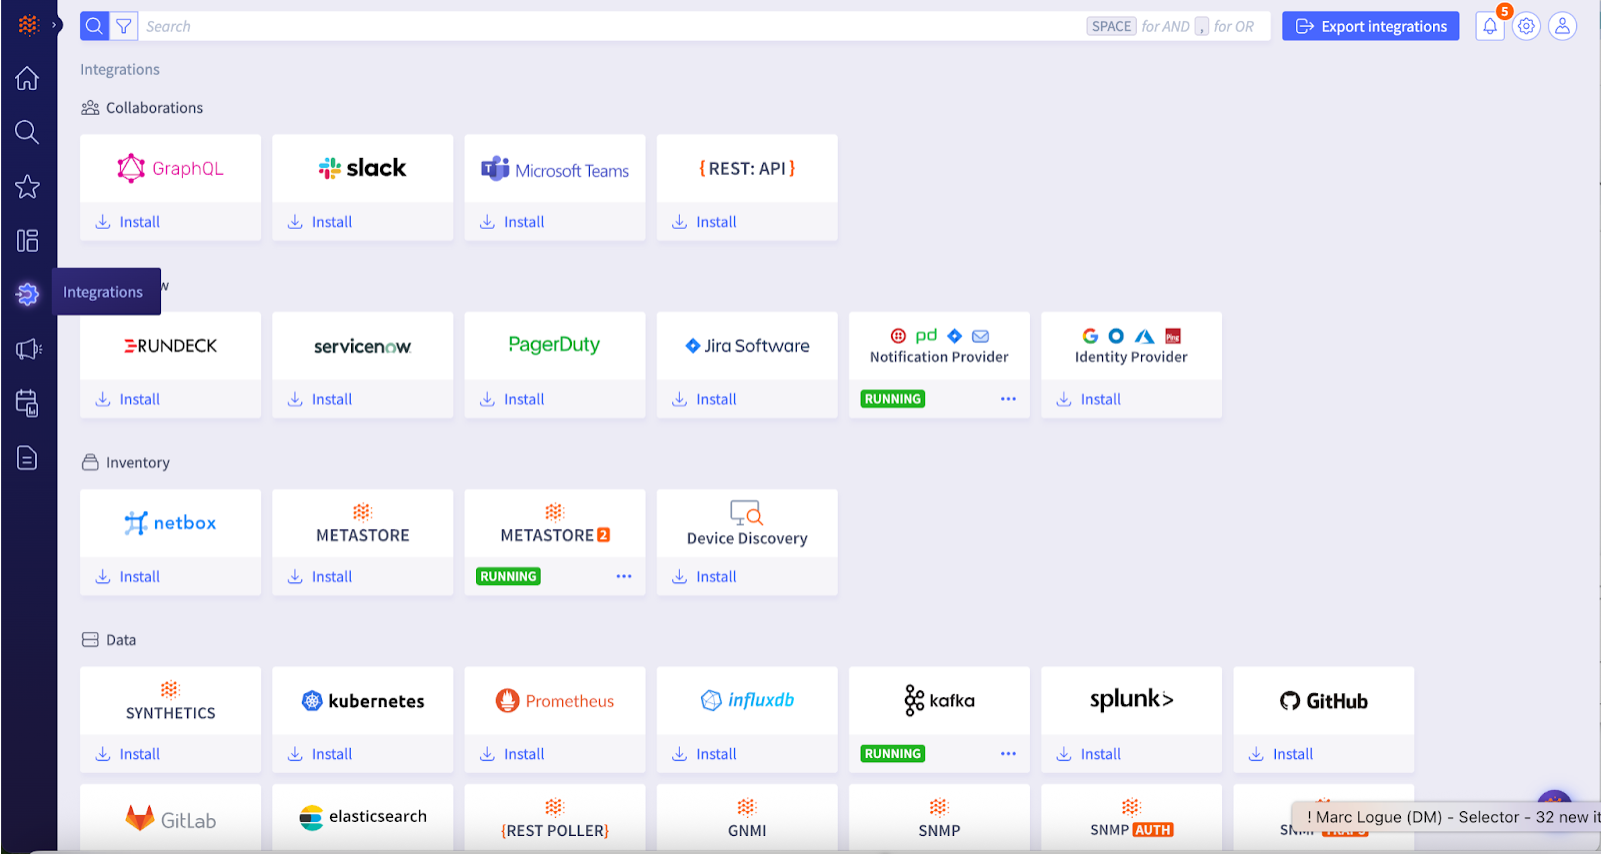
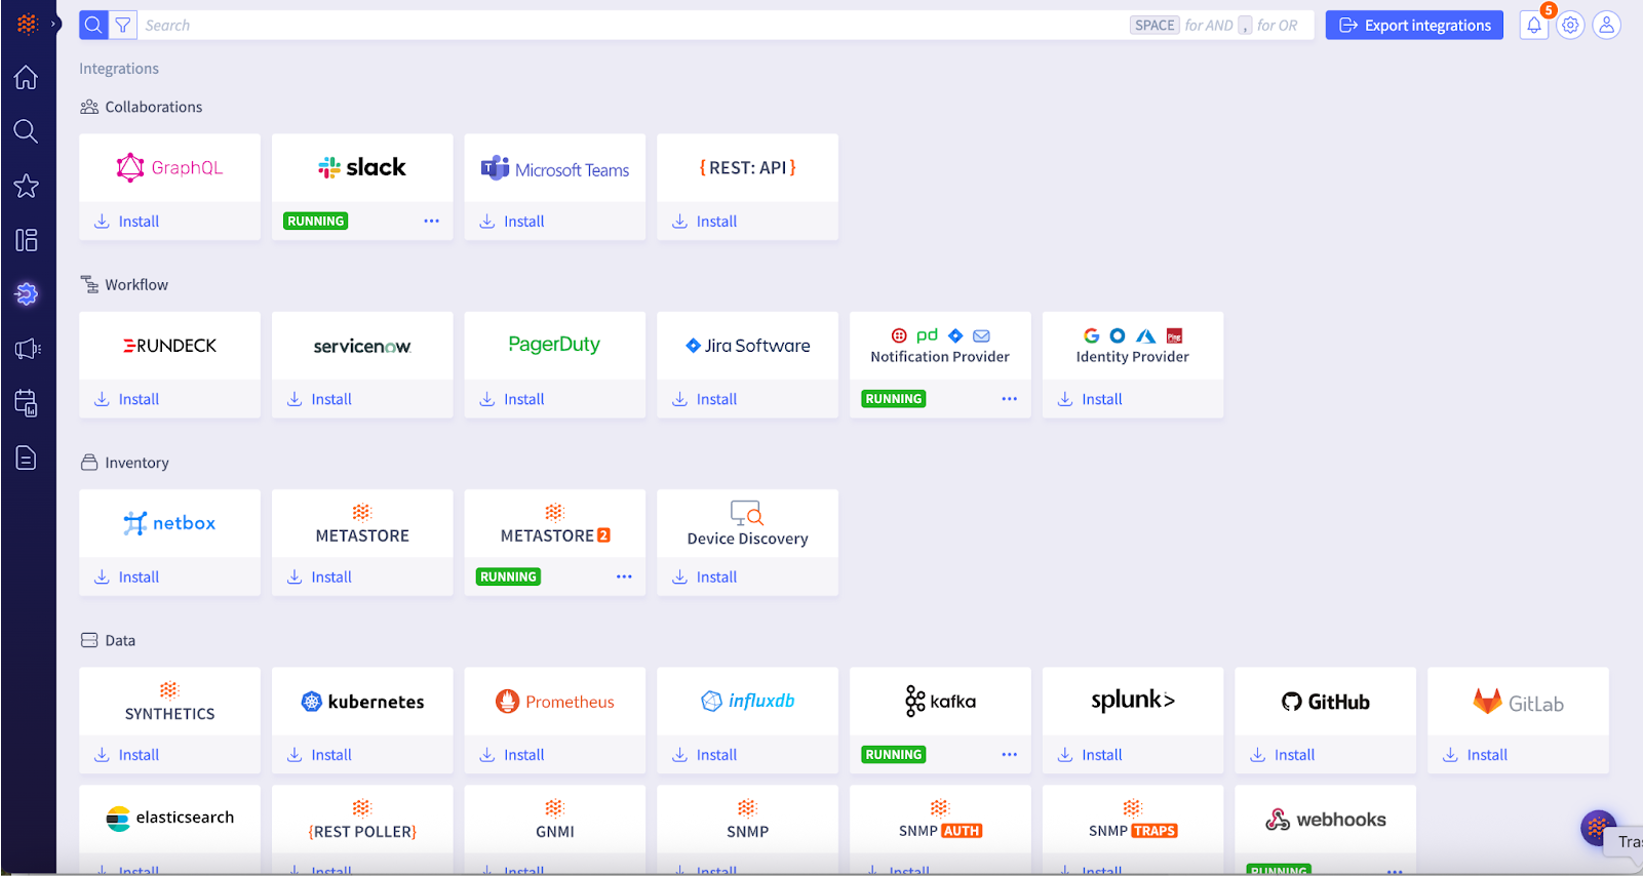
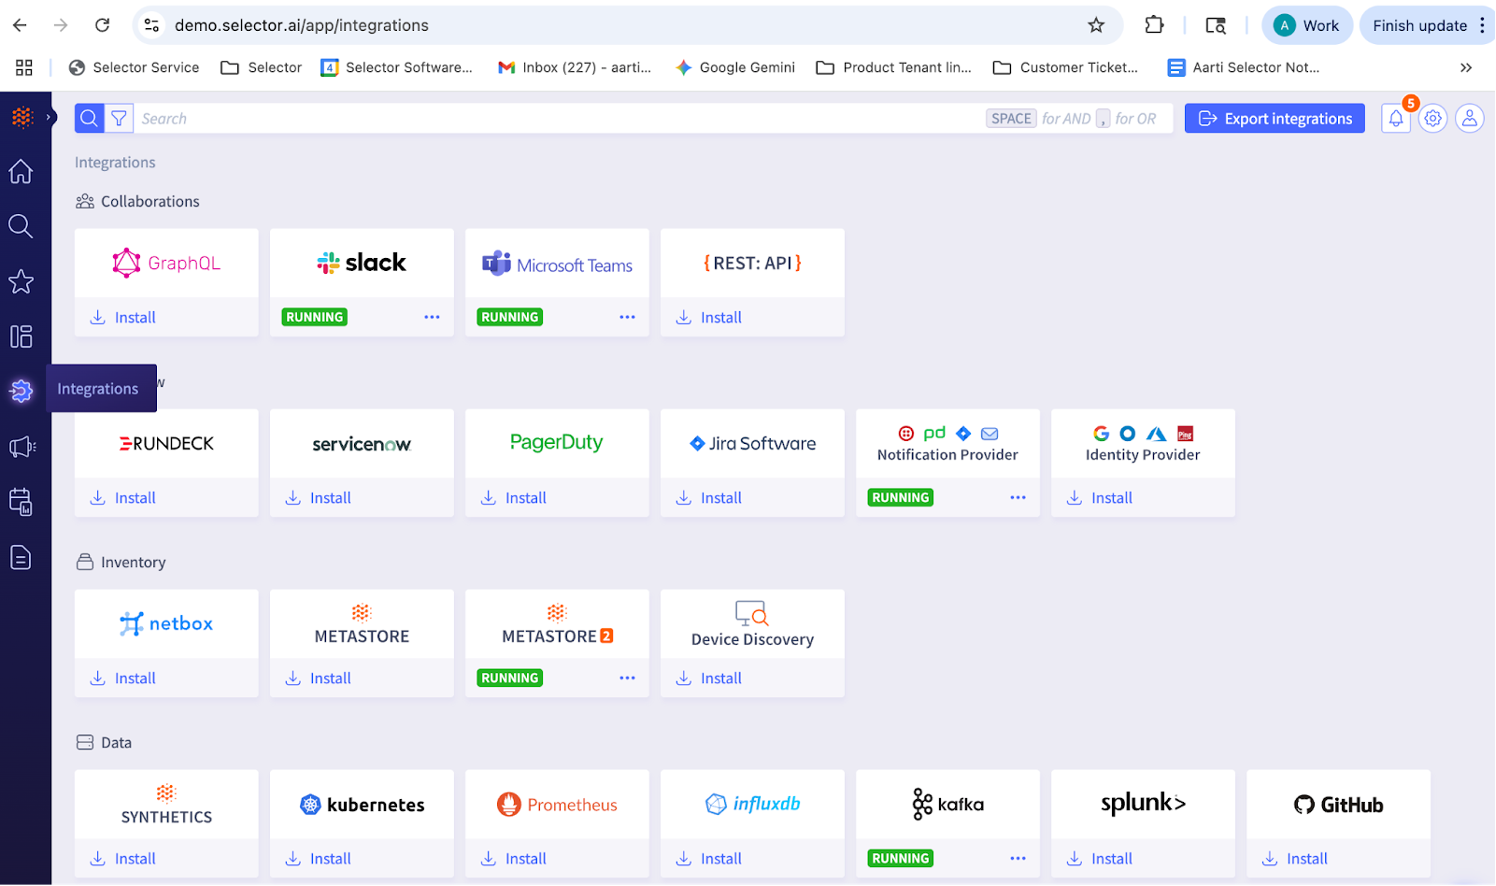
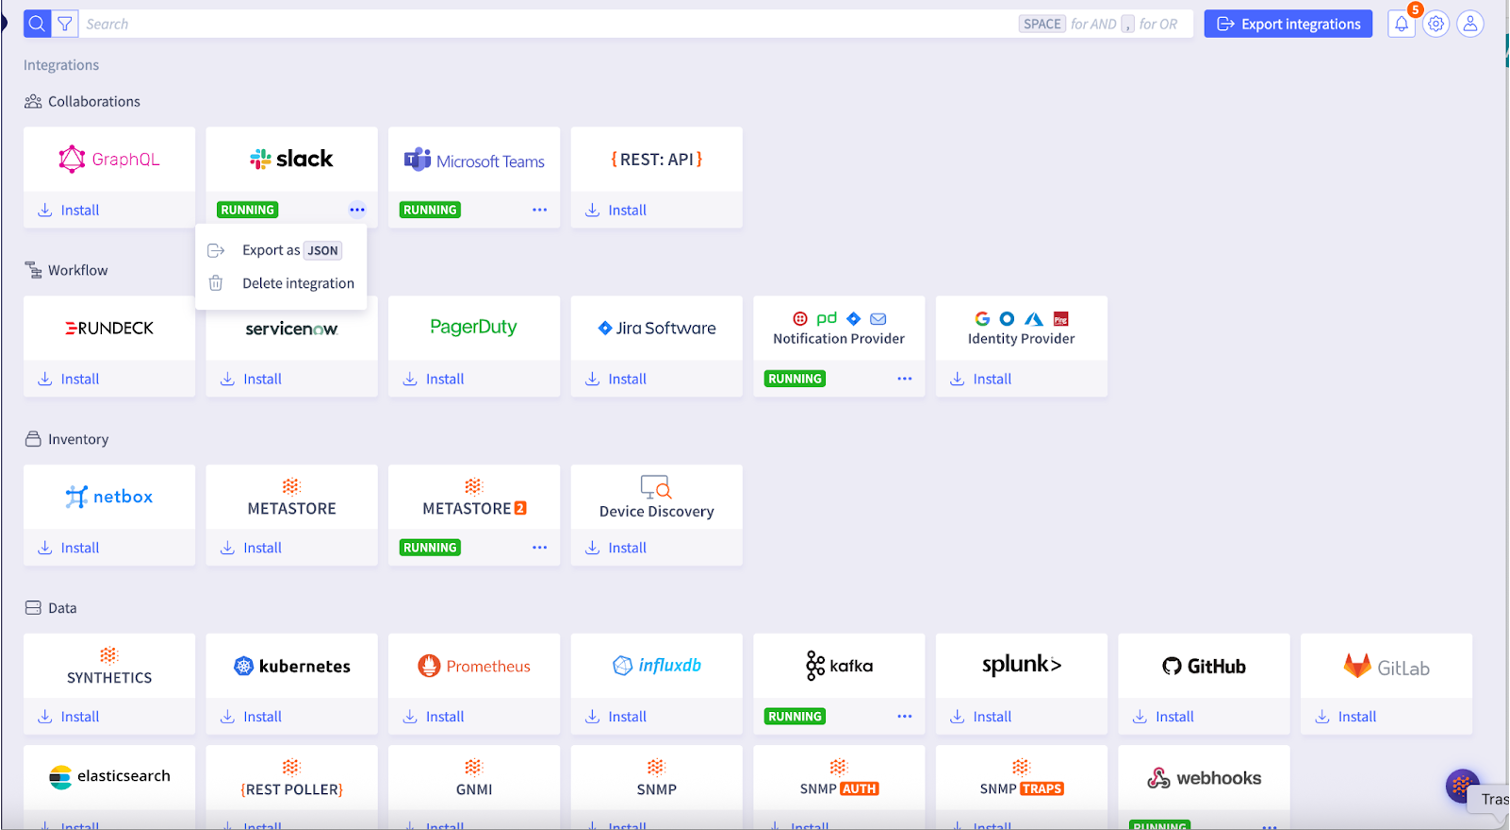
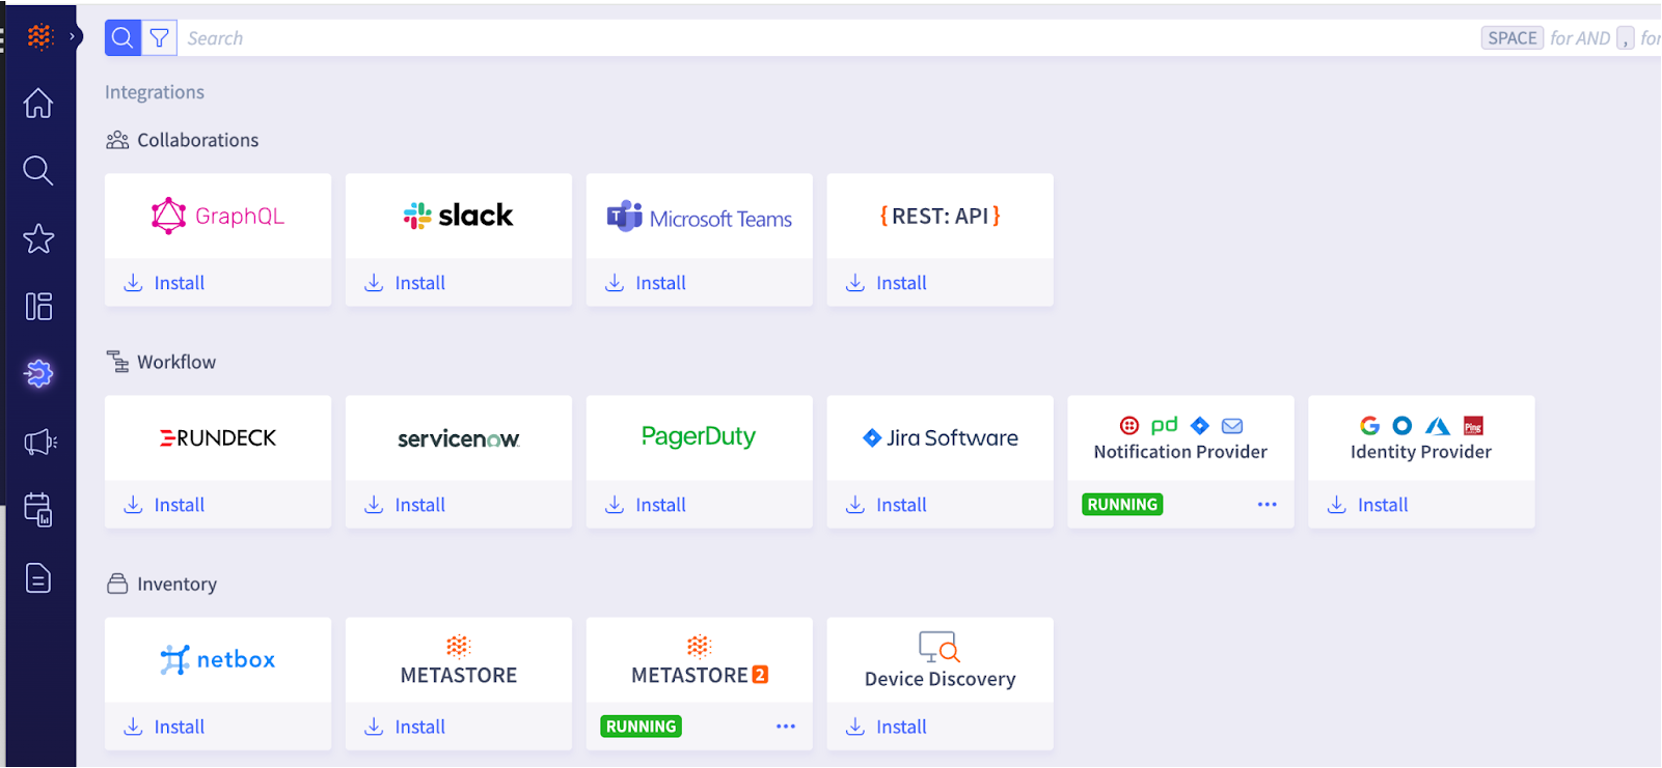
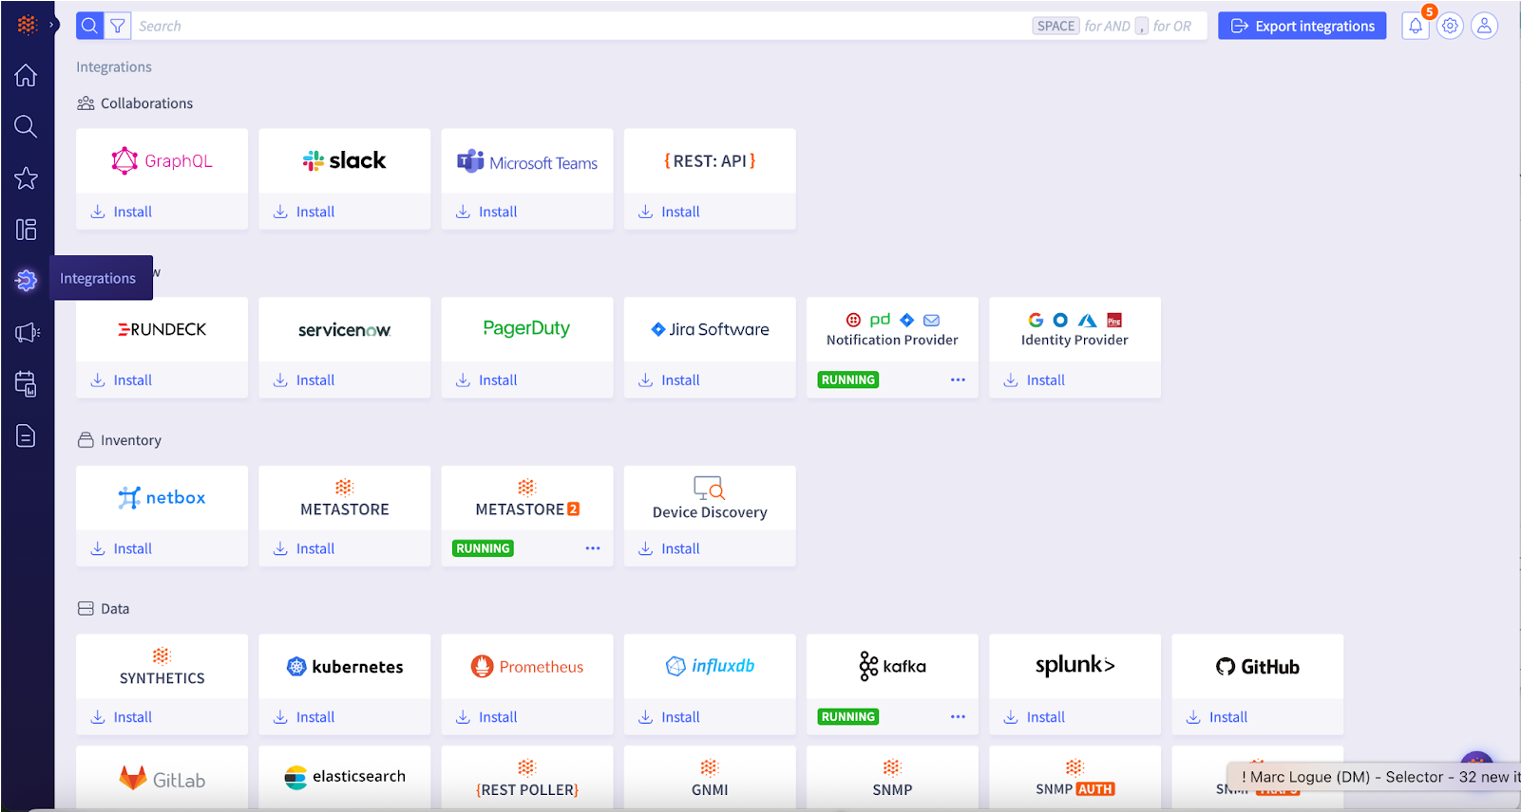
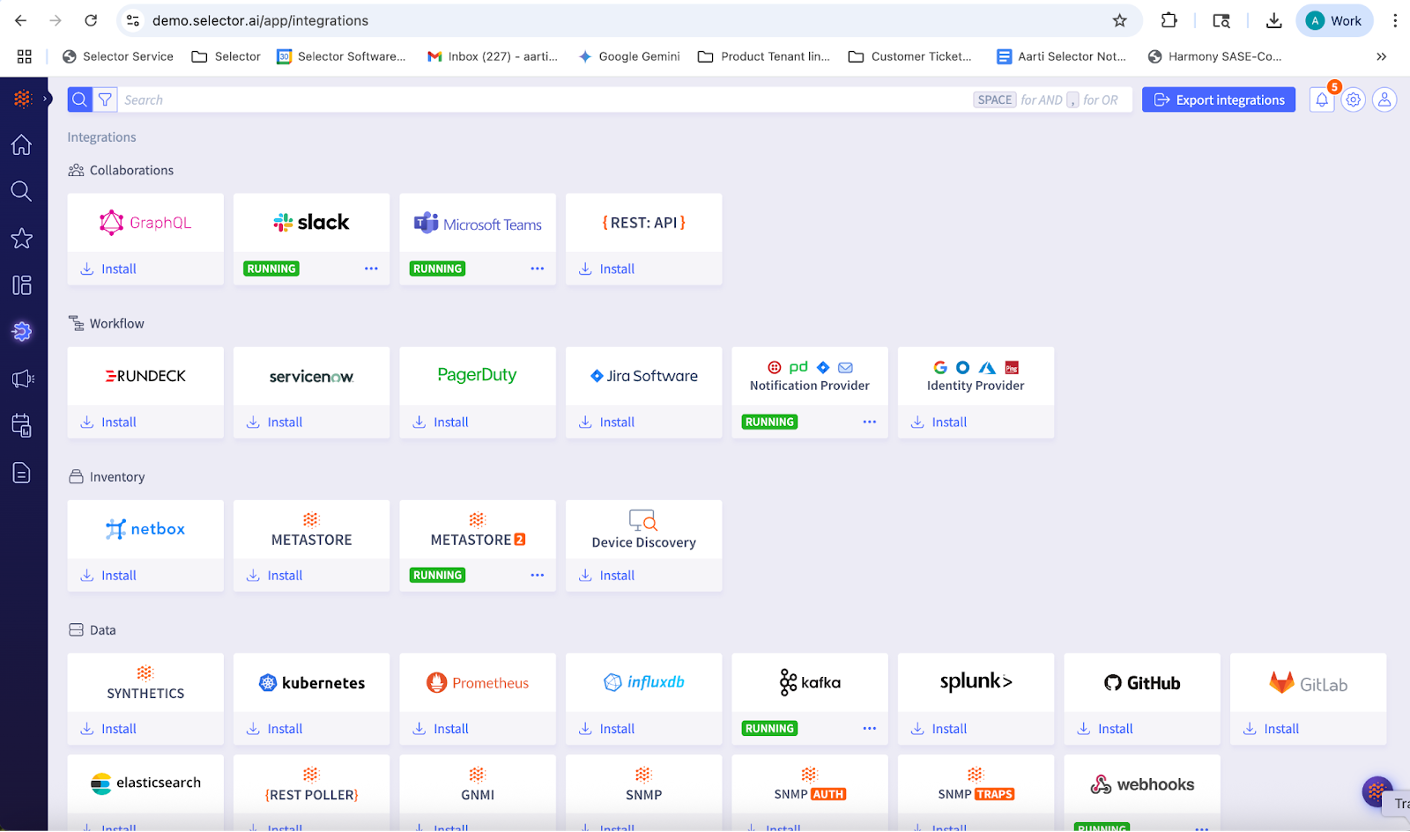
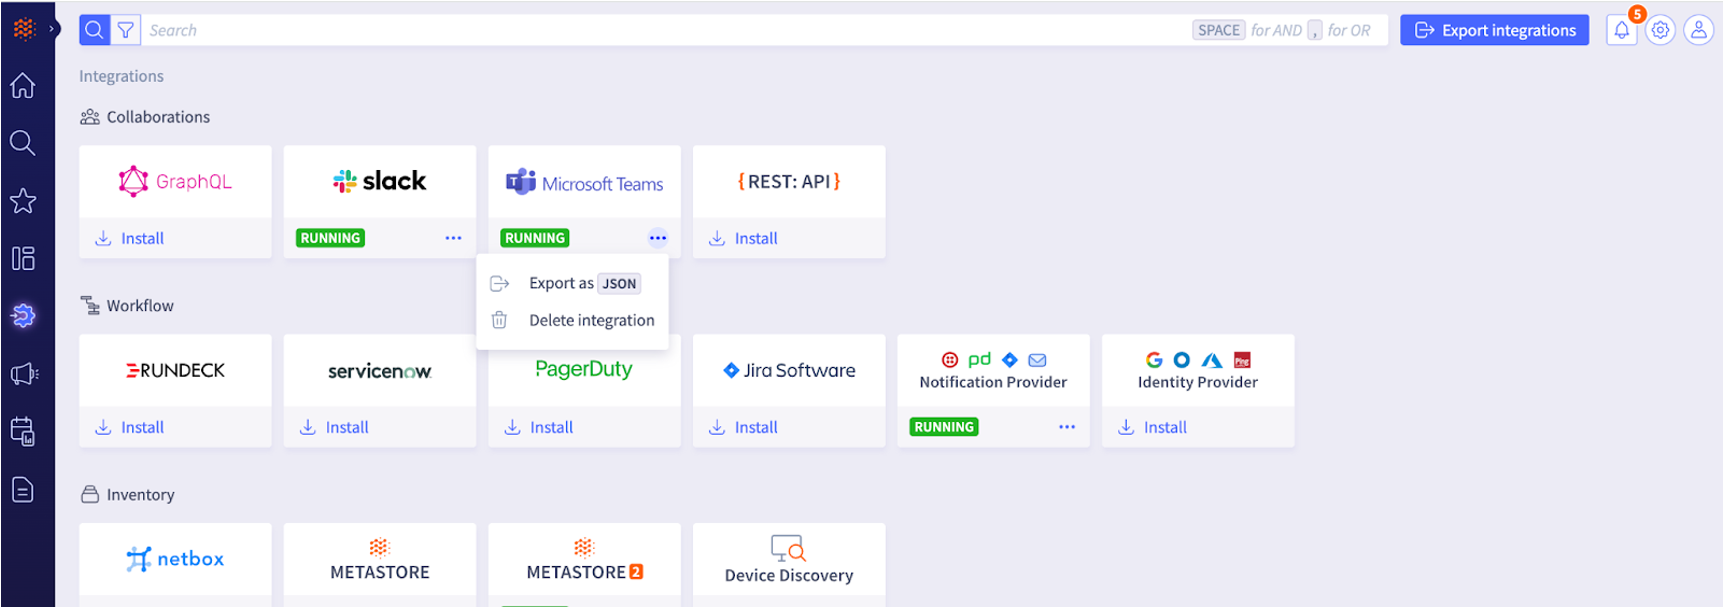
Step 3: Navigate to your Selector integrations page in your Selector S2AP UI to set up the Slack integration. Please ensure you have admin access to S2AP.
Example URL selector.ai/app/integrations.
Please ensure you use the correct URL corresponding to your S2AP instance.
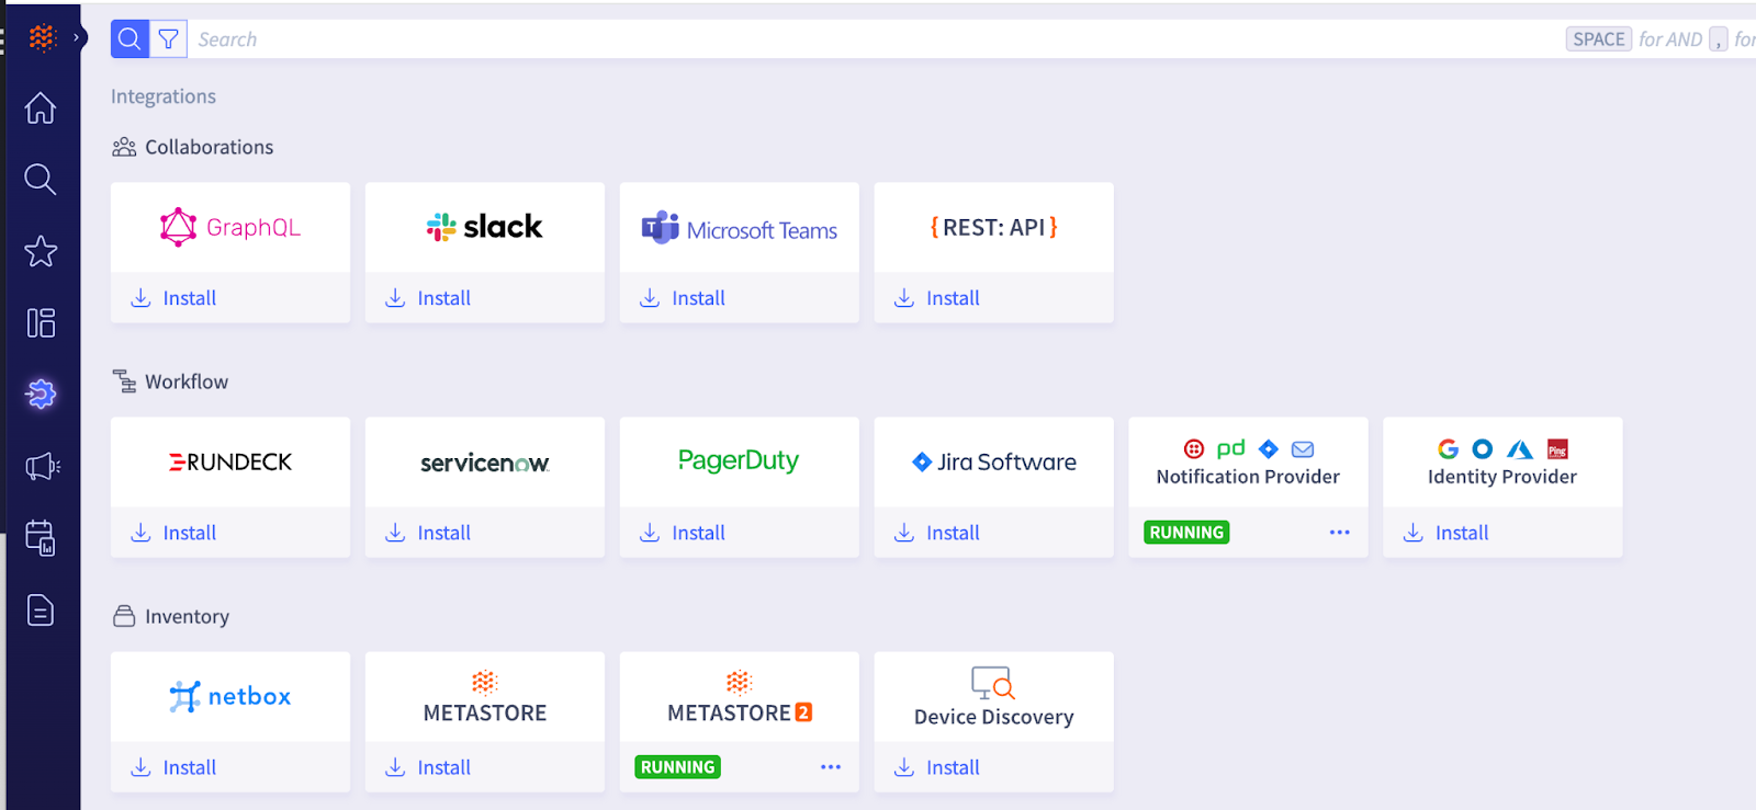
Step 4: Click on install under the Slack integration logo to enable the workflow to integrate with your given Slack workspace and a Slack channel in it.
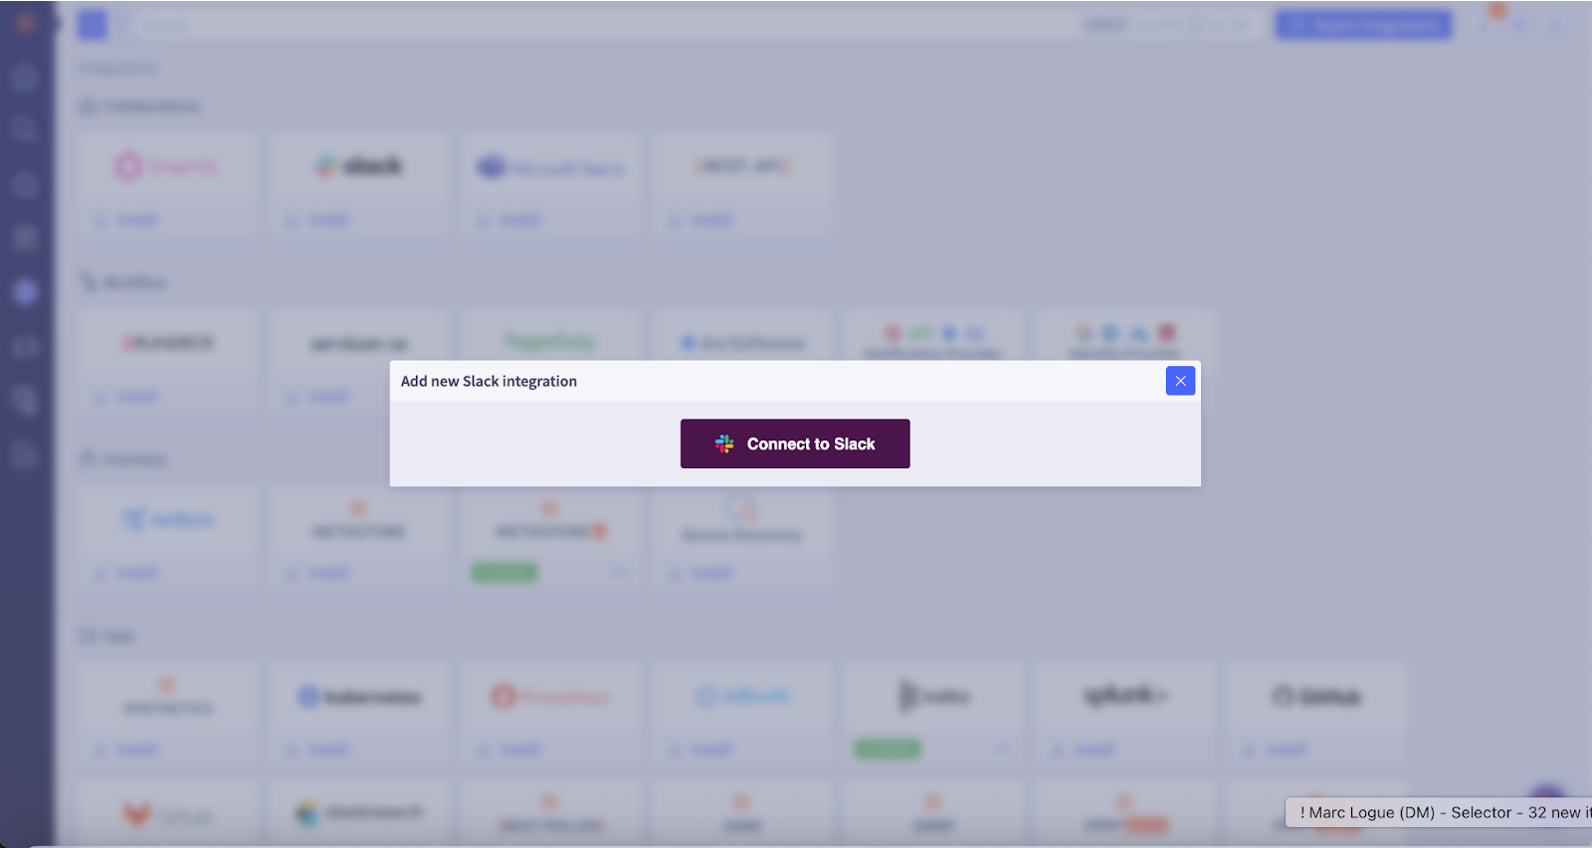
Step 5: Click on Connect to Slack in the S2AP UI.
Step 6: Select the channel name where you want to interact with the Selector AIOps BOT from the drop-down list (For example: test-demo-slack-channel). Then select Allow.
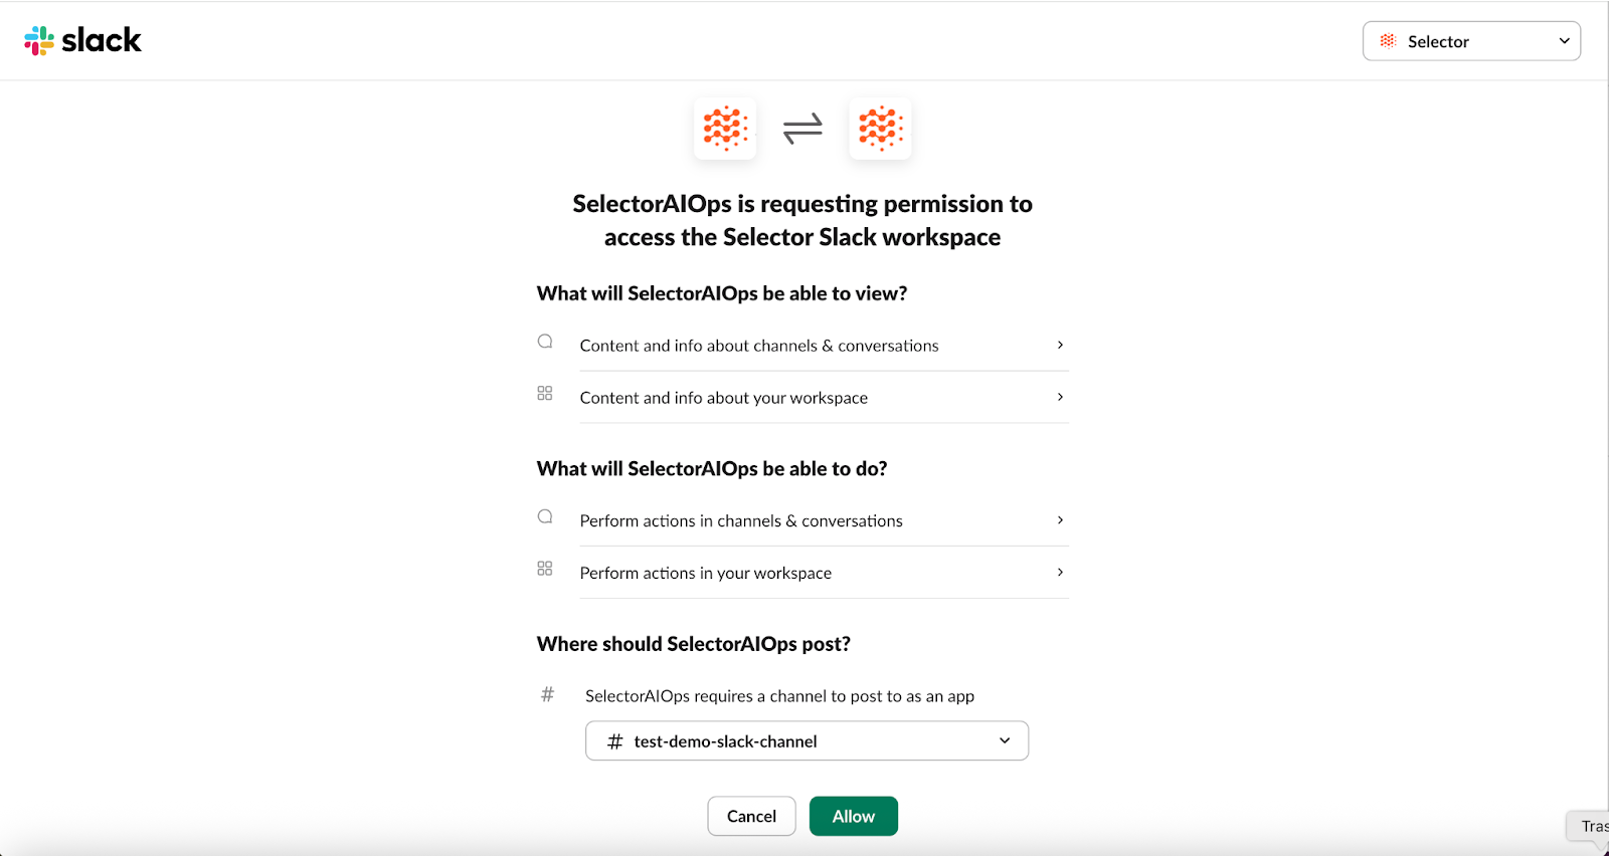
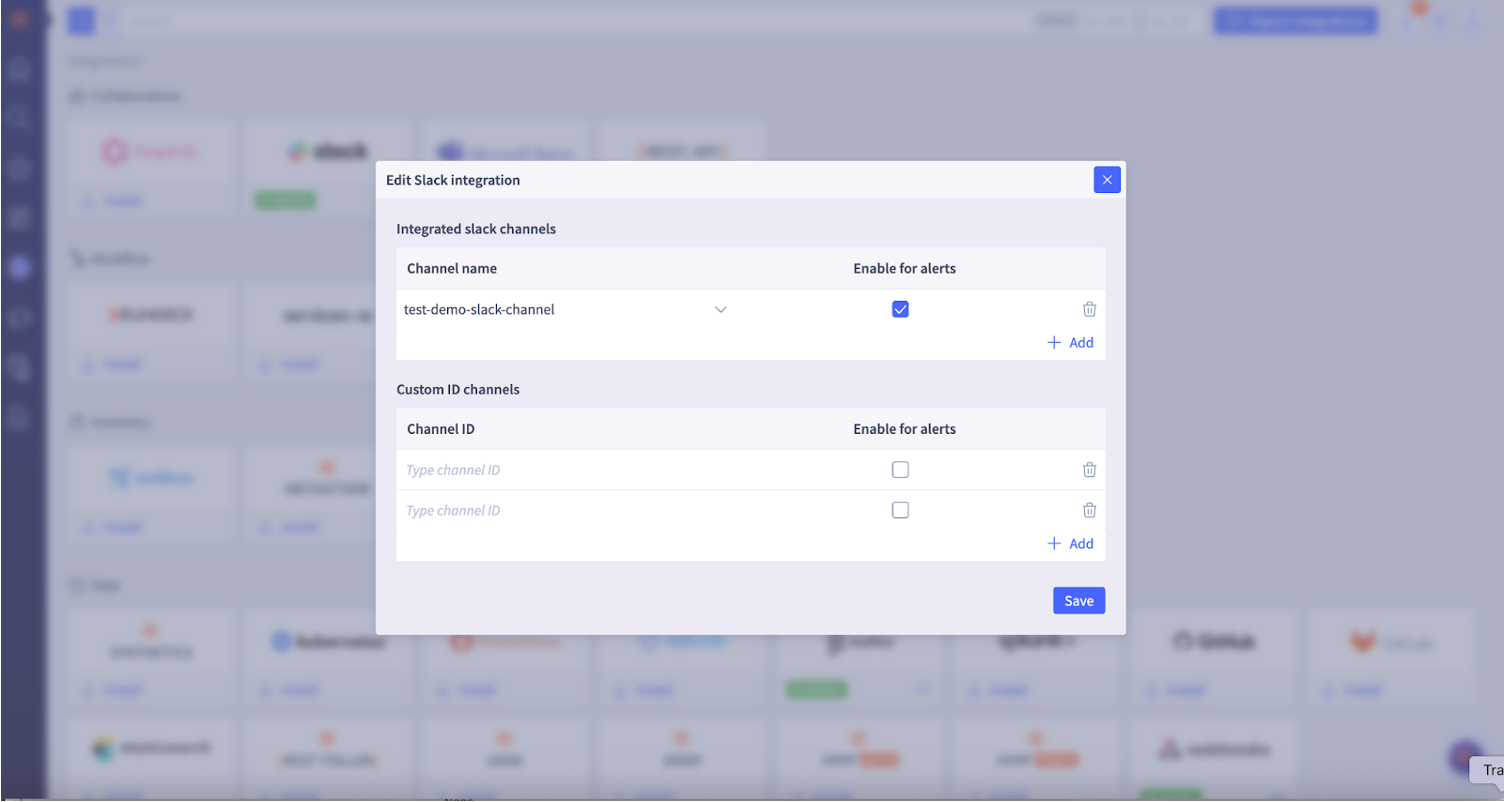
Step 7: A pop-up appears in the S2AP UI, along with the channels you can select to interact with the Selector AIOPs BOT. For example, in this case, the test-demo-slack channel.
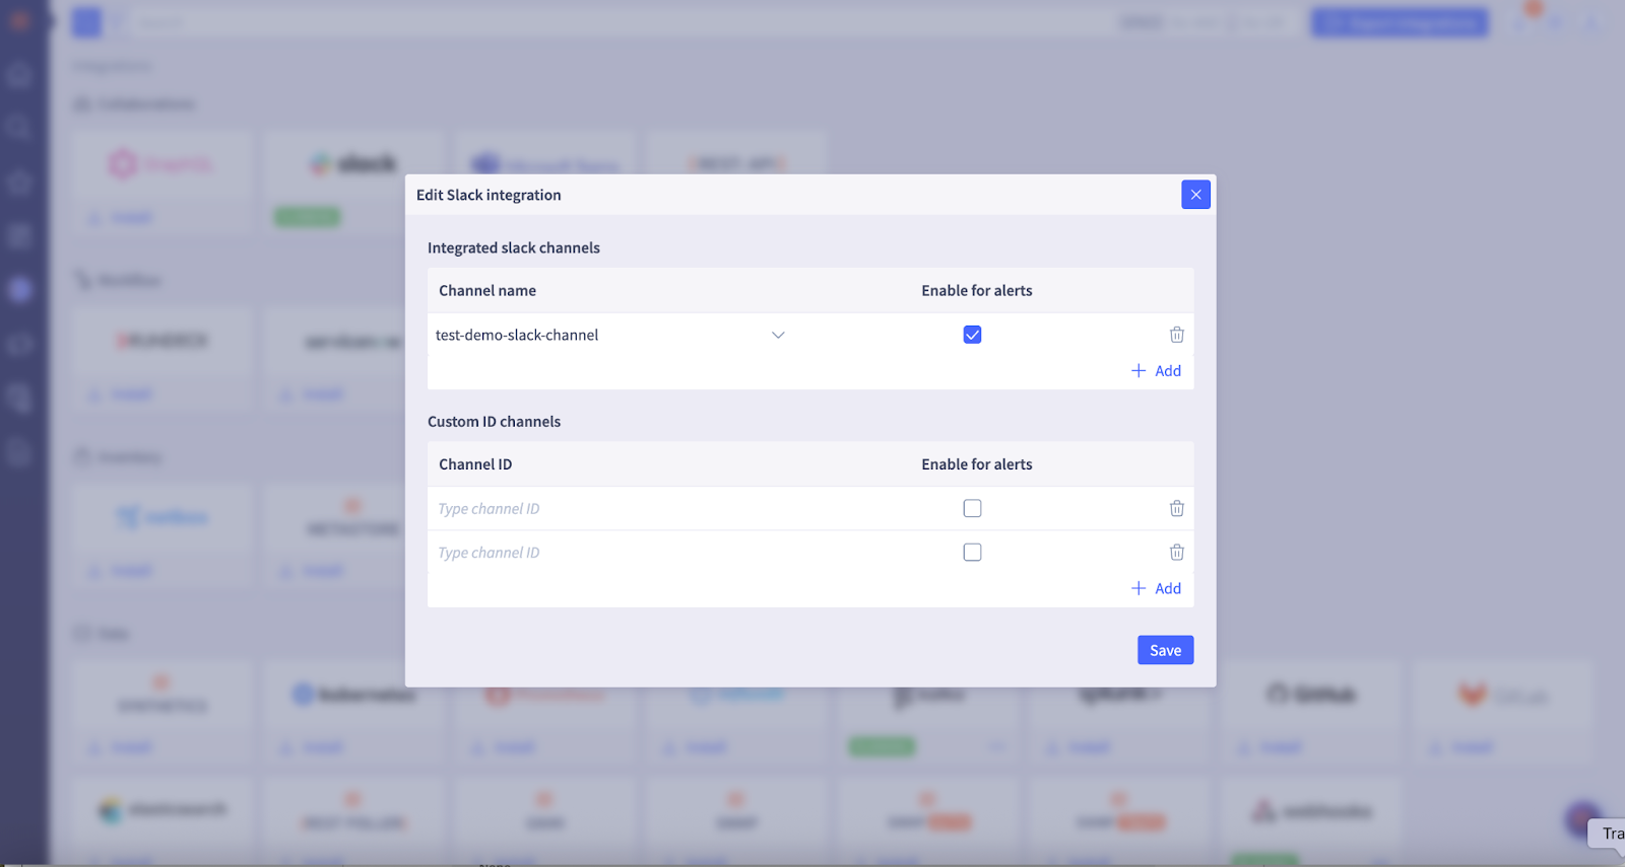
If you want to see the alerts in these channels, you can enable alerts in the check box.
You can also enable alerts at a later time if you choose. Also refer to Step 8.
If you want to interact with the Selector AIOps Bot in a custom ID Slack channel, find the channel ID and enter it in the pop-up window in the Custom Channel ID section.
How to find channel ID for a custom app:
Click on the Slack channel name for that custom app, then locate the ID.
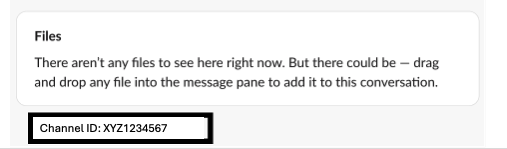
Click Save, and then the Slack integration should be up and running.
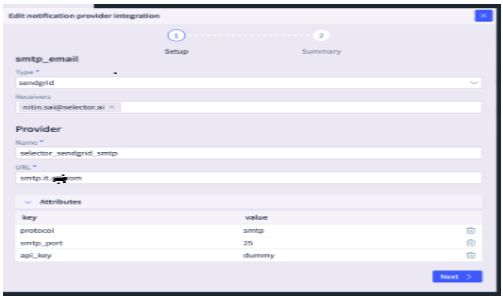
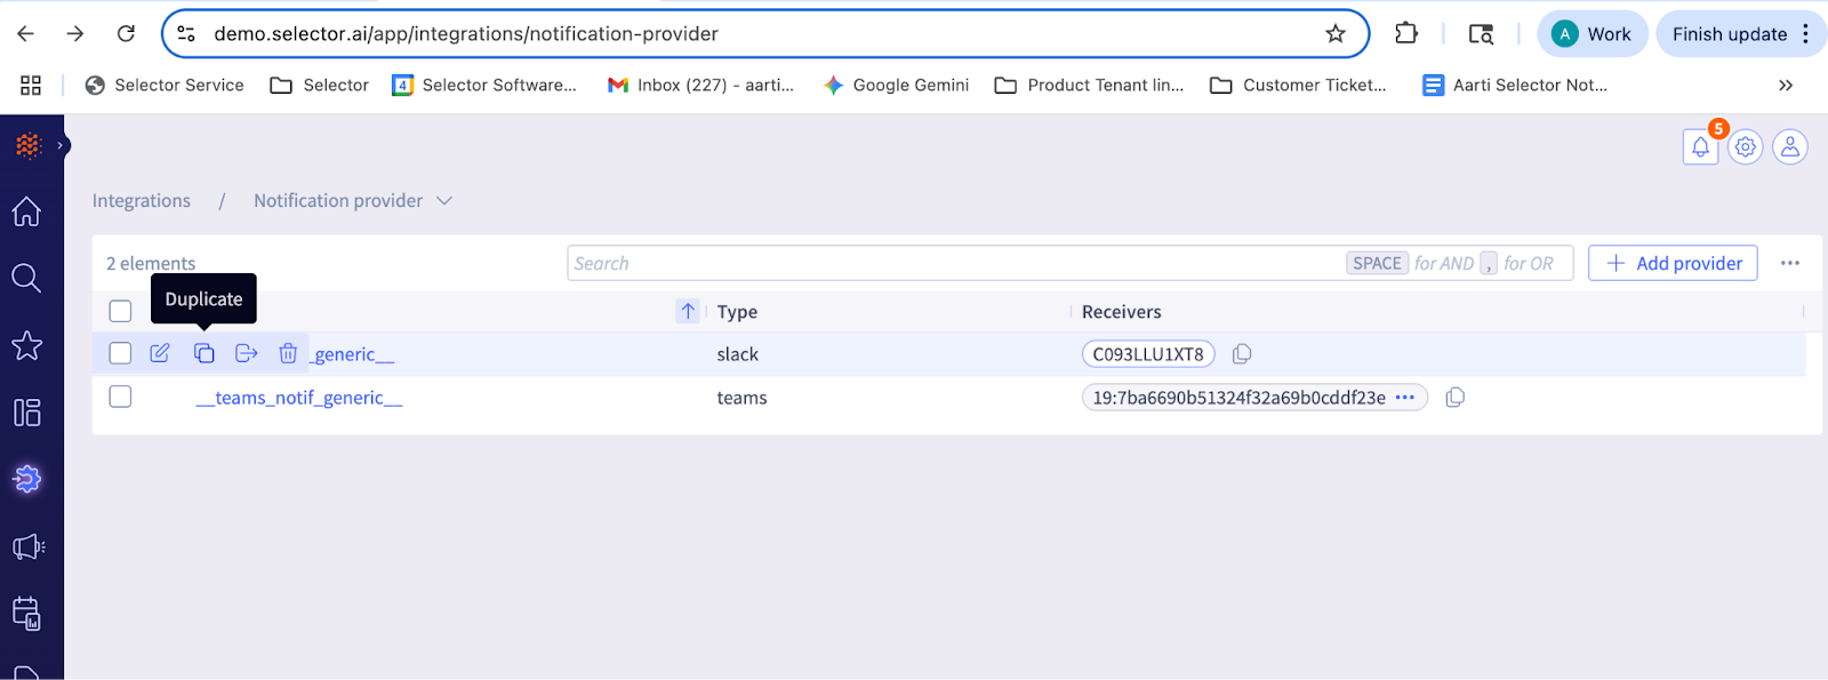
Step 8: If you want to send alerts to Slack channels, go to the Notification provider on the Integrations page, add a notification provider, and add the Slack Channel Ids that you want to get alerts. You also need to provide the correct slack_token attribute corresponding to your Slack account.
Note: you can also simply duplicate the auto-created __slack_notif_generic notification provider to copy all attributes and update it with the relevant channel ids.
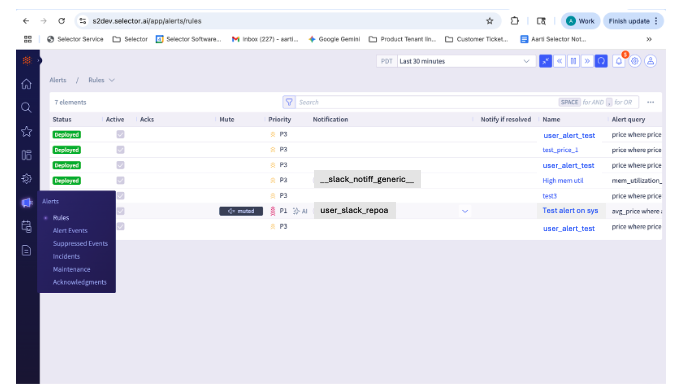
Then, associate the Notification Provider with the corresponding alert rule.
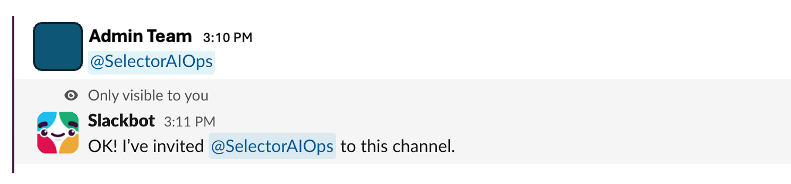
Step 9: Invite the SelectorAIOps BOT to the Slack channel in the correct Slack workspace, using app mention. Check the BOT response in the Slack channel.
Step 10: Execute the slash (/) command on the channel to check SelectorAIOps’ response in the Slack channel. See the Operations section for more details.
Step 11: At a later time, if you want to add additional channels from your Slack workspace to interact with the Selector AIOps app, come back to the Integrations page in the S2AP UI, click on Integrations, then click on the Slack tile to Add additional channels.
Step 12: To connect the SelectorAIOps BOT to a new Slack workspace, please delete the current integration by clicking on Delete Integration and repeat the above steps for a new Slack workspace.
Operations
Query service using Slack
You can use following actions with the SelectorAIOps query service:
- Get a report of metrics over a period of time
- Plot metrics as line graph, bar graph, stacked graph, honeycomb, event graph
This is a list of available “slash” (/) commands:
- /select [query]: Query Selector Analytics
- /select summon: Display a modal to summon a dashboard/widget in Slack
- /select summon [dashboard/widget name]* Summon a dashboard or widget to Slack
- /select help: Display help Options
Collaborate using Slack
- Users can share and collaborate with other team members in a slack channel
- Users can view alerts, issues in the slack channel
- Users can query S2AP using natural language queries and see the status of their network and devices in the slack channel
- Users can view topology, dashboard widgets in their slack channel.
Support
For support and questions, please contact us or send an email to support@selector.ai.
2.3 - MS Teams Integration
SelectorAIOps Microsoft Teams Integration
SelectorAIOps Microsoft Teams Integration
Selector Software enables customers to monitor, analyze, and share their digital infrastructure performance using Microsoft teams and SelectorAIOps. Selector AI’s analytics and collaboration engine hides the complexity of heterogeneous infrastructure and tools. Our turn-key solution sits on top of disparate information sources to provide visibility, monitoring, correlated real time insights, and alerting for hosts, devices, infrastructure, and network health and performance. We present these insights in a unique collaborative manner between people, machines, and applications acting in unison enabling teams to interact with the SelectorAIOps platform in the collaboration tool of their choice
SelectorAIOps provides actionable multi-dimensional insights to network, cloud, and application operators. It provides a query interface to monitor and analyze events and trends. Users can keep their team updated on performance, view alerts, and share dashboards in the specific Microsoft teams channels where their team collaborates. SelectorAIOps provides these insights by ingesting metrics from multiple data sources and doing analysis on historical metrics and real-time streaming metrics.
Configuration
Before beginning, make sure that you have added the Selector AIOps App to your Teams workspace.
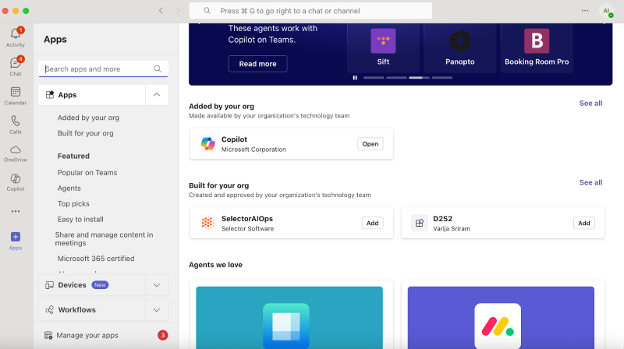
Step 1:Add the Selector AIOPs App to your Microsoft Teams
- Make sure you are signed into your Microsoft Teams account.
- Search for Selector AIOPs in Microsoft Teams Apps, and select Add. You can get this from your Teams app (as shown below), or from the web.
- Before doing this, please make sure you have the appropriate permissions to install apps in your Microsoft Teams account.
- Reach out to your Selector point of contact (Solution Engineer or Sales Engineer) if you have questions.
Step 2: In your Microsoft Teams app, create the Teams channel through which you want to interact with the Selector AIOPs BOT.
Step 3: Collect the Channel ID information for that channel as explained below.
- Note: Your Selector representative should be able to help you with any questions you have.
Paste the copied link in a browser window. Follow the instructions below to extract the Channel ID.
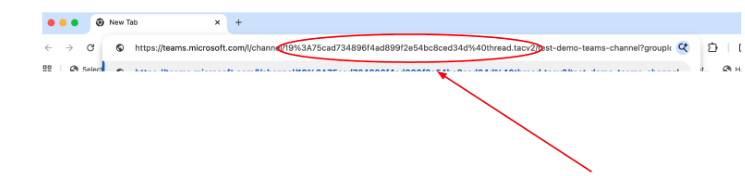
Extract the Channel ID, which is the portion after /channel/ ending with .tacv2 (see example above). In the example the extracted Channel id is: 19%3A85af72f0be4646dca7d3230886c6f88b%40thread
edit the channel ID as follows:
Remove “%3a” located at the beginning of the extracted Channel ID and replace it with a colon :
Remove “%40” located towards the end of the extracted Channel ID and replace it with “@” sign. From the example above, the edited channel ID now looks like this: 19:85af72f0be4646dca7d3230886c6f88b@thread.
Provide this edited channel ID to your Selector contact (Customer Success or Solutions Engineering representative), who will update some YAML files.
Step 4: Once the previous step is complete, navigate to the Selector integrations dashboard on the Selector S2AP UI to set up Teams integration. Please make sure you have admin access to S2AP.
An example URL is https://<customer-domain>.selector.ai/app/integrations.
Please make sure you use the correct URL corresponding to your S2AP instance.
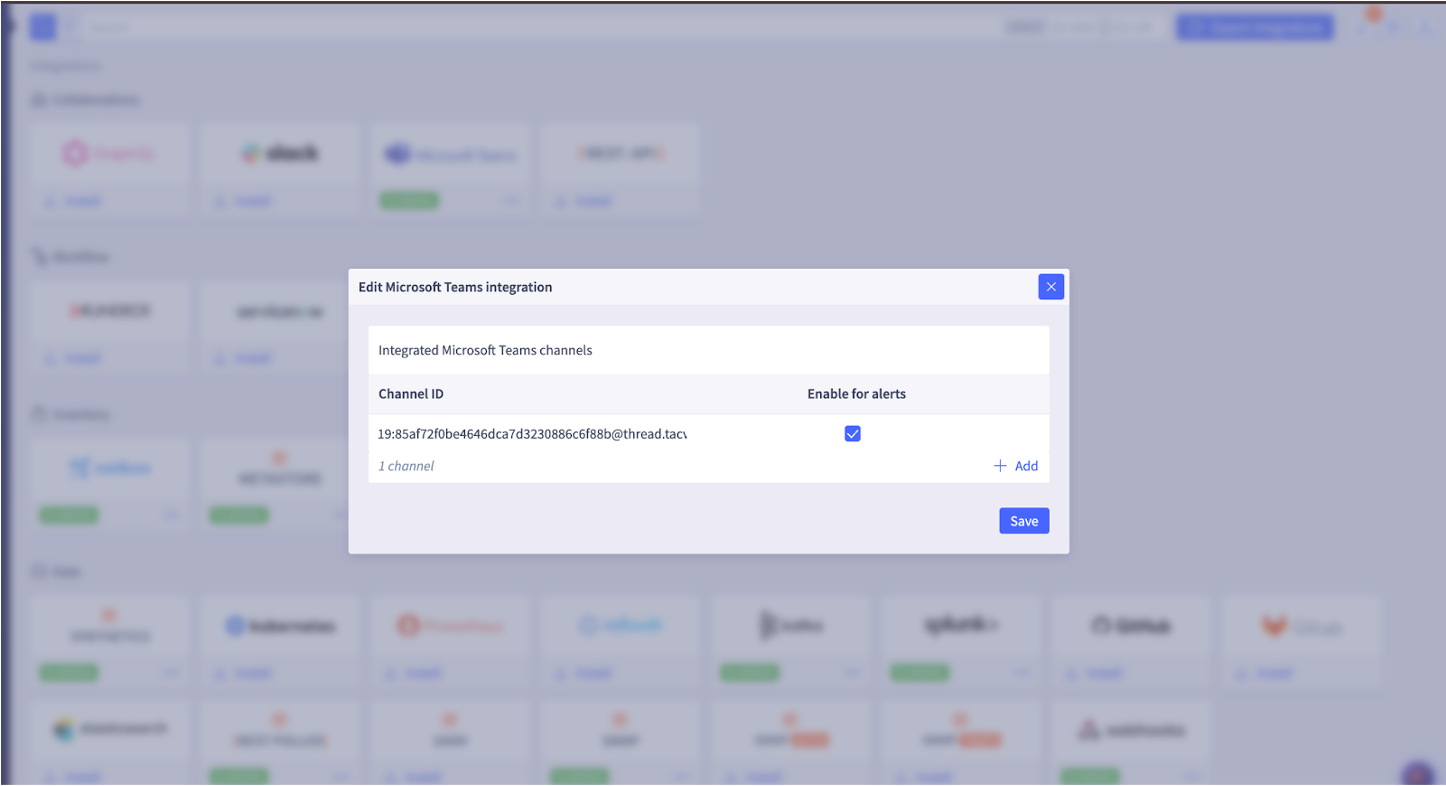
Step 5: Click on install under the Teams integration logo to enable the workflow to add the SelectorAIOps BOT to an MS Teams workspace and an MS Teams channel.
Step 6: In the pop-up window that appears, enter the edited channel ID from Step 3.
If you want to see the alerts in these channels, you should enable alerts in the check box.
You can enable alerts at a later time if you choose. Refer to Step 8 as well.
Click Save.
Step 7: The Microsoft Teams integration should be up and running.
Step 8: If you want to send alerts to Teams channels, go to the Notification provider on the Integrations page, Add a notification provider, and add the edited Teams Channel Id you want to get alerts in. You will need to also provide the correct teams_token and teams_password attributes corresponding to your Teams account.
Note: you can also simply duplicate the auto-created __teams_notif_generic to copy all attributes and update it with the relevant channel IDs.
Then you need to associate the Notification Provider with the corresponding alert rule.
Step 9: Interact with the Selector AIOps App (listed as SelectorAIOps) in your teams channel.
Step 10: Execute commands on the channel to check SelectorAIOps’s response in the Teams channel.
See the Operations section for details.
Step 11: To add additional channels from the same MS Teams workspace, navigate to the Selector teams integration dashboard and click on Add.
Step 12: To connect the SelectorAIOps BOT to a new Microsoft teams instance, please delete the current integration by clicking on Delete Integration and repeat the above steps for the new instance.
Operations
Query service using Microsoft teams
You can use following actions with the SelectorAIOps query service:
- Get a report of metrics over a period of time
- Plot metrics as line graph, bar graph, stacked graph, honeycomb, event graph
This is a list of available commands:
- @SelectorAIOps [query]: Query Selector Analytics
- @SelectorAIOps summon: Display a modal to summon a dashboard/widget in MS Teams
- @SelectorAIOps summon [dashboard/widget name]: Summon a dashboard or widget to Teams
- @SelectorAIOps help: Display help Options
Collaborate Using Microsoft Teams
- Users can share and collaborate with other team members in a teams channel
- Users can view alerts and issues in a teams channel
- Users can query S2AP using natural language queries and see the status of their network and devices in a teams channel
- Users can view topology and dashboard widgets in their teams channel
Support
For support and questions, please contact us or send an email to support@selector.ai
2.4 - SNMP MIB OID Description
Standard and Vendor-Specific SNMP MIB and OIDs
Selector Software SNMP Standard and Vendor-Specific MIB and OIDs
This document provides a list and description of various MIB OIDs Selector platform ingest to derive insights into the operations state of the network. This document covers Standards Based MIBs such as BGP-MIB and MIB-2 as well as various Vendor-Specific (“proprietary”) OIDs that various network vendors support. This document serves as a reference to all MIB OIDs supported by the Selector platform and will be updated periodically to keep it current.
It is critical to note that the Selector platform provides insights into the operational status of the network using these MIB OIDs as one of the data sources. After ingesting the MIB OID data, the Selector platform transforms the OIDs into a Selector Queryables, which is a representation of those MIB OIDs into a more human readable entity. This document also lists the corresponding Selector Queryable associated with those MIB OIDs. As a user of the Selector platform, you will be interacting with these Selector Queryables.
You might notice that some SNMP MIB OIDs do not have a directly corresponding Selector Queryable. This is not a documentation error. Those cases indicate that the Selector platform uses ingested MIB OIDs as one of the data sources to derive other operational insights.
Organization
The Document is structured as follows:
- Standard OIDs
- Vendor-Specific OIDs
Each of these categories contains a MIB Module. Under each MIB Module, there are Table Names.
Each table consists of three columns:
- OID Name - OID: Displays the OID name along with its numerical identifier
- Selector Queryable: Name used for querying the OID in our systems (whenever applicable)
- Description: A detailed explanation of what the OID represents and its functionality.
Table of Contents for Standard OIDs
BGP-4 MIB
ENTITY-SENSOR-MIB
ENTITY-MIB
HOST-RESOURCES-MIB
IF-MIB
LLDP-MIB
OSPF-MIB
SNMPv2 MIB
List of Supported Vendors
- Cisco
- Extreme
- F5
- Fortinet
- Infoblox
- Juniper
- Palo Alto
- Synoptics (S5)
List of Supported Vendor MIBs
Back to Vendor TOC
Back to Vendor TOC
Back to Vendor TOC
Back to Vendor TOC
Back to Vendor TOC
Back to Vendor TOC
Back to Vendor TOC
Back to Vendor TOC
Standard MIB OIDs
BGP4-MIB
bgpPeerTable
| OID Name | Selector Queryable | Description |
|---|
| bgpPeerAdminStatus- 1.3.6.1.2.1.15.3.1.3 | bgp_peer_admin_status_raw | The desired state of the BGP connection.� A transition from ‘stop’ to ‘start’ will cause� the BGP Manual Start Event to be generated.� A transition from ‘start’ to ‘stop’ will cause� the BGP Manual Stop Event to be generated.� This parameter can be used to restart BGP peer� connections. Care should be used in providing� write access to this object without adequate� authentication. |
| bgpPeerConnectRetryInterval-1.3.6.1.2.1.15.3.1.17 | | Time interval (in seconds) for the� ConnectRetry timer. The suggested value� for this timer is 120 seconds. |
| bgpPeerFsmEstablishedTime-1.3.6.1.2.1.15.3.1.16 | bgp_peer_fsm_established_time_raw | This timer indicates how long (in� seconds) this peer has been in the� established state or how long� since this peer was last in the� established state. It is set to zero when� a new peer is configured or when the router is� � booted. |
| bgpPeerFsmEstablishedTransitions- 1.3.6.1.2.1.15.3.1.15 | | The total number of times the BGP FSM� transitioned into the established state� for this peer. |
| bgpPeerHoldTime- 1.3.6.1.2.1.15.3.1.18 | | Time interval (in seconds) for the Hold� Timer established with the peer. The� value of this object is calculated by this� BGP speaker, using the smaller of the� values in bgpPeerHoldTimeConfigured and the� Hold Time received in the OPEN message.� � This value must be at least three seconds� if it is not zero (0).� � If the Hold Timer has not been established� with the peer this object MUST have a value� of zero (0).� � If the bgpPeerHoldTimeConfigured object has� a value of (0), then this object MUST have a� value of (0). |
| bgpPeerHoldTimeConfigured-1.3.6.1.2.1.15.3.1.20 | | Time interval (in seconds) for the Hold Time� configured for this BGP speaker with this� peer. This value is placed in an OPEN� message sent to this peer by this BGP� speaker, and is compared with the Hold� Time field in an OPEN message received� from the peer when determining the Hold� Time (bgpPeerHoldTime) with the peer.� This value must not be less than three� seconds if it is not zero (0). If it is� zero (0), the Hold Time is NOT to be� established with the peer. The suggested� value for this timer is 90 seconds. |
| bgpPeerInTotalMessages- 1.3.6.1.2.1.15.3.1.12 | | The total number of messages received� from the remote peer on this connection. |
| bgpPeerInUpdateElapsedTime- 1.3.6.1.2.1.15.3.1.24 | | Elapsed time (in seconds) since the last BGP� UPDATE message was received from the peer.� Each time bgpPeerInUpdates is incremented,� the value of this object is set to zero (0). |
| bgpPeerInUpdates- 1.3.6.1.2.1.15.3.1.10 | bgp_peer_in_updates_raw | The number of BGP UPDATE messages� received on this connection. |
| bgpPeerKeepAlive- 1.3.6.1.2.1.15.3.1.19 | | Time interval (in seconds) for the KeepAlive� timer established with the peer. The value� of this object is calculated by this BGP� speaker such that, when compared with� bgpPeerHoldTime, it has the same proportion� that bgpPeerKeepAliveConfigured has,� compared with bgpPeerHoldTimeConfigured.� � If the KeepAlive timer has not been established� with the peer, this object MUST have a value� of zero (0).� � If the of bgpPeerKeepAliveConfigured object� has a value of (0), then this object MUST have� a value of (0). |
| bgpPeerKeepAliveConfigured- 1.3.6.1.2.1.15.3.1.21 | | Time interval (in seconds) for the� KeepAlive timer configured for this BGP� speaker with this peer. The value of this� object will only determine the� KEEPALIVE messages’ frequency relative to� the value specified in� bgpPeerHoldTimeConfigured; the actual� time interval for the KEEPALIVE messages is� indicated by bgpPeerKeepAlive. A� reasonable maximum value for this timer� would be one third of that of� bgpPeerHoldTimeConfigured.� If the value of this object is zero (0),� no periodical KEEPALIVE messages are sent� to the peer after the BGP connection has� been established. The suggested value for� this timer is 30 seconds. |
| bgpPeerLastError- 1.3.6.1.2.1.15.3.1.14 | | The last error code and subcode seen by this� peer on this connection. If no error has� occurred, this field is zero. Otherwise, the� first byte of this two byte OCTET STRING� contains the error code, and the second byte� contains the subcode. |
| bgpPeerLocalAddr- 1.3.6.1.2.1.15.3.1.5 | | The local IP address of this entry’s BGP� connection. |
| bgpPeerMinASOriginationInterval- 1.3.6.1.2.1.15.3.1.22 | | Time interval (in seconds) for the� MinASOriginationInterval timer.� The suggested value for this timer is 15� seconds. |
| bgpPeerMinRouteAdvertisementInterval- 1.3.6.1.2.1.15.3.1.23 | | Time interval (in seconds) for the� MinRouteAdvertisementInterval timer.� The suggested value for this timer is 30� seconds for EBGP connections and 5� seconds for IBGP connections. |
| bgpPeerOutTotalMessages- 1.3.6.1.2.1.15.3.1.13 | | The total number of messages transmitted to� the remote peer on this connection. |
| bgpPeerOutUpdates- 1.3.6.1.2.1.15.3.1.11 | bgp_peer_out_updates_raw | The number of BGP UPDATE messages� transmitted on this connection. |
| bgpPeerRemoteAddr- 1.3.6.1.2.1.15.3.1.7 | | The remote IP address of this entry’s BGP� peer. |
| bgpPeerRemoteAs- 1.3.6.1.2.1.15.3.1.9 | | The remote autonomous system number received in� the BGP OPEN message. |
| bgpPeerState- 1.3.6.1.2.1.15.3.1.2 | bgp_peer_state_raw | The BGP peer connection state. |
BACK to TOC
ENTITY-SENSOR-MIB
entPhySensorTable
| OID Name | Selector Queryable | Description |
|---|
| entPhySensorOperStatus- 1.3.6.1.2.1.99.1.1.1.5 | fru_power_oper_status | The operational status of the sensor. |
| entPhySensorScale- 1.3.6.1.2.1.99.1.1.1.2 | | The exponent to apply to values returned by the associated� entPhySensorValue object.� � This object SHOULD be set by the agent during entry� creation, and the value SHOULD NOT change during operation. |
| entPhySensorType- 1.3.6.1.2.1.99.1.1.1.1 | | The type of data returned by the associated� entPhySensorValue object.� � This object SHOULD be set by the agent during entry� creation, and the value SHOULD NOT change during operation. |
| entPhySensorValue- 1.3.6.1.2.1.99.1.1.1.4 | netflow_conversation_bytes | The most recent measurement obtained by the agent for this� sensor.� � To correctly interpret the value of this object, the� associated entPhySensorType, entPhySensorScale, and� entPhySensorPrecision objects must also be examined. |
BACK to TOC
ENTITY-MIB
entPhysicalTable
| OID Name | Selector Queryable | Description |
|---|
| entPhysicalDescr- 1.3.6.1.2.1.47.1.1.1.1.2 | | A textual description of physical entity. This object� should contain a string that identifies the manufacturer’s� name for the physical entity and should be set to a� distinct value for each version or model of the physical� entity. |
| entPhysicalIndex- 1.3.6.1.2.1.47.1.1.1.1.1 | | The index for this entry. |
| entPhysicalMfgName- 1.3.6.1.2.1.47.1.1.1.1.12 | | The name of the manufacturer of this physical component.� The preferred value is the manufacturer name string actually� printed on the component itself (if present).� � Note that comparisons between instances of the� entPhysicalModelName, entPhysicalFirmwareRev,� entPhysicalSoftwareRev, and the entPhysicalSerialNum� objects are only meaningful amongst entPhysicalEntries with� the same value of entPhysicalMfgName.� � If the manufacturer name string associated with the physical� component is unknown to the agent, then this object will� contain a zero-length string. |
| entPhysicalModelName- 1.3.6.1.2.1.47.1.1.1.1.13 | | The vendor-specific model name identifier string associated� with this physical component. The preferred value is the� customer-visible part number, which may be printed on the� component itself.� � If the model name string associated with the physical� component is unknown to the agent, then this object will� contain a zero-length string. |
| entPhysicalName- 1.3.6.1.2.1.47.1.1.1.1.7 | | The textual name of the physical entity. The value of this� object should be the name of the component as assigned by� the local device and should be suitable for use in commands� entered at the device’s ‘console’. This might be a text� name (e.g., ‘console’) or a simple component number (e.g.,� port or module number, such as ‘1’), depending on the� physical component naming syntax of the device.� � If there is no local name, or if this object is otherwise� not applicable, then this object contains a zero-length� string.� � Note that the value of entPhysicalName for two physical� entities will be the same in the event that the console� interface does not distinguish between them, e.g., slot-1� and the card in slot-1. |
| entPhysicalSerialNum- 1.3.6.1.2.1.47.1.1.1.1.11 | | The vendor-specific serial number string for the physical� entity. The preferred value is the serial number string� actually printed on the component itself (if present).� � On the first instantiation of a physical entity, the value� of entPhysicalSerialNum associated with that entity is set� to the correct vendor-assigned serial number, if this� information is available to the agent. If a serial number� is unknown or non-existent, the entPhysicalSerialNum will be� set to a zero-length string instead.� � Note that implementations that can correctly identify the� serial numbers of all installed physical entities do not� need to provide write access to the entPhysicalSerialNum� object. Agents that cannot provide non-volatile storage� for the entPhysicalSerialNum strings are not required to� implement write access for this object.� � Not every physical component will have a serial number, or� even need one. Physical entities for which the associated� value of the entPhysicalIsFRU object is equal to ‘false(2)’� (e.g., the repeater ports within a repeater module) do not� need their own unique serial numbers. An agent does not� have to provide write access for such entities and may� return a zero-length string.� � If write access is implemented for an instance of� entPhysicalSerialNum and a value is written into the� instance, the agent must retain the supplied value in the� entPhysicalSerialNum instance (associated with the same� physical entity) for as long as that entity remains� instantiated. This includes instantiations across all� re-initializations/reboots of the network management system,� including those resulting in a change of the physical� entity’s entPhysicalIndex value. |
BACK to TOC
HOST-RESOURCES-MIB
hrDeviceTable
| OID Name | Selector Queryable | Description |
|---|
| hrDeviceDescr- 1.3.6.1.2.1.25.3.2.1.3 | | A textual description of this device, including the� device’s manufacturer and revision, and optionally,� its serial number. |
| hrDeviceType- 1.3.6.1.2.1.25.3.2.1.2 | | An indication of the type of device.� � If this value is� `hrDeviceProcessor { hrDeviceTypes 3 }’ then an entry� exists in the hrProcessorTable which corresponds to� this device.� � If this value is� `hrDeviceNetwork { hrDeviceTypes 4 }’, then an entry� exists in the hrNetworkTable which corresponds to this� device.� � If this value is� `hrDevicePrinter { hrDeviceTypes 5 }’, then an entry� exists in the hrPrinterTable which corresponds to this� device.� � If this value is� `hrDeviceDiskStorage { hrDeviceTypes 6 }’, then an� entry exists in the hrDiskStorageTable which� corresponds to this device. |
| hrProcessorLoad- 1.3.6.1.2.1.25.3.3.1.2 | cpu_usage, cpu_util_raw | The average, over the last minute, of the percentage� of time that this processor was not idle.� Implementations may approximate this one minute� smoothing period if necessary. |
BACK to TOC
hrStorageTable
| OID Name | Selector Queryable | Description |
|---|
| hrStorageDescr- 1.3.6.1.2.1.25.2.3.1.3 | | A description of the type and instance of the storage� described by this entry. |
| hrStorageIndex- 1.3.6.1.2.1.25.2.3.1.1 | | A unique value for each logical storage area� contained by the host. |
| hrStorageSize- 1.3.6.1.2.1.25.2.3.1.5 | memory_size | The size of the storage represented by this entry, in� units of hrStorageAllocationUnits. This object is� writable to allow remote configuration of the size of� the storage area in those cases where such an� operation makes sense and is possible on the� underlying system. For example, the amount of main� memory allocated to a buffer pool might be modified or� the amount of disk space allocated to virtual memory� might be modified. |
| hrStorageType- 1.3.6.1.2.1.25.2.3.1.2 | | The type of storage represented by this entry. |
| hrStorageUsed- 1.3.6.1.2.1.25.2.3.1.6 | memory_used | The amount of the storage represented by this entry� that is allocated, in units of� hrStorageAllocationUnits. |
BACK to TOC
IF-MIB
ifXTable
| OID Name | Selector Queryable | Description |
|---|
| ifAdminStatus- 1.3.6.1.2.1.2.2.1.7 | if_admin_status | The desired state of the interface. The testing(3) state� indicates that no operational packets can be passed. When a� managed system initializes, all interfaces start with� ifAdminStatus in the down(2) state. As a result of either� explicit management action or per configuration information� retained by the managed system, ifAdminStatus is then� changed to either the up(1) or testing(3) states (or remains� in the down(2) state). |
| ifAlias- 1.3.6.1.2.1.31.1.1.1.18 | | This object is an ‘alias’ name for the interface as� specified by a network manager, and provides a non-volatile� ‘handle’ for the interface.� � On the first instantiation of an interface, the value of� ifAlias associated with that interface is the zero-length� string. As and when a value is written into an instance of� ifAlias through a network management set operation, then the� agent must retain the supplied value in the ifAlias instance� associated with the same interface for as long as that� interface remains instantiated, including across all re-� initializations/reboots of the network management system,� including those which result in a change of the interface’s� ifIndex value.� � An example of the value which a network manager might store� in this object for a WAN interface is the (Telco’s) circuit� number/identifier of the interface.� � Some agents may support write-access only for interfaces� having particular values of ifType. An agent which supports� write access to this object is required to keep the value in� non-volatile storage, but it may limit the length of new� values depending on how much storage is already occupied by� the current values for other interfaces. |
| ifDescr- 1.3.6.1.2.1.2.2.1.2 | | A textual string containing information about the� interface. This string should include the name of the� manufacturer, the product name and the version of the� interface hardware/software. |
| ifHCInOctets- 1.3.6.1.2.1.31.1.1.1.6 | if_in_octets | The total number of octets received on the interface,� including framing characters. This object is a 64-bit� version of ifInOctets.� � Discontinuities in the value of this counter can occur at� re-initialization of the management system, and at other� times as indicated by the value of� ifCounterDiscontinuityTime. |
| ifHCOutOctets- 1.3.6.1.2.1.31.1.1.1.10 | if_out_octets | The total number of octets transmitted out of the� interface, including framing characters. This object is a� 64-bit version of ifOutOctets.� � Discontinuities in the value of this counter can occur at� re-initialization of the management system, and at other� times as indicated by the value of� ifCounterDiscontinuityTime. |
| ifHighSpeed- 1.3.6.1.2.1.31.1.1.1.15 | if_speed | An estimate of the interface’s current bandwidth in units� of 1,000,000 bits per second. If this object reports a� value of `n’ then the speed of the interface is somewhere in� the range of `n-500,000’ to `n+499,999’. For interfaces� which do not vary in bandwidth or for those where no� accurate estimation can be made, this object should contain� the nominal bandwidth. For a sub-layer which has no concept� of bandwidth, this object should be zero. |
| ifInBroadcastPkts- 1.3.6.1.2.1.31.1.1.1.3 | | The number of packets, delivered by this sub-layer to a� higher (sub-)layer, which were addressed to a broadcast� address at this sub-layer.� � Discontinuities in the value of this counter can occur at� re-initialization of the management system, and at other� times as indicated by the value of� ifCounterDiscontinuityTime. |
| ifInDiscards- 1.3.6.1.2.1.2.2.1.13 | if_in_discards | The number of inbound packets which were chosen to be� discarded even though no errors had been detected to prevent� � their being deliverable to a higher-layer protocol. One� possible reason for discarding such a packet could be to� free up buffer space.� � Discontinuities in the value of this counter can occur at� re-initialization of the management system, and at other� times as indicated by the value of� ifCounterDiscontinuityTime. |
| ifInErrors- 1.3.6.1.2.1.2.2.1.14 | if_in_errors | For packet-oriented interfaces, the number of inbound� packets that contained errors preventing them from being� deliverable to a higher-layer protocol. For character-� oriented or fixed-length interfaces, the number of inbound� transmission units that contained errors preventing them� from being deliverable to a higher-layer protocol.� � Discontinuities in the value of this counter can occur at� re-initialization of the management system, and at other� times as indicated by the value of� ifCounterDiscontinuityTime. |
| ifInUnknownProtos- 1.3.6.1.2.1.2.2.1.15 | if_in_unknown_protos | For packet-oriented interfaces, the number of packets� received via the interface which were discarded because of� an unknown or unsupported protocol. For character-oriented� or fixed-length interfaces that support protocol� multiplexing the number of transmission units received via� the interface which were discarded because of an unknown or� unsupported protocol. For any interface that does not� support protocol multiplexing, this counter will always be� 0.� � Discontinuities in the value of this counter can occur at� re-initialization of the management system, and at other� times as indicated by the value of� ifCounterDiscontinuityTime. |
| ifIndex- 1.3.6.1.2.1.2.2.1.1 | | A unique value, greater than zero, for each interface. It� is recommended that values are assigned contiguously� starting from 1. The value for each interface sub-layer� must remain constant at least from one re-initialization of� the entity’s network management system to the next re-� initialization. |
| ifLastChange- 1.3.6.1.2.1.2.2.1.9 | if_lastchange | The value of sysUpTime at the time the interface entered� its current operational state. If the current state was� entered prior to the last re-initialization of the local� network management subsystem, then this object contains a� zero value. |
| ifName- 1.3.6.1.2.1.31.1.1.1.1 | | The textual name of the interface. The value of this� object should be the name of the interface as assigned by� the local device and should be suitable for use in commands� entered at the device’s `console’. This might be a text� name, such as `le0’ or a simple port number, such as `1’,� depending on the interface naming syntax of the device. If� several entries in the ifTable together represent a single� interface as named by the device, then each will have the� same value of ifName. Note that for an agent which responds� to SNMP queries concerning an interface on some other� (proxied) device, then the value of ifName for such an� interface is the proxied device’s local name for it.� � If there is no local name, or this object is otherwise not� applicable, then this object contains a zero-length string. |
| ifOperStatus- 1.3.6.1.2.1.2.2.1.8 | if_oper_status | The current operational state of the interface. The� testing(3) state indicates that no operational packets can� be passed. If ifAdminStatus is down(2) then ifOperStatus� should be down(2). If ifAdminStatus is changed to up(1)� then ifOperStatus should change to up(1) if the interface is� ready to transmit and receive network traffic; it should� change to dormant(5) if the interface is waiting for� external actions (such as a serial line waiting for an� incoming connection); it should remain in the down(2) state� if and only if there is a fault that prevents it from going� to the up(1) state; it should remain in the notPresent(6)� state if the interface has missing (typically, hardware)� components. |
| ifOutDiscards- 1.3.6.1.2.1.2.2.1.19 | if_out_discards | The number of outbound packets which were chosen to be� discarded even though no errors had been detected to prevent� their being transmitted. One possible reason for discarding� such a packet could be to free up buffer space.� � Discontinuities in the value of this counter can occur at� re-initialization of the management system, and at other� times as indicated by the value of� ifCounterDiscontinuityTime. |
| ifOutErrors- 1.3.6.1.2.1.2.2.1.20 | if_out_errors | For packet-oriented interfaces, the number of outbound� packets that could not be transmitted because of errors.� For character-oriented or fixed-length interfaces, the� number of outbound transmission units that could not be� transmitted because of errors.� � Discontinuities in the value of this counter can occur at� re-initialization of the management system, and at other� times as indicated by the value of� ifCounterDiscontinuityTime. |
BACK to TOC
ipAddressTable
| OID Name | Selector Queryable | Description |
|---|
| ipAddressAddr- 1.3.6.1.2.1.4.34.1.2 | | The IP address to which this entry’s addressing information� � pertains. The address type of this object is specified in� ipAddressAddrType.� � Implementors need to be aware that if the size of� ipAddressAddr exceeds 116 octets, then OIDS of instances of� columns in this row will have more than 128 sub-identifiers� and cannot be accessed using SNMPv1, SNMPv2c, or SNMPv3. |
| ipAddressIfIndex- 1.3.6.1.2.1.4.34.1.3 | | The index value that uniquely identifies the interface to� which this entry is applicable. The interface identified by� a particular value of this index is the same interface as� identified by the same value of the IF-MIB’s ifIndex. |
| ipAddressType- 1.3.6.1.2.1.4.34.1.4 | | The type of address. broadcast(3) is not a valid value for� IPv6 addresses (RFC 3513). |
BACK to TOC
LLDP-MIB
lldpRemTable
| OID Name | Selector Queryable | Description |
|---|
| lldpRemPortId- 1.0.8802.1.1.2.1.4.1.1.7 | | The string value used to identify the port component� associated with the remote system. |
| lldpRemSysName- 1.0.8802.1.1.2.1.4.1.1.9 | | The string value used to identify the system name of the� remote system. |
BACK to TOC
lldpRemTablesChange
| OID Name | Selector Queryable | Description |
|---|
| lldpRemIndex- 1.0.8802.1.1.2.1.4.1.1.3 | | This object represents an arbitrary local integer value used� by this agent to identify a particular connection instance,� unique only for the indicated remote system.� � An agent is encouraged to assign monotonically increasing� index values to new entries, starting with one, after each� reboot. It is considered unlikely that the lldpRemIndex� will wrap between reboots. |
| lldpRemLocalPortNum- 1.0.8802.1.1.2.1.4.1.1.2 | | The index value used to identify the port component� (contained in the local chassis with the LLDP agent)� associated with this entry. The lldpRemLocalPortNum� identifies the port on which the remote system information� is received.� � The value of this object is used as a port index to the� lldpRemTable. |
BACK to TOC
OSPF-MIB
ospfAreaTable
| OID Name | Selector Queryable | Description |
|---|
| ospfAreaBdrRtrCount- 1.3.6.1.2.1.14.2.1.5 | ospf_area_bdr_rtr_count_raw | The total number of Area Border Routers reachable� within this area. This is initially zero and is� calculated in each Shortest Path First (SPF) pass. |
| ospfAreaId- 1.3.6.1.2.1.14.2.1.1 | | A 32-bit integer uniquely identifying an area.� Area ID 0.0.0.0 is used for the OSPF backbone. |
| ospfAreaLsaCksumSum- 1.3.6.1.2.1.14.2.1.8 | | The 32-bit sum of the link state� advertisements’ LS checksums contained in this� area’s link state database. This sum excludes� external (LS type-5) link state advertisements.� The sum can be used to determine if there has� been a change in a router’s link state� database, and to compare the link state database of� two routers. The value should be treated as unsigned� when comparing two sums of checksums. |
| ospfAreaLsaCount- 1.3.6.1.2.1.14.2.1.7 | ospf_area_lsa_count_raw | The total number of link state advertisements� in this area’s link state database, excluding� AS-external LSAs. |
| ospfAreaStatus- 1.3.6.1.2.1.14.2.1.10 | | This object permits management of the table by� facilitating actions such as row creation,� construction, and destruction.� � The value of this object has no effect on� whether other objects in this conceptual row can be� modified. |
| ospfAreaSummary- 1.3.6.1.2.1.14.2.1.9 | | The variable ospfAreaSummary controls the� import of summary LSAs into stub and NSSA areas.� It has no effect on other areas.� � If it is noAreaSummary, the router will not� originate summary LSAs into the stub or NSSA area.� It will rely entirely on its default route.� � If it is sendAreaSummary, the router will both� summarize and propagate summary LSAs. |
| ospfAsBdrRtrCount- 1.3.6.1.2.1.14.2.1.6 | ospf_as_bdr_rtr_count_raw | The total number of Autonomous System Border� Routers reachable within this area. This is� initially zero and is calculated in each SPF� pass. |
| ospfAuthType- 1.3.6.1.2.1.14.2.1.2 | | The authentication type specified for an area. |
| ospfImportAsExtern- 1.3.6.1.2.1.14.2.1.3 | | Indicates if an area is a stub area, NSSA, or standard� area. Type-5 AS-external LSAs and type-11 Opaque LSAs are� not imported into stub areas or NSSAs. NSSAs import� AS-external data as type-7 LSAs |
| ospfSpfRuns- 1.3.6.1.2.1.14.2.1.4 | ospf_spf_runs_raw | The number of times that the intra-area route� table has been calculated using this area’s� link state database. This is typically done� using Dijkstra’s algorithm.� � Discontinuities in the value of this counter can occur� at re-initialization of the management system, and at other� times as indicated by the value of ospfDiscontinuityTime. |
BACK to TOC
ospfGeneralGroup
| OID Name | Selector Queryable | Description |
|---|
| ospfASBdrRtrStatus- 1.3.6.1.2.1.14.1.5 | | A flag to note whether this router is configured as� an Autonomous System Border Router.� � This object is persistent and when written the� entity SHOULD save the change to non-volatile storage. |
| ospfAdminStat- 1.3.6.1.2.1.14.1.2 | ospf_admin_stat_raw | The administrative status of OSPF in the� router. The value ’enabled’ denotes that the� OSPF Process is active on at least one interface;� ‘disabled’ disables it on all interfaces.� � This object is persistent and when written� the entity SHOULD save the change to non-volatile storage. |
| ospfAreaBdrRtrStatus- 1.3.6.1.2.1.14.1.4 | | A flag to note whether this router is an Area� Border Router. |
| ospfDemandExtensions- 1.3.6.1.2.1.14.1.14 | | The router’s support for demand routing.� This object is persistent and when written� the entity SHOULD save the change to non-volatile� storage. |
| ospfExitOverflowInterval- 1.3.6.1.2.1.14.1.13 | | The number of seconds that, after entering� OverflowState, a router will attempt to leave� OverflowState. This allows the router to again� originate non-default AS-external LSAs. When� set to 0, the router will not leave� overflow state until restarted.� � This object is persistent and when written� the entity SHOULD save the change to non-volatile� storage. |
| ospfExtLsdbLimit- 1.3.6.1.2.1.14.1.11 | | The maximum number of non-default� AS-external LSAs entries that can be stored in the� link state database. If the value is -1, then� there is no limit.� � When the number of non-default AS-external LSAs� in a router’s link state database reaches� ospfExtLsdbLimit, the router enters� overflow state. The router never holds more than� ospfExtLsdbLimit non-default AS-external LSAs� in its database. OspfExtLsdbLimit MUST be set� identically in all routers attached to the OSPF� backbone and/or any regular OSPF area (i.e.,� OSPF stub areas and NSSAs are excluded).� � This object is persistent and when written� the entity SHOULD save the change to non-volatile� storage. |
| ospfExternLsaCksumSum- 1.3.6.1.2.1.14.1.7 | | The 32-bit sum of the LS checksums of� the external link state advertisements� contained in the link state database. This sum� can be used to determine if there has been a� change in a router’s link state database and� to compare the link state database of two� routers. The value should be treated as unsigned� when comparing two sums of checksums. |
| ospfExternLsaCount- 1.3.6.1.2.1.14.1.6 | ospf_extern_lsa_count_raw | The number of external (LS type-5) link state� advertisements in the link state database. |
| ospfMulticastExtensions- 1.3.6.1.2.1.14.1.12 | | A bit mask indicating whether the router is� forwarding IP multicast (Class D) datagrams� based on the algorithms defined in the� multicast extensions to OSPF.� � Bit 0, if set, indicates that the router can� � forward IP multicast datagrams in the router’s� directly attached areas (called intra-area� multicast routing).� � Bit 1, if set, indicates that the router can� forward IP multicast datagrams between OSPF� areas (called inter-area multicast routing).� � Bit 2, if set, indicates that the router can� forward IP multicast datagrams between� Autonomous Systems (called inter-AS multicast� routing).� � Only certain combinations of bit settings are� allowed, namely: 0 (no multicast forwarding is� enabled), 1 (intra-area multicasting only), 3� (intra-area and inter-area multicasting), 5� (intra-area and inter-AS multicasting), and 7� (multicasting everywhere). By default, no� multicast forwarding is enabled.� � This object is persistent and when written� the entity SHOULD save the change to non-volatile� storage. |
| ospfOriginateNewLsas- 1.3.6.1.2.1.14.1.9 | ospf_originate_new_lsas_raw | The number of new link state advertisements� that have been originated. This number is� incremented each time the router originates a new� LSA.� � Discontinuities in the value of this counter can� occur at re-initialization of the management system,� and at other times as indicated by the value of� ospfDiscontinuityTime. |
| ospfRouterId- 1.3.6.1.2.1.14.1.1 | | A 32-bit integer uniquely identifying the� router in the Autonomous System.� By convention, to ensure uniqueness, this� should default to the value of one of the� router’s IP interface addresses.� � This object is persistent and when written� the entity SHOULD save the change to non-volatile storage. |
| ospfRxNewLsas- 1.3.6.1.2.1.14.1.10 | ospf_rx_new_lsas_raw | The number of link state advertisements received� that are determined to be new instantiations.� This number does not include newer instantiations� of self-originated link state advertisements.� � Discontinuities in the value of this counter can� occur at re-initialization of the management system,� and at other times as indicated by the value of� ospfDiscontinuityTime. |
| ospfTOSSupport- 1.3.6.1.2.1.14.1.8 | | The router’s support for type-of-service routing.� � This object is persistent and when written� the entity SHOULD save the change to non-volatile� storage. |
| ospfVersionNumber- 1.3.6.1.2.1.14.1.3 | | The current version number of the OSPF protocol is 2. |
BACK to TOC
ospfIfTable
| OID Name | Selector Queryable | Description |
|---|
| ospfIfAdminStat- 1.3.6.1.2.1.14.7.1.5 | ospf_if_admin_stat_raw | The OSPF interface’s administrative status.� The value formed on the interface, and the interface� will be advertised as an internal route to some area.� The value ‘disabled’ denotes that the interface is� external to OSPF. |
| ospfIfAreaId- 1.3.6.1.2.1.14.7.1.3 | | A 32-bit integer uniquely identifying the area� to which the interface connects. Area ID� 0.0.0.0 is used for the OSPF backbone. |
| ospfIfAuthKey- 1.3.6.1.2.1.14.7.1.16 | | The cleartext password used as an OSPF� authentication key when simplePassword security� is enabled. This object does not access any OSPF� cryptogaphic (e.g., MD5) authentication key under� any circumstance.� � If the key length is shorter than 8 octets, the� agent will left adjust and zero fill to 8 octets.� � Unauthenticated interfaces need no authentication� key, and simple password authentication cannot use� a key of more than 8 octets.� � Note that the use of simplePassword authentication� is NOT recommended when there is concern regarding� attack upon the OSPF system. SimplePassword� authentication is only sufficient to protect against� accidental misconfigurations because it re-uses� cleartext passwords [RFC1704].� � When read, ospfIfAuthKey always returns an octet� string of length zero. |
| ospfIfAuthType- 1.3.6.1.2.1.14.7.1.20 | | The authentication type specified for an interface.� � Note that this object can be used to engage� in significant attacks against an OSPF router. |
| ospfIfBackupDesignatedRouter- 1.3.6.1.2.1.14.7.1.14 | | The IP address of the backup designated� router. |
| ospfIfDemand- 1.3.6.1.2.1.14.7.1.19 | | Indicates whether Demand OSPF procedures (hello� suppression to FULL neighbors and setting the� DoNotAge flag on propagated LSAs) should be� performed on this interface. |
| ospfIfDesignatedRouter- 1.3.6.1.2.1.14.7.1.13 | | The IP address of the designated router. |
| ospfIfEvents- 1.3.6.1.2.1.14.7.1.15 | ospf_if_events_raw | The number of times this OSPF interface has� changed its state or an error has occurred.� � Discontinuities in the value of this counter can occur� at re-initialization of the management system, and at other� times as indicated by the value of ospfDiscontinuityTime. |
| ospfIfHelloInterval- 1.3.6.1.2.1.14.7.1.9 | | The length of time, in seconds, between the Hello packets� that the router sends on the interface. This value must be� the same for all routers attached to a common network. |
| ospfIfIpAddress- 1.3.6.1.2.1.14.7.1.1 | | The IP address of this OSPF interface. |
| ospfIfLsaCount- 1.3.6.1.2.1.14.7.1.21 | | The total number of link-local link state advertisements� in this interface’s link-local link state database. |
| ospfIfMulticastForwarding- 1.3.6.1.2.1.14.7.1.18 | | The way multicasts should be forwarded on this� interface: not forwarded, forwarded as data� link multicasts, or forwarded as data link� unicasts. Data link multicasting is not� meaningful on point-to-point and NBMA interfaces,� and setting ospfMulticastForwarding to 0 effectively� disables all multicast forwarding. |
| ospfIfPollInterval- 1.3.6.1.2.1.14.7.1.11 | | The larger time interval, in seconds, between the Hello� packets sent to an inactive non-broadcast multi-access� neighbor. |
| ospfIfRetransInterval- 1.3.6.1.2.1.14.7.1.8 | | The number of seconds between link state advertisement� retransmissions, for adjacencies belonging to this� interface. This value is also used when retransmitting� � database description and Link State request packets.� Note that minimal value SHOULD be 1 second. |
| ospfIfRtrDeadInterval- 1.3.6.1.2.1.14.7.1.10 | | The number of seconds that a router’s Hello packets have� not been seen before its neighbors declare the router down.� This should be some multiple of the Hello interval. This� value must be the same for all routers attached to a common� network. |
| ospfIfRtrPriority- 1.3.6.1.2.1.14.7.1.6 | | The priority of this interface. Used in� multi-access networks, this field is used in� the designated router election algorithm. The� value 0 signifies that the router is not eligible� to become the designated router on this particular� network. In the event of a tie in this value,� routers will use their Router ID as a tie breaker. |
| ospfIfState- 1.3.6.1.2.1.14.7.1.12 | ospf_if_state_raw | The OSPF Interface State. |
| ospfIfStatus- 1.3.6.1.2.1.14.7.1.17 | ospf_if_status_raw | This object permits management of the table by� facilitating actions such as row creation,� construction, and destruction.� � The value of this object has no effect on� whether other objects in this conceptual row can be� modified. |
| ospfIfTransitDelay- 1.3.6.1.2.1.14.7.1.7 | | The estimated number of seconds it takes to� transmit a link state update packet over this� interface. Note that the minimal value SHOULD be� 1 second. |
| ospfIfType- 1.3.6.1.2.1.14.7.1.4 | | The OSPF interface type.� By way of a default, this field may be intuited� from the corresponding value of ifType.� Broadcast LANs, such as Ethernet and IEEE 802.5,� take the value ‘broadcast’, X.25 and similar� technologies take the value ’nbma’, and links� that are definitively point to point take the� value ‘pointToPoint’. |
BACK to TOC
ospfNbrTable
| OID Name | Selector Queryable | Description |
|---|
| ospfNbmaNbrPermanence- 1.3.6.1.2.1.14.10.1.10 | | This variable displays the status of the entry;� ‘dynamic’ and ‘permanent’ refer to how the neighbor� became known. |
| ospfNbmaNbrStatus- 1.3.6.1.2.1.14.10.1.9 | ospf_nbma_nbr_status_raw | This object permits management of the table by� facilitating actions such as row creation,� construction, and destruction.� � The value of this object has no effect on� whether other objects in this conceptual row can be� modified. |
| ospfNbrEvents- 1.3.6.1.2.1.14.10.1.7 | ospf_nbr_events_raw | The number of times this neighbor relationship� has changed state or an error has occurred.� � Discontinuities in the value of this counter can occur� at re-initialization of the management system, and at other� times as indicated by the value of ospfDiscontinuityTime. |
| ospfNbrHelloSuppressed- 1.3.6.1.2.1.14.10.1.11 | | Indicates whether Hellos are being suppressed� to the neighbor. |
| ospfNbrIpAddr- 1.3.6.1.2.1.14.10.1.1 | | The IP address this neighbor is using in its� IP source address. Note that, on addressless� links, this will not be 0.0.0.0 but the� � address of another of the neighbor’s interfaces. |
| ospfNbrLsRetransQLen- 1.3.6.1.2.1.14.10.1.8 | ospf_nbr_ls_retrans_q_len_raw | The current length of the retransmission� queue. |
| ospfNbrOptions- 1.3.6.1.2.1.14.10.1.4 | | A bit mask corresponding to the neighbor’s� options field.� � Bit 0, if set, indicates that the system will� operate on Type of Service metrics other than� TOS 0. If zero, the neighbor will ignore all� metrics except the TOS 0 metric.� � Bit 1, if set, indicates that the associated� area accepts and operates on external� information; if zero, it is a stub area.� � Bit 2, if set, indicates that the system is� capable of routing IP multicast datagrams, that is� that it implements the multicast extensions to� OSPF.� � Bit 3, if set, indicates that the associated� area is an NSSA. These areas are capable of� carrying type-7 external advertisements, which� are translated into type-5 external advertisements� at NSSA borders. |
| ospfNbrPriority- 1.3.6.1.2.1.14.10.1.5 | | The priority of this neighbor in the designated� router election algorithm. The value 0 signifies� that the neighbor is not eligible to become� the designated router on this particular network. |
| ospfNbrRtrId- 1.3.6.1.2.1.14.10.1.3 | | A 32-bit integer (represented as a type� IpAddress) uniquely identifying the neighboring� router in the Autonomous System. |
| ospfNbrState- 1.3.6.1.2.1.14.10.1.6 | ospf_nbr_state_raw; ospf_nbma_nbr_status_raw | The state of the relationship with this neighbor. |
BACK to TOC
SNMPv2-MIB
system
| OID Name | Selector Queryable | Description |
|---|
| sysName- 1.3.6.1.2.1.1.5 | | An administratively-assigned name for this managed� node. By convention, this is the node’s fully-qualified� domain name. If the name is unknown, the value is� the zero-length string. |
| sysUpTime- 1.3.6.1.2.1.1.3 | sys_uptime | The time (in hundredths of a second) since the� network management portion of the system was last� re-initialized. |
BACK to TOC
Cisco Proprietary OIDs
CISCO-EIGRP-MIB
cEigrpInterfaceTable
| OID Name | Selector Queryable | Description |
|---|
| cEigrpPeerAddr- 1.3.6.1.4.1.9.9.449.1.4.1.1.3 | | The source IP address used by the peer to establish the� EIGRP adjacency with this router. The format is� governed by object cEigrpPeerAddrType. |
| cEigrpPeerCount- 1.3.6.1.4.1.9.9.449.1.5.1.1.3 | cisco_eigrp_peer_count | The number of EIGRP adjacencies currently formed with� peers reached through this interface. |
| cEigrpPeerIfIndex- 1.3.6.1.4.1.9.9.449.1.4.1.1.4 | | The ifIndex of the interface on this router through� which this peer can be reached. |
| cEigrpUpTime- 1.3.6.1.4.1.9.9.449.1.4.1.1.6 | cisco_eigrp_peer_uptime | The elapsed time since the EIGRP adjacency was first� established with the peer. |
cEigrpTraffStatsTable
| OID Name | Selector Queryable | Description |
|---|
| cEigrpInputQDrops- 1.3.6.1.4.1.9.9.449.1.2.1.1.14 | cisco_eigrp_pkt_drop_input_q | The number of EIGRP packets dropped from the input� queue due to it being full within the AS. |
| cEigrpNbrCount- 1.3.6.1.4.1.9.9.449.1.2.1.1.2 | cisco_eigrp_nbr_count | The total number of live EIGRP neighbors formed on all� interfaces whose IP addresses fall under networks configured� in the EIGRP AS. |
| cEigrpTopoRoutes- 1.3.6.1.4.1.9.9.449.1.2.1.1.19 | cisco_eigrp_topo_routes_count | The total number of EIGRP derived routes currently existing� in the topology table for the AS. |
CISCO-HSRP-EXT-MIB
cHsrpExtIfTrackedTable
| OID Name | Selector Queryable | Description |
|---|
| cHsrpExtIfTracked- 1.3.6.1.4.1.9.9.107.1.1.1.1.1 | | The ifIndex value of the tracked interface. |
| cHsrpExtIfTrackedPriority- 1.3.6.1.4.1.9.9.107.1.1.1.1.2 | | Priority of the tracked interface for the corresponding� { ifIndex, cHsrpGrpNumber } pair. In the range of 0 to 255, 0� is the lowest priority and 255 is the highest. When a tracked � interface is unavailable, the cHsrpGrpPriority of the router � is decreased by the value of this object instance (If the � cHsrpGrpPriority is less than the � cHsrpExtIfTrackedPriority, then the HSRP priority � becomes 0). This allows a standby router to be configured � with a priority such that if the currently active router’s � priority is lowered because the tracked interface goes down, � the standby router can takeover. |
cHsrpExtSecAddrTable
| OID Name | Selector Queryable | Description |
|---|
| cHsrpExtSecAddrAddress- 1.3.6.1.4.1.9.9.107.1.1.2.1.1 | | A secondary IpAddress for the {ifIndex, cHsrpGrpNumber} pair.� As explained in the DESCRIPTION for cHsrpExtSecAddrEntry, a� primary address must exist before a secondary address for � the same {ifIndex, cHsrpGrpNumber} pair can be created. |
| cHsrpExtSecAddrRowStatus- 1.3.6.1.4.1.9.9.107.1.1.2.1.2 | | The control that allows modification, creation, and deletion� of entries. For detailed rules see the DESCRIPTION for� cHsrpExtSecAddrEntry. |
CISCO-CDP-MIB
mib
| OID Name | Selector Queryable | Description |
|---|
| cdpCacheDeviceId- 1.3.6.1.4.1.9.9.23.1.2.1.1.6 | | The Device-ID string as reported in the most recent CDP� message. The zero-length string indicates no Device-ID� field (TLV) was reported in the most recent CDP� message. |
| cdpCacheDevicePort- 1.3.6.1.4.1.9.9.23.1.2.1.1.7 | | The Port-ID string as reported in the most recent CDP� message. This will typically be the value of the ifName� object (e.g., ‘Ethernet0’). The zero-length string� indicates no Port-ID field (TLV) was reported in the� most recent CDP message. |
CISCO-HSRP-MIB
cHsrpGrpTable
| OID Name | Selector Queryable | Description |
|---|
| cHsrpGrpActiveRouter- 1.3.6.1.4.1.9.9.106.1.2.1.1.13 | | Ip Address of the currently active router for this group. |
| cHsrpGrpNumber- 1.3.6.1.4.1.9.9.106.1.2.1.1.1 | | This object along with the ifIndex of a particular interface� uniquely identifies an HSRP group.� � Group numbers 0,1 and 2 are the only valid group numbers� for TokenRing interfaces. For other media types, numbers� range from 0 to 255. Each interface has its own set of group� numbers. There’s no relationship between the groups� configured on different interfaces. Using a group number� on one interface doesn’t preclude using the same group� number on a different interface. For example, there can be� a group 1 on an Ethernet and a group 1 on Token Ring. More� details can be found from RFC 2281. |
| cHsrpGrpPreempt- 1.3.6.1.4.1.9.9.106.1.2.1.1.4 | | This object, if TRUE, indicates that the current router� should attempt to overthrow a lower priority active router� and attempt to become the active router. If this object is� FALSE, the router will become the active router only if� there is no such router (or if an active router fails). |
| cHsrpGrpPriority- 1.3.6.1.4.1.9.9.106.1.2.1.1.3 | | The cHsrpGrpPriority helps to select the active and the� standby routers. The router with the highest priority is� selected as the active router. In the priority range of 0� to 255, 0 is the lowest priority and 255 is the highest� priority.� � If two (or more) routers in a group have the same priority,� the one with the highest ip address of the interface is the� active router. When the active router fails to send a Hello� message within a configurable period of time, the standby� router with the highest priority becomes the active� router.� � A router with highest priority will only attempt to� overthrow a lower priority active router if it is� configured to preempt. But, if there is more than one� router which is not active, the highest priority non-active� router becomes the standby router. |
| cHsrpGrpStandbyRouter- 1.3.6.1.4.1.9.9.106.1.2.1.1.14 | | Ip Address of the currently standby router for this� group. |
| cHsrpGrpStandbyState- 1.3.6.1.4.1.9.9.106.1.2.1.1.15 | cisco_hspr_group_state | The current HSRP state of this group on this interface. |
| cHsrpGrpVirtualIpAddr- 1.3.6.1.4.1.9.9.106.1.2.1.1.11 | | This is the primary virtual IP address used by this� group. If this address is configured (i.e a non zero ip� address), this value is used. Otherwise, the agent will� attempt to discover the virtual address through a discovery� process (which scans the hello messages). |
| cHsrpGrpVirtualMacAddr- 1.3.6.1.4.1.9.9.106.1.2.1.1.16 | | Mac Addresses used are as specified in RFC 2281. For� ethernet and fddi interfaces, a MAC address will be in the� range 00:00:0c:07:ac:00 through 00:00:0c:07:ac:ff. The last� octet is the hexadecimal equivalent of cHsrpGrpNumber� (0-255).� � Some Ethernet and FDDI interfaces allow a unicast MAC� address for each HSRP group. Certain Ethernet� chipsets(LANCE Ethernet, VGANYLAN and QUICC Ethernet) only� support a single Unicast Mac Address. In this case, only� one HSRP group is allowed.� � For TokenRing interfaces, the following three MAC � addresses are permitted (functional addresses):� C0:00:00:01:00:00� C0:00:00:02:00:00� C0:00:00:04:00:00. |
CISCO-VPC-MIB
cVpcRoleTable
| OID Name | Selector Queryable | Description |
|---|
| cVpcLocalOperMacAddress- 1.3.6.1.4.1.9.9.807.1.2.1.1.6 | | This object indicates VPC local system operational� MAC address. |
| cVpcRoleDomainID- 1.3.6.1.4.1.9.9.807.1.2.1.1.1 | | An arbitrary value to uniquely identify the VPC management� domain on the local system.� � Value zero indicates there is no VPC management domain� being configured for this device. |
| cVpcRoleStatus- 1.3.6.1.4.1.9.9.807.1.2.1.1.2 | | This object indicates the VPC role status of the peer device.� � primarySecondary(1) : primary, and operational secondary.� � primary(2) : primary, and operational primary.� � secondaryPrimary(3) : secondary, and operational primary.� � secondary(4) : secondary, and operational secondary.� � noneEstabished(5) : none peer device. |
| cVpcSystemAdminMacAddress- 1.3.6.1.4.1.9.9.807.1.2.1.1.4 | | This object specifies VPC system MAC address. |
cVpcStatusHostLinkTable
| OID Name | Selector Queryable | Description |
|---|
| cVpcStatusHostLinkIfIndex- 1.3.6.1.4.1.9.9.807.1.4.2.1.3 | | The value of the ifIndex corresponding to a host-link� interface. |
| cVpcStatusHostLinkStatus- 1.3.6.1.4.1.9.9.807.1.4.2.1.4 | cisco_vpc_hostlink_status | This object indicates the current status of VPC host-link.� � down(1) : Host link is down.� � downStar(2) : Local host link is down, forwarding via vPC � peer-link.� � up(3) : Host link is up. |
| cVpcStatusHostLinkVpcID- 1.3.6.1.4.1.9.9.807.1.4.2.1.2 | | An arbitrary value to uniquely identify a VPC link between� the host and the switch for a given VPC management domain. |
cVpcStatusPeerKeepAliveTable
| OID Name | Selector Queryable | Description |
|---|
| cVpcPeerKeepAliveDomainID- .1.3.6.1.4.1.9.9.807.1.1.2.1.1 | | An arbitrary value to uniquely identify the VPC management� domain on the local system.� � Value zero indicates there is no VPC management domain� being configured for this device. |
| cVpcPeerKeepAliveMsgRcvrStatus- 1.3.6.1.4.1.9.9.807.1.1.2.1.7 | | This object indicates VPC peer keep-alive message� receiving status. |
| cVpcPeerKeepAliveMsgReceiveInterface- 1.3.6.1.4.1.9.9.807.1.1.2.1.9 | | This object indicates the ifIndex of interface of� VPC peer keep-alive message last received. |
| cVpcPeerKeepAliveMsgSendInterface- 1.3.6.1.4.1.9.9.807.1.1.2.1.6 | | This object indicates the ifIndex of interface of VPC� peer keep-alive message sent on. |
| cVpcPeerKeepAliveStatus- 1.3.6.1.4.1.9.9.807.1.1.2.1.2 | cisco_vpc_peer_keep_alive_status_all, cisco_vpc_peer_keep_alive_status_rcvr | This object indicates VPC peer keep-alive status.� � disabled(1) : Peer-keepalive is disabled.� � alive(2) : Peer-keepalive is alive.� � peerUnreachable(3) : Peer is unreachable through� Peer-keepalive link.� � aliveButDomainIdDismatch(4) : Peer-keepalive is alive, � but VPC domain doesn’t match with each other.� � suspendedAsISSU(5) : Peer-keepalive is suspended during ISSU.� � suspendedAsDestIPUnreachable(6) : Peer-keepalive is suspended� since destination ip is unreachable.� � suspendedAsVRFUnusable(7) : Peer-keepalive is suspended since� the current VRF is unusable.� � misconfigured(8) : Misconfigure Peer-keepalive feature. |
| cVpcPeerKeepAliveTime- 1.3.6.1.4.1.9.9.807.1.1.2.1.3 | cisco_vpc_peer_alive_time_all, cisco_vpc_peer_alive_time_rcvr | This object indicates the time (in msec) since the peer� became alive.� � It will hold value 0 if peer-keepalive never becomes alive. |
CISCO-BGP4-MIB
cbgpPeer2Table
| OID Name | Selector Queryable | Description |
|---|
| cbgpPeer2AdminStatus- 1.3.6.1.4.1.9.9.187.1.2.5.1.4 | bgp_peer_admin_status_raw | The desired state of the BGP connection.� A transition from ‘stop’ to ‘start’ will cause� the BGP Manual Start Event to be generated.� A transition from ‘start’ to ‘stop’ will cause� the BGP Manual Stop Event to be generated.� This parameter can be used to restart BGP peer� connections. Care should be used in providing� write access to this object without adequate� authentication. |
| cbgpPeer2FsmEstablishedTime- 1.3.6.1.4.1.9.9.187.1.2.5.1.19 | bgp_peer_fsm_established_time_raw | This timer indicates how long (in� seconds) this peer has been in the� established state or how long� since this peer was last in the� established state. It is set to zero when� a new peer is configured or when the router is� booted. |
| cbgpPeer2InUpdates- 1.3.6.1.4.1.9.9.187.1.2.5.1.13 | bgp_peer_in_updates_raw | The number of BGP UPDATE messages� received on this connection. |
| cbgpPeer2LocalAddr- 1.3.6.1.4.1.9.9.187.1.2.5.1.6 | | The local IP address of this entry’s BGP� connection. |
| cbgpPeer2LocalAs- 1.3.6.1.4.1.9.9.187.1.2.5.1.8 | | The local AS number for this session. |
| cbgpPeer2OutUpdates- 1.3.6.1.4.1.9.9.187.1.2.5.1.14 | bgp_peer_out_updates_raw | The number of BGP UPDATE messages� transmitted on this connection. |
| cbgpPeer2RemoteAddr- 1.3.6.1.4.1.9.9.187.1.2.5.1.2 | | The remote IP address of this entry’s BGP� peer. |
| cbgpPeer2RemoteAs- 1.3.6.1.4.1.9.9.187.1.2.5.1.11 | | The remote autonomous system number received in� the BGP OPEN message. |
| cbgpPeer2RemotePort- 1.3.6.1.4.1.9.9.187.1.2.5.1.10 | | The remote port for the TCP connection� between the BGP peers. Note that the� objects cbgpPeer2LocalAddr,� cbgpPeer2LocalPort, cbgpPeer2RemoteAddr, and� cbgpPeer2RemotePort provide the appropriate� reference to the standard MIB TCP� connection table. |
| cbgpPeer2State- 1.3.6.1.4.1.9.9.187.1.2.5.1.3 | bgp_peer_state_raw | The BGP peer connection state. |
CISCO-ENTITY-FRU-CONTROL-MIB
cefcFanTrayStatusTable
| OID Name | Selector Queryable | Description |
|---|
| cefcFanTrayOperStatus- 1.3.6.1.4.1.9.9.117.1.4.1.1.1 | fan_tray_oper_status | The operational state of the fan or fan tray.� unknown(1) - unknown.� up(2) - powered on.� down(3) - powered down.� warning(4) - partial failure, needs replacement � as soon as possible. |
cefcFruPowerStatusTable
| OID Name | Selector Queryable | Description |
|---|
| cefcFRUPowerOperStatus- 1.3.6.1.4.1.9.9.117.1.1.2.1.2 | fru_power_oper_status | Operational FRU power state. |
CISCO-ETHERNET-FABRIC-EXTENDER-MIB
cefexBindingTable
| OID Name | Selector Queryable | Description |
|---|
| cefexBindingCreationTime- 1.3.6.1.4.1.9.9.691.1.1.1.1.3 | | The timestamp of this entry’s creation time. |
| cefexBindingExtenderIndex- 1.3.6.1.4.1.9.9.691.1.1.1.1.2 | | The value of cefexBindingExtenderIndex used as an� Index into the cefexConfigTable to select the Fabric� Extender configuration for this binding entry. However,� a value in this table does not imply that an instance with� this value exists in the cefexConfigTable.� � If an entry corresponding to the value of this object does� not exist in cefexConfigTable, the system default behavior� (using DEFVAL values for all the configuration objects as� defined in cefexConfigTable) of the Fabric Extender is � used for this binding entry.� � Since an extender may connect to a core switch via� multiple interfaces or fabric ports, it is important all � the binding entries configuring the same fabric extender � are configured with the same extender Index. Every � interface on different fabric extender connecting into� the same core switch is differentiated by its extender id. � To refer to a port on the extender, an example � representation may be extender/slot/port. Extender id � values 1-99 are reserved. For example, reserved values can� be used to identify the core switch and its line cards in � the extender/slot/port naming scheme.� � cefexBindingExtenderIndex identifies further attributes� of a fabric extender via the cefexConfigTable. A user� may choose to identify a fabric extender by� specifying its value of cefexConfigExtendername and/or� other attributes. |
| cefexBindingInterfaceOnCoreSwitch- 1.3.6.1.4.1.9.9.691.1.1.1.1.1 | | This object is the index that uniquely identifies an entry in� the cefexBindingTable. The value of this object is an IfIndex� to a fabric port. By creating a row in this table for � a particular core switch interface, the user enables that � core switch interface to accept a fabric extender. By default, � a core switch interface does not have an entry in this table � and consequently does not accept/respond to discovery � requests from fabric extenders. |
| cefexBindingRowStatus- 1.3.6.1.4.1.9.9.691.1.1.1.1.4 | fex_binding_row_status | The status of this conceptual row. |
cefexConfigTable
| OID Name | Selector Queryable | Description |
|---|
| cefexConfigCreationTime- 1.3.6.1.4.1.9.9.691.1.1.2.1.6 | | The timestamp when the value of the corresponding� instance of ‘cefexConfigRowStatus’ is made active.� If an user modifies objects in this table,� the new values are immediately activated. � Depending on the object changed, an accepted � fabric extender may become not acceptable.� As a result, the fabric extender may be � disconnected from the core switch. |
| cefexConfigExtenderName- 1.3.6.1.4.1.9.9.691.1.1.2.1.1 | | This object specifies a human readable string representing� the name of the ‘Extender’. Note that default value of� this object will be the string ‘FEXxxxx’ where xxxx is � value of cefexBindingExtenderIndex expressed as 4 digits. � For example, if cefexBindingExtenderIndex is 123, the � default value of this object is ‘FEX0123’. This object � allows the user to identify the extender with an � appropriate name. |
| cefexConfigPinningFailOverMode- 1.3.6.1.4.1.9.9.691.1.1.2.1.4 | fex_pinning_failover_mode | This object allows the user to identify the� fabric port failure handling method when pinning � is used. |
| cefexConfigPinningMaxLinks- 1.3.6.1.4.1.9.9.691.1.1.2.1.5 | fex_pinning_max_links | This object allows the user to identify number of� fabric ports to be used in distribution of pinned� non fabric ports. As described above, pinning is the� forwarding model used for fabric extenders� that do not support local forwarding. Traffic� from a non fabric port is forwarded to one� fabric port. Selection of non fabric port pinning� to fabric ports is distributed as evenly as � possible across fabric ports. This object � allows administrator to configure number� of fabric ports that should be used � for pinning non fabric ports. |
| cefexConfigRowStatus- 1.3.6.1.4.1.9.9.691.1.1.2.1.7 | fex_config_row_status | The status of this conceptual row. A row in this� table becomes active immediately upon creation. |
| cefexConfigSerialNum- 1.3.6.1.4.1.9.9.691.1.1.2.1.3 | | This object allows the user to identify a fabric� extender’s Serial Number String. This object is� relevant if cefexBindingSerialNumCheck is true.� Zero is not a valid length for this object� if cefexBindingSerialNumCheck is true. |
| cefexConfigSerialNumCheck- 1.3.6.1.4.1.9.9.691.1.1.2.1.2 | | This object specifies if the serial number check is� enabled for this extender or not. If the value of this� object is ’true’, then the core switch rejects any � extender except for the one with serial� number string specified by cefexConfigSerialNum. � If the value of this object is ‘false’, then the core � switch accept any extender. |
CISCO-ENHANCED-MEMPOOL-MIB
cempMemPoolTable
| OID Name | Selector Queryable | Description |
|---|
| cempMemPoolHCFree- 1.3.6.1.4.1.9.9.221.1.1.1.1.20 | cisco_mem_pool_free | Indicates the number of bytes from the memory pool� that are currently unused on the physical entity.� This object is a 64-bit version of cempMemPoolFree. |
| cempMemPoolHCUsed- 1.3.6.1.4.1.9.9.221.1.1.1.1.18 | device_inventory_presence | Indicates the number of bytes from the memory pool� that are currently in use by applications on the� physical entity. This object is a 64-bit version of� cempMemPoolUsed. |
| cempMemPoolName- 1.3.6.1.4.1.9.9.221.1.1.1.1.3 | pan_ha_mode, pan_ha_peer_state, pan_ha_state | A textual name assigned to the memory pool. This� object is suitable for output to a human operator,� and may also be used to distinguish among the various� pool types. |
CISCO-ENVMON-MIB
ciscoEnvMonPresent
| OID Name | Selector Queryable | Description |
|---|
| ciscoEnvMonFanState- 1.3.6.1.4.1.9.9.13.1.4.1.3 | ent_power_oper_state | The current state of the fan being instrumented. |
| ciscoEnvMonFanStatusDescr-1.3.6.1.4.1.9.9.13.1.4.1.2 | | Textual description of the fan being instrumented.� This description is a short textual label, suitable as a� human-sensible identification for the rest of the� information in the entry. |
| ciscoEnvMonFanStatusIndex-1.3.6.1.4.1.9.9.13.1.4.1.1 | | Unique index for the fan being instrumented.� This index is for SNMP purposes only, and has no� intrinsic meaning. |
ciscoEnvMonSupplyStatusTable
| OID Name | Selector Queryable | Description |
|---|
| ciscoEnvMonSupplyState- 1.3.6.1.4.1.9.9.13.1.5.1.3 | ent_power_oper_state | The current state of the power supply being instrumented. |
| ciscoEnvMonSupplyStatusDescr- 1.3.6.1.4.1.9.9.13.1.5.1.2 | | Textual description of the power supply being instrumented.� This description is a short textual label, suitable as a� human-sensible identification for the rest of the� information in the entry. |
| ciscoEnvMonSupplyStatusIndex-1.3.6.1.4.1.9.9.13.1.5.1.1 | | Unique index for the power supply being instrumented.� This index is for SNMP purposes only, and has no� intrinsic meaning. |
ciscoEnvMonTemperatureStatusTable
| OID Name | Selector Queryable | Description |
|---|
| ciscoEnvMonTemperatureStatusDescr- 1.3.6.1.4.1.9.9.13.1.3.1.2 | | Textual description of the testpoint being instrumented.� This description is a short textual label, suitable as a� human-sensible identification for the rest of the� information in the entry. |
| ciscoEnvMonTemperatureStatusIndex- 1.3.6.1.4.1.9.9.13.1.3.1.1 | | Unique index for the testpoint being instrumented.� This index is for SNMP purposes only, and has no� intrinsic meaning. |
| ciscoEnvMonTemperatureStatusValue-1.3.6.1.4.1.9.9.13.1.3.1.3 | temp_value_c | The current measurement of the testpoint being instrumented. |
CISCO-MEMORY-POOL-MIB
ciscoMemoryPoolTable
| OID Name | Selector Queryable | Description |
|---|
| ciscoMemoryPoolFree- 1.3.6.1.4.1.9.9.48.1.1.1.6 | cisco_mem_pool_free | Indicates the number of bytes from the memory pool� that are currently unused on the managed device.� � Note that the sum of ciscoMemoryPoolUsed and� ciscoMemoryPoolFree is the total amount of memory� in the pool |
| ciscoMemoryPoolName- 1.3.6.1.4.1.9.9.48.1.1.1.2 | pan_ha_mode, pan_ha_peer_state, pan_ha_state | A textual name assigned to the memory pool. This� object is suitable for output to a human operator,� and may also be used to distinguish among the various� pool types, especially among dynamic pools. |
| ciscoMemoryPoolUsed- 1.3.6.1.4.1.9.9.48.1.1.1.5 | device_inventory_presence | Indicates the number of bytes from the memory pool� that are currently in use by applications on the� managed device. |
CISCO-PROCESS-MIB
cpmCpuTotalTable
| OID Name | Selector Queryable | Description |
|---|
| cpmCPUTotal5minRev- 1.3.6.1.4.1.9.9.109.1.1.1.1.8 | cpu_util_raw, cpu_util_5min_raw | The overall CPU busy percentage in the last 5 minute� period. This object deprecates the object cpmCPUTotal5min � and increases the value range to (0..100). |
| cpmCPUTotalIndex- 1.3.6.1.4.1.9.9.109.1.1.1.1.1 | | An index that uniquely represents a CPU (or group of CPUs)� whose CPU load information is reported by a row in this table.� This index is assigned arbitrarily by the engine� and is not saved over reboots. |
CISCO-STACKWISE-MIB
cswStackInfo
| OID Name | Selector Queryable | Description |
|---|
| cswSwitchHwPriority- 1.3.6.1.4.1.9.9.500.1.2.1.1.5 | csw_switch_hw_priority | This object contains the hardware priority of a switch. If� two or more entries in this table have the same� cswSwitchSwPriority value during the master election time,� the switch with the highest cswSwitchHwPriority will become� the master.� � Note: This object will contain the value of 0 if the� cswSwitchState value is other than ‘ready’. |
| cswSwitchMacAddress- 1.3.6.1.4.1.9.9.500.1.2.1.1.7 | | The MAC address of the switch.� � Note: This object will contain the value of 0000:0000:0000� if the cswSwitchState value is other than ‘ready’. |
| cswSwitchNumCurrent- 1.3.6.1.4.1.9.9.500.1.2.1.1.1 | csw_switch_num_current | This object contains the current switch identification number.� This number should match any logical labeling on the switch.� For example, a switch whose interfaces are labeled� ‘interface #3’ this value should be 3. |
| cswSwitchRole- 1.3.6.1.4.1.9.9.500.1.2.1.1.3 | csw_switch_role | This object describes the function of the switch:� � master - stack master.� � member - active member of the stack.� � notMember - none-active stack member, see� cswSwitchState for status.� � standby - stack standby switch. |
| cswSwitchState- 1.3.6.1.4.1.9.9.500.1.2.1.1.6 | csw_switch_state | The current state of a switch:� � waiting - Waiting for a limited time on other� switches in the stack to come online.� � progressing - Master election or mismatch checks in� progress.� � added - The switch is added to the stack.� � ready - The switch is operational.� � sdmMismatch - The SDM template configured on the master� is not supported by the new member.� � verMismatch - The operating system version running on the� master is different from the operating� system version running on this member.� � featureMismatch - Some of the features configured on the� master are not supported on this member.� � newMasterInit - Waiting for the new master to finish� initialization after master switchover� (Master Re-Init).� � provisioned - The switch is not an active member of the� stack.� � invalid - The switch’s state machine is in an� invalid state.� � removed - The switch is removed from the stack. |
| cswSwitchSwPriority- 1.3.6.1.4.1.9.9.500.1.2.1.1.4 | csw_switch_sw_priority | A number containing the priority of a switch. The switch with� the highest priority will become the master. The maximum value� for this object is defined by the cswMaxSwitchConfigPriority� object.� � If after a reload the value of cswMaxSwitchConfigPriority� changes to a smaller value, and the value of cswSwitchSwPriority� has been previously set to a value greater or equal to the� new cswMaxSwitchConfigPriority, then the SNMP agent must set� cswSwitchSwPriority to the new cswMaxSwitchConfigPriority.� � Note: This object will contain the value of 0 if the� cswSwitchState value is other than ‘ready’. |
CISCO-VRF-MIB
cvVrfTable
| OID Name | Selector Queryable | Description |
|---|
| cvVrfIndex- 1.3.6.1.4.1.9.9.711.1.1.1.1.1 | | An identifier that is assigned to each VRF and is used to� uniquely identify it. The uniqueness of this identifier is� restricted only to this device. |
| cvVrfName- 1.3.6.1.4.1.9.9.711.1.1.1.1.2 | | The human-readable name of the VRF instance. This name� uniquely identifies the VRF instance in the system.� � This object is mandatory for creating an entry in this table. |
| cvVrfOperStatus- 1.3.6.1.4.1.9.9.711.1.1.1.1.4 | cisco_vrf_status | Denotes whether a VRF is operational or not. A VRF is� up(1) when at least one interface associated with the� VRF, which ifOperStatus is up(1). A VRF is down(2) when:� � a. There does not exist at least one interface whose� ifOperStatus is up(1).� � b. There are no interfaces associated with the VRF. |
CISCO-ENTITY-SENSOR-MIB
entSensorValueTable
| OID Name | Selector Queryable | Description |
|---|
| entSensorType- 1.3.6.1.4.1.9.9.91.1.1.1.1.1 | | This variable indicates the type of data� reported by the entSensorValue.� � This variable is set by the agent at start-up� and the value does not change during operation. |
| entSensorValue- 1.3.6.1.4.1.9.9.91.1.1.1.1.4 | netflow_conversation_bytes | This variable reports the most recent measurement seen� by the sensor.� � To correctly display or interpret this variable’s value, � you must also know entSensorType, entSensorScale, and � entSensorPrecision.� � However, you can compare entSensorValue with the threshold� values given in entSensorThresholdTable without any semantic� knowledge. |
Back to Vendor TOC
Extreme Proprietary MIBs
EXTREME-SYSTEM-MIB
extremeFanStatusTable
| OID Name | Selector Queryable | Description |
|---|
| extremeFanEntPhysicalIndex-1.3.6.1.4.1.1916.1.1.1.9.1.3 | | The entity index for this fan entity in the entityPhysicalTable table of the� entity MIB. |
| extremeFanNumber- 1.3.6.1.4.1.1916.1.1.1.9.1.1 | | Identifier of cooling fan, numbered from the front and/or � left side of device. |
| extremeFanOperational- 1.3.6.1.4.1.1916.1.1.1.9.1.2 | extreme_fan_state | Operational status of a cooling fan. |
extremePowerSupplyTable
| OID Name | Selector Queryable | Description |
|---|
| extremePowerSupplyEntPhysicalIndex- 1.3.6.1.4.1.1916.1.1.1.27.1.5 | | The entity index for this psu entity in the entityPhysicalTable� of the entity MIB. |
| extremePowerSupplySerialNumber- 1.3.6.1.4.1.1916.1.1.1.27.1.4 | | The serial number of the power supply unit. |
| extremePowerSupplyStatus- 1.3.6.1.4.1.1916.1.1.1.27.1.2 | extreme_power_supply_state | Status of the power supply. |
extremeSystemCommon
| OID Name | Selector Queryable | Description |
|---|
| extremeCurrentTemperature-1.3.6.1.4.1.1916.1.1.1.8 | extreme_temp_value_c | Current temperature in degrees celsius measured inside device enclosure. |
Back to Vendor TOC
F5 Proprietary MIB OIDs
F5-BIGIP-SYSTEM-MIB
cpmCPUTotalTable
| OID Name | Selector Queryable | Description |
|---|
| sysStatMemoryTotal- 1.3.6.1.4.1.3375.2.1.1.2.1.44 | memory_size | The total memory available in bytes for TMM (Traffic Management Module).� Use sysStatMemoryTotalKb for gauge type. |
| sysStatMemoryUsed- 1.3.6.1.4.1.3375.2.1.1.2.1.45 | memory_used | The memory in use in bytes for TMM (Traffic Management Module).� Use sysStatMemoryUsedKb for gauge type. |
sysChassisFanTable
| OID Name | Selector Queryable | Description |
|---|
| sysChassisFanIndex- 1.3.6.1.4.1.3375.2.1.3.2.1.2.1.1 | | The index of a chassis fan on the system. It identifies a � particular chassis fan. |
| sysChassisFanStatus- 1.3.6.1.4.1.3375.2.1.3.2.1.2.1.2 | fan_f5_chassis_state | The status of the indexed chassis fan on the system.,� This is only supported for the platform where � the sensor data is available. |
sysChassisPowerSupplyTable
| OID Name | Selector Queryable | Description |
|---|
| sysChassisPowerSupplyIndex - 1.3.6.1.4.1.3375.2.1.3.2.2.2.1.1 | | The index of a power supply on the system. |
| sysChassisPowerSupplyStatus - 1.3.6.1.4.1.3375.2.1.3.2.2.2.1.2 | power_supply_f5_chassis_state | The status of the indexed power supply on the system., This is only supported for the platform where the sensor data is available. |
sysChassisTempTable
| OID Name | Selector Queryable | Description |
|---|
| sysChassisTempIndex- 1.3.6.1.4.1.3375.2.1.3.2.3.2.1.1 | | The index of a chassis temperature sensor on the system. � It identifies a particular chassis temperature sensor, fan, etc. |
| sysChassisTempTemperature- 1.3.6.1.4.1.3375.2.1.3.2.3.2.1.2 | temp_value_f5_chassis_c | The chassis temperature (in Celsius) of the indexed sensor on the system.,� This is only supported for the platform where � the sensor data is available. |
sysCmFailoverStatus
| OID Name | Selector Queryable | Description |
|---|
| sysCmFailoverStatusColor- 1.3.6.1.4.1.3375.2.1.14.3.3 | f5_ha_failover_status | The color of the failover status on the system.� green - the system is functioning correctly;� yellow - the system may be functioning suboptimally;� red - the system requires attention to function correctly;� blue - the system’s status is unknown or incomplete;� gray - the system is intentionally not functioning (offline);� black - the system is not connected to any peers. |
| sysCmFailoverStatusId- 1.3.6.1.4.1.3375.2.1.14.3.1 | f5_ha_mode | The failover status ID on the system.� unknown - the failover status of the device is unknown;� offline - the device is offline;� forcedOffline - the device is forced offline;� standby - the device is standby;� active - the device is active. |
| sysCmFailoverStatusStatus- 1.3.6.1.4.1.3375.2.1.14.3.2 | | The failover status on the system. |
| sysCmFailoverStatusSummary- 1.3.6.1.4.1.3375.2.1.14.3.4 | | The summary of the failover status on the system. |
sysLldpNeighborsTableTable
| OID Name | Selector Queryable | Description |
|---|
| sysLldpNeighborsTableLocalInterface- 1.3.6.1.4.1.3375.2.1.2.16.1.2.1.3 | | The local port ID to which the LLDP neighbor is connected. |
| sysLldpNeighborsTablePortDesc- 1.3.6.1.4.1.3375.2.1.2.16.1.2.1.4 | | A description of the port on the LLDP neighbor. |
| sysLldpNeighborsTablePortId- 1.3.6.1.4.1.3375.2.1.2.16.1.2.1.2 | | The port ID of the LLDP neighbor. |
| sysLldpNeighborsTableSysName- 1.3.6.1.4.1.3375.2.1.2.16.1.2.1.5 | | The system name of the LLDP neighbor. |
sysMultiHostCpuTable
| OID Name | Selector Queryable | Description |
|---|
| sysMultiHostCpuUsageRatio5m- 1.3.6.1.4.1.3375.2.1.7.5.2.1.35 | cpu_util_raw, cpu_util_5min_raw | This is average usage ratio of CPU for the associated host in the last five minutes. It is calculated by � (sum of deltas for user, niced, system)/(sum of deltas of user, niced, system, idle, irq, softirq, and iowait),� where each delta is the difference for each stat over the last 5-minute interval;� user: sysMultiHostCpuUser5m;� niced: sysMultiHostCpuNiced5m;� stolen: sysMultiHostCpuStolen5m;� system: sysMultiHostCpuSystem5m;� idle: sysMultiHostCpuIdle5m;� irq: sysMultiHostCpuIrq5m;� iowait: sysMultiHostCpuIowait5m |
Back to Vendor TOC
Fortinet Proprietary MIB OIDs
FORTIGATE-MIB
fgDisks
| OID Name | Selector Queryable | Description |
|---|
| fgDiskName- 1.3.6.1.4.1.12356.101.4.10.2.1.2 | | The name of the storage. |
fgHaInfo
| OID Name | Selector Queryable | Description |
|---|
| fgHaSystemMode- 1.3.6.1.4.1.12356.101.13.1.1 | fortinet_ha_mode | High-availability mode (Standalone, A-A or A-P) |
fgHaStatsTable
| OID Name | Selector Queryable | Description |
|---|
| fgHaStatsHostname- 1.3.6.1.4.1.12356.101.13.2.1.1.11 | | Host name of the specified cluster member |
| fgHaStatsIndex- 1.3.6.1.4.1.12356.101.13.2.1.1.1 | | An index value that uniquely identifies an� unit in the HA Cluster |
| fgHaStatsSyncStatus- 1.3.6.1.4.1.12356.101.13.2.1.1.12 | fortinet_ha_sync_status | Current HA Sync status |
fgHwSensorTablee
| OID Name | Selector Queryable | Description |
|---|
| fgHwSensorEntAlarmStatus- 1.3.6.1.4.1.12356.101.4.3.2.1.4 | fortinet_env_alarm_status | If the sensor has an alarm threshold and has exceeded it, this will indicate its status. Not all sensors have alarms. |
| fgHwSensorEntIndex- 1.3.6.1.4.1.12356.101.4.3.2.1.1 | | A unique identifier within the fgHwSensorTable |
| fgHwSensorEntName- 1.3.6.1.4.1.12356.101.4.3.2.1.2 | | A string identifying the sensor by name |
| fgHwSensorEntValue- 1.3.6.1.4.1.12356.101.4.3.2.1.3 | fortinet_env_value | A string representation of the value of the sensor. Because sensors can present data in different formats, string representation is most general format. Interpretation of the value (units of measure, for example) is dependent on the individual sensor. |
fgLinkMonitorTable
| OID Name | Selector Queryable | Description |
|---|
| fgLinkMonitorBandwidthBi- 1.3.6.1.4.1.12356.101.4.8.2.1.12 | link_monitor_bw_bi | The available bandwidth in Mbps of bi-direction traffic detected by a link monitor on its interface. |
| fgLinkMonitorBandwidthIn- 1.3.6.1.4.1.12356.101.4.8.2.1.10 | link_monitor_bw_in | The available bandwidth in Mbps of incoming traffic detected by a link monitor on its interface. |
| fgLinkMonitorBandwidthOut- 1.3.6.1.4.1.12356.101.4.8.2.1.11 | link_monitor_bw_out | The available bandwidth in Mbps of outgoing traffic detected by a link monitor on its interface. |
| fgLinkMonitorID- 1.3.6.1.4.1.12356.101.4.8.2.1.1 | | Link Monitor ID. Only enabled link monitor entries are present in this table. Link Monitor IDs are only unique within a virtual domain. |
| fgLinkMonitorJitter- 1.3.6.1.4.1.12356.101.4.8.2.1.5 | link_monitor_jitter | The average jitter of link monitor in float number within last 30 probes. |
| fgLinkMonitorLatency- 1.3.6.1.4.1.12356.101.4.8.2.1.4 | link_monitor_latency | The average latency of link monitor in float number within last 30 probes. |
| fgLinkMonitorName- 1.3.6.1.4.1.12356.101.4.8.2.1.2 | | Link Monitor name. |
| fgLinkMonitorOutofSeq- 1.3.6.1.4.1.12356.101.4.8.2.1.13 | link_monitor_out_of_seq | The total number of out of sequence packets received. |
| fgLinkMonitorPacketLoss- 1.3.6.1.4.1.12356.101.4.8.2.1.8 | link_monitor_packet_loss | The average packet loss percentage in float number within last 30 probes. |
| fgLinkMonitorState- 1.3.6.1.4.1.12356.101.4.8.2.1.3 | link_monitor_state | Link Monitor state. |
| fgLinkMonitorVdom- 1.3.6.1.4.1.12356.101.4.8.2.1.9 | | Virtual domain the link monitor entry exists in. This name corresponds to the fgVdEntName used in fgVdTable. |
fgSystemInfo
| OID Name | Selector Queryable | Description |
|---|
| fgSysCpuUsage- 1.3.6.1.4.1.12356.101.4.1.3 | cpu_util_raw | Current CPU usage (percentage) |
| fgSysMemUsage- 1.3.6.1.4.1.12356.101.4.1.4 | memory_usage_fortinet | Current memory utilization (percentage) |
fgVWLHealthCheckLinkTable
| OID Name | Selector Queryable | Description |
|---|
| fgVWLHealthCheckLinkBandwidthBi- 1.3.6.1.4.1.12356.101.4.9.2.1.13 | sd_wan_bw_bi | The available bandwidth in Mbps of bi-direction traffic detected by a health-check on a specific member link. |
| fgVWLHealthCheckLinkBandwidthIn- 1.3.6.1.4.1.12356.101.4.9.2.1.11 | sd_wan_bw_in | The available bandwidth in Mbps of incoming traffic detected by a health-check on a specific member link. |
| fgVWLHealthCheckLinkBandwidthOut- 1.3.6.1.4.1.12356.101.4.9.2.1.12 | sd_wan_bw_out | The available bandwidth in Mbps of outgoing traffic detected by a health-check on a specific member link. |
| fgVWLHealthCheckLinkID- 1.3.6.1.4.1.12356.101.4.9.2.1.1 | | Virtual-wan-link health-check link ID. Only health-checks with configured member link are present in this table. Virtuwal-wan-link health check link IDs are only unique within a virtual domain. |
| fgVWLHealthCheckLinkJitter- 1.3.6.1.4.1.12356.101.4.9.2.1.6 | sd_wan_jitter | The average jitter of a health check on a specific member link in float number within last 30 probes. |
| fgVWLHealthCheckLinkLatency- 1.3.6.1.4.1.12356.101.4.9.2.1.5 | sd_wan_latency | The average latency of a health check on a specific member link in float number within last 30 probes. |
| fgVWLHealthCheckLinkName- 1.3.6.1.4.1.12356.101.4.9.2.1.2 | | Health check name. |
| fgVWLHealthCheckLinkPacketLoss- 1.3.6.1.4.1.12356.101.4.9.2.1.9 | sd_wan_packet_loss | The packet loss percentage of a health check on a specific member link in float number within last 30 probes. |
| fgVWLHealthCheckLinkState- 1.3.6.1.4.1.12356.101.4.9.2.1.4 | sd_wan_state | Heatlth check state on a specific member link. |
| fgVWLHealthCheckLinkVdom- 1.3.6.1.4.1.12356.101.4.9.2.1.10 | | Virtual domain the link monitor entry exists in. This name corresponds to the fgVdEntName used in fgVdTable. |
fgVdTable
| OID Name | Selector Queryable | Description |
|---|
| fgVdEntHaState- 1.3.6.1.4.1.12356.101.3.2.1.1.4 | | HA cluster member state of the virtual domain on this device� (master, backup or standalone) |
| fgVdEntIndex- 1.3.6.1.4.1.12356.101.3.2.1.1.1 | | Internal virtual domain index used to uniquely identify rows in this table. This index is also used by other tables referencing a virtual domain. |
| fgVdEntName- 1.3.6.1.4.1.12356.101.3.2.1.1.2 | | The name of the virtual domain |
| fgVdEntOpMode- 1.3.6.1.4.1.12356.101.3.2.1.1.3 | | Operation mode of the virtual domain (NAT or Transparent) |
fgVpnTunTable
| OID Name | Selector Queryable | Description |
|---|
| fgVpnTunEntInOctets- 1.3.6.1.4.1.12356.101.12.2.2.1.18 | phase1_tunnel_in_octets, if_in_octets | Number of bytes received on tunnel |
| fgVpnTunEntIndex- 1.3.6.1.4.1.12356.101.12.2.2.1.1 | | An index value that uniquely identifies� a VPN tunnel within the fgVpnTunTable |
| fgVpnTunEntLifeSecs- 1.3.6.1.4.1.12356.101.12.2.2.1.15 | phase1_tunnel_life_secs | Lifetime of tunnel in seconds, if time based lifetime used |
| fgVpnTunEntLocGwyIp- 1.3.6.1.4.1.12356.101.12.2.2.1.6 | | IP of local gateway used by the tunnel |
| fgVpnTunEntOutOctets- 1.3.6.1.4.1.12356.101.12.2.2.1.19 | phase1_tunnel_out_octets, if_out_octets | Number of bytes sent out on tunnel |
| fgVpnTunEntPhase1Name- 1.3.6.1.4.1.12356.101.12.2.2.1.2 | | Descriptive name of phase1 configuration for the tunnel |
| fgVpnTunEntPhase2Name- 1.3.6.1.4.1.12356.101.12.2.2.1.3 | | Descriptive name of phase2 configuration for the tunnel |
| fgVpnTunEntRemGwyIp- 1.3.6.1.4.1.12356.101.12.2.2.1.4 | | IP of remote gateway used by the tunnel |
| fgVpnTunEntStatus- 1.3.6.1.4.1.12356.101.12.2.2.1.20 | phase1_tunnel_status, if_oper_status, if_admin_status | Current status of tunnel (up or down) |
| fgVpnTunEntTimeout- 1.3.6.1.4.1.12356.101.12.2.2.1.17 | phase1_tunnel_timeout | Timeout of tunnel in seconds |
| fgVpnTunEntVdom- 1.3.6.1.4.1.12356.101.12.2.2.1.21 | | Virtual domain the tunnel is part of. This index corresponds to the index used by fgVdTable. |
Back to Vendor TOC
Infoblox Proprietary MIB OIDs
Infoblox-DHCPONE-MIB
ibDHCPSubnetTable
| OID Name | Selector Queryable | Description |
|---|
| ibDHCPSubnetNetworkAddress- 1.3.6.1.4.1.7779.3.1.1.4.1.1.1.1 | | DHCP Subnet in IpAddress format. A subnetwork may have many � ranges for lease. |
| ibDHCPSubnetNetworkMask- 1.3.6.1.4.1.7779.3.1.1.4.1.1.1.2 | | DHCP Subnet mask in IpAddress format. |
| ibDHCPSubnetPercentUsed- 1.3.6.1.4.1.7779.3.1.1.4.1.1.1.3 | dhcp_subnet_util | Percentage of dynamic DHCP address for subnet leased out at this � time. Fixed addresses are always counted as leased for this� calcuation if the fixed addresses are within ranges of leases. |
ibMemberNodeServiceStatusTable
| OID Name | Selector Queryable | Description |
|---|
| ibNode1ServiceDesc- 1.3.6.1.4.1.7779.3.1.1.2.1.10.1.3 | ib_entity_temp | Service Description. |
| ibNode1ServiceName- 1.3.6.1.4.1.7779.3.1.1.2.1.10.1.1 | pan_ha_mode, pan_ha_peer_state, pan_ha_state | Service Name. |
| ibNode1ServiceStatus- 1.3.6.1.4.1.7779.3.1.1.2.1.10.1.2 | vip_addr_avail_state, vip_addr_enabled_state | Service Status. |
Back to Vendor TOC
Juniper proprietary MIBs
JUNIPER-DOM-MIB
jnxDomCurrentTable
| OID Name | Selector Queryable | Description |
|---|
| jnxDomCurrentModuleLaneCount- 1.3.6.1.4.1.2636.3.60.1.1.1.1.30 | transceiver_lane_count_raw | Number of Lanes (Lasers) in this module |
| jnxDomCurrentModuleTemperature- 1.3.6.1.4.1.2636.3.60.1.1.1.1.8 | transceiver_temperature_raw, transceiver_temperature_high_warning_threshold_raw | Module temperature. |
| jnxDomCurrentModuleTemperatureHighAlarmThreshold- 1.3.6.1.4.1.2636.3.60.1.1.1.1.21 | | Module temperature high alarm threshold. |
| jnxDomCurrentModuleTemperatureHighWarningThreshold- 1.3.6.1.4.1.2636.3.60.1.1.1.1.23 | transceiver_temperature_high_warning_threshold_raw | Module temperature high warning threshold. |
| jnxDomCurrentModuleTemperatureLowAlarmThreshold- 1.3.6.1.4.1.2636.3.60.1.1.1.1.22 | | Module temperature low alarm threshold. |
| jnxDomCurrentModuleTemperatureLowWarningThreshold- 1.3.6.1.4.1.2636.3.60.1.1.1.1.24 | | Module temperature low warning threshold. |
| jnxDomCurrentModuleVoltage- 1.3.6.1.4.1.2636.3.60.1.1.1.1.25 | | Module voltage. |
| jnxDomCurrentModuleVoltageHighAlarmThreshold- 1.3.6.1.4.1.2636.3.60.1.1.1.1.26 | | Module voltage high alarm threshold. |
| jnxDomCurrentModuleVoltageHighWarningThreshold- 1.3.6.1.4.1.2636.3.60.1.1.1.1.28 | | Module voltage high warning threshold. |
| jnxDomCurrentModuleVoltageLowAlarmThreshold- 1.3.6.1.4.1.2636.3.60.1.1.1.1.27 | | Module voltage low alarm threshold. |
| jnxDomCurrentModuleVoltageLowWarningThreshold- 1.3.6.1.4.1.2636.3.60.1.1.1.1.29 | | Module voltage low warning threshold. |
| jnxDomCurrentRxLaserPower-1.3.6.1.4.1.2636.3.60.1.1.1.1.5 | transceiver_rx_laser_power_raw, transceiver_rx_laser_power_low_alarm_threshold_raw | Receiver laser power. |
| jnxDomCurrentRxLaserPowerHighAlarmThreshold- 1.3.6.1.4.1.2636.3.60.1.1.1.1.9 | | Receiver laser power high alarm threshold. |
| jnxDomCurrentRxLaserPowerHighWarningThreshold- 1.3.6.1.4.1.2636.3.60.1.1.1.1.11 | | Receiver laser power high warning threshold. |
| jnxDomCurrentRxLaserPowerLowAlarmThreshold- 1.3.6.1.4.1.2636.3.60.1.1.1.1.10 | transceiver_rx_laser_power_low_alarm_threshold_raw | Receiver laser power low alarm threshold. |
| jnxDomCurrentRxLaserPowerLowWarningThreshold- 1.3.6.1.4.1.2636.3.60.1.1.1.1.12 | | Receiver laser power low warning threshold. |
| jnxDomCurrentTxLaserBiasCurrent- 1.3.6.1.4.1.2636.3.60.1.1.1.1.6 | | Transmitter laser bias current. |
| jnxDomCurrentTxLaserBiasCurrentHighAlarmThreshold- 1.3.6.1.4.1.2636.3.60.1.1.1.1.13 | | Transmitter laser bias current high alarm threshold. |
| jnxDomCurrentTxLaserBiasCurrentHighWarningThreshold- 1.3.6.1.4.1.2636.3.60.1.1.1.1.15 | | Transmitter laser bias current high warning threshold. |
| jnxDomCurrentTxLaserBiasCurrentLowAlarmThreshold- 1.3.6.1.4.1.2636.3.60.1.1.1.1.14 | | Transmitter laser bias current low alarm threshold. |
| jnxDomCurrentTxLaserBiasCurrentLowWarningThreshold- 1.3.6.1.4.1.2636.3.60.1.1.1.1.16 | | Transmitter laser bias current low warning threshold. |
| jnxDomCurrentTxLaserOutputPower- 1.3.6.1.4.1.2636.3.60.1.1.1.1.7 | transceiver_tx_laser_power_raw, transceiver_tx_laser_power_low_alarm_threshold_raw | Transmitter laser output power. |
| jnxDomCurrentTxLaserOutputPowerHighAlarmThreshold- 1.3.6.1.4.1.2636.3.60.1.1.1.1.17 | | Transmitter laser power high alarm threshold. |
| jnxDomCurrentTxLaserOutputPowerHighWarningThreshold- 1.3.6.1.4.1.2636.3.60.1.1.1.1.19 | | Transmitter laser power high warning threshold. |
| jnxDomCurrentTxLaserOutputPowerLowAlarmThreshold- 1.3.6.1.4.1.2636.3.60.1.1.1.1.18 | transceiver_tx_laser_power_low_alarm_threshold_raw | Transmitter laser power low alarm threshold. |
| jnxDomCurrentTxLaserOutputPowerLowWarningThreshold- 1.3.6.1.4.1.2636.3.60.1.1.1.1.20 | | Transmitter laser power low warning threshold. |
JUNIPER-MIB
jnxOperatingState
| OID Name | Selector Queryable | Description |
|---|
| jnxOperatingState- 1.3.6.1.4.1.2636.3.1.13.1.6 | jnpr_operating_state | The operating state of this subject. |
jnxOperatingTable
| OID Name | Selector Queryable | Description |
|---|
| jnxOperating5MinLoadAvg- 1.3.6.1.4.1.2636.3.1.13.1.21 | cpu_util_5min_raw | The CPU Load Average over the last 5 minutes� Here it will be shown as percentage value� Zero if unavailable or inapplicable. |
| jnxOperatingBuffer- 1.3.6.1.4.1.2636.3.1.13.1.11 | jnpr_mem_usage_raw | The buffer pool utilization in percentage� of this subject. Zero if unavailable or � inapplicable. |
| jnxOperatingCPU- 1.3.6.1.4.1.2636.3.1.13.1.8 | cpu_util_raw | The CPU utilization in percentage of this � subject. Zero if unavailable or inapplicable. |
| jnxOperatingDescr- 1.3.6.1.4.1.2636.3.1.13.1.5 | | The name or detailed description of this subject. |
Back to Vendor TOC
Palo Alto Proprietary MIBs
PAN-COMMON-MIB
panGlobalProtect
| OID Name | Selector Queryable | Description |
|---|
| panGPGWUtilizationActiveTunnels- 1.3.6.1.4.1.25461.2.1.2.5.1.3 | pan_gpgw_utilization_active_tunnels | Number of active tunnels |
| panGPGWUtilizationMaxTunnels- 1.3.6.1.4.1.25461.2.1.2.5.1.2 | pan_gpgw_utilization_max_tunnels | Max tunnels allowed |
| panGPGWUtilizationPct-1.3.6.1.4.1.25461.2.1.2.5.1.1 | pan_gpgw_utilization_pct | GlobalProtect Gateway utilization percentage |
panSession
| OID Name | Selector Queryable | Description |
|---|
| panSessionActive- 1.3.6.1.4.1.25461.2.1.2.3.3 | pan_session_active, pan_session_active_icmp, pan_session_active_tcp, pan_session_active_udp, pan_session_active_ssl_proxy | Total number of active sessions. |
| panSessionActiveICMP- 1.3.6.1.4.1.25461.2.1.2.3.6 | pan_session_active_icmp | Total number of active ICMP sessions. |
| panSessionActiveSslProxy- 1.3.6.1.4.1.25461.2.1.2.3.7 | pan_session_active_ssl_proxy | Total number of active SSL proxy sessions. |
| panSessionActiveTcp- 1.3.6.1.4.1.25461.2.1.2.3.4 | pan_session_active_tcp | Total number of active TCP sessions. |
| panSessionActiveUdp- 1.3.6.1.4.1.25461.2.1.2.3.5 | pan_session_active_udp | Total number of active UDP sessions. |
| panSessionMax- 1.3.6.1.4.1.25461.2.1.2.3.2 | pan_session_max | Total number of sessions supported. |
| panSessionSslProxyUtilization- 1.3.6.1.4.1.25461.2.1.2.3.8 | pan_session_ssl_proxy_utilization | SSL proxy Session utilization percentage. Values should� be between 0 and 100. |
| panSessionUtilization- 1.3.6.1.4.1.25461.2.1.2.3.1 | pan_session_utilization | Session table utilization percentage. Values should� be between 0 and 100. |
panSysHaMode
| OID Name | Selector Queryable | Description |
|---|
| panSysHAMode- 1.3.6.1.4.1.25461.2.1.2.1.13 | pan_ha_mode | Current high-availability mode (disabled, � active-passive, or active-active). |
| panSysHAPeerState- 1.3.6.1.4.1.25461.2.1.2.1.12 | pan_ha_peer_state | Current peer high-availability state. |
| panSysHAState- 1.3.6.1.4.1.25461.2.1.2.1.11 | pan_ha_state | Current high-availability state. |
panVsysTable
| OID Name | Selector Queryable | Description |
|---|
| panVsysActiveSessions- 1.3.6.1.4.1.25461.2.1.2.3.9.1.4 | pan_vsys_session_active | Active sessions on this Vsys |
| panVsysId- 1.3.6.1.4.1.25461.2.1.2.3.9.1.1 | | Vsys id |
| panVsysMaxSessions- 1.3.6.1.4.1.25461.2.1.2.3.9.1.5 | pan_vsys_session_max | Max sessions on this Vsys, if session limit is configured.� If session limit is not configured, this value is ‘0’ |
| panVsysName- 1.3.6.1.4.1.25461.2.1.2.3.9.1.2 | | User assigned vsys name (empty string if not available) |
| panVsysSessionUtilizationPct- 1.3.6.1.4.1.25461.2.1.2.3.9.1.3 | pan_vsys_session_utilization_pct | Vsys utilization percentage, if session limit is configured.� If session limit is not configured, this value is ‘0’ |
Back to Vendor TOC
Synoptics
S5-CHASSIS-MIB
s5ChasCom
| OID Name | Selector Queryable | Description |
|---|
| s5ChasComOperState- .1.3.6.1.4.1.45.1.6.3.3.1.1.10 | | The current operational state of the� component. The possible values are:� other(1)………some other state� notAvail(2)……state not available� removed(3)…….component removed� disabled(4)……operation disabled� normal(5)……..normal operation� resetInProg(6)…reset in progress� testing(7)…….doing a self test� warning(8)…….operating at warning level� nonFatalErr(9)…operating at error level� fatalErr(10)…..error stopped operation� notConfig(11)….module needs to be configured� obsoleted(12)…module is obsoleted but in the chassis� The allowable (and meaningful) values� are determined by the component type. |
s5ChasUtilTable
| OID Name | Selector Queryable | Description |
|---|
| s5ChasUtilMemoryAvailableMB- 1.3.6.1.4.1.45.1.6.3.8.1.1.13 | memory_available_extreme | This object returns the available RAM of unit. |
| s5ChasUtilMemoryTotalMB- 1.3.6.1.4.1.45.1.6.3.8.1.1.12 | memory_total_extreme | This object returns the total RAM of unit. |
Back to Vendor TOC
3 - Connecting to the Selector MCP Server
Overview
Selector supports Model Context Protocol (MCP) Server functionality to allow any MCP Client to interact with Selector to access supported APIs and tools. This guide provides step-by-step instructions for setting up MCP Clients to connect to the Selector’s MCP Server.
The Model Context Protocol (MCP) establishes rules for how an AI agent can find, connect to, and use external tools – whether it’s querying a database or running a command. This lets AI models go beyond their training data, which makes the AI more flexible and aware of the world around them.
MCP classifies AI entities into three main categories:
- Hosts: LLM applications that initiate connections.
- Clients: Connectors within the host application.
- Servers: Services that provide context and capabilities.
MCP uses standard JSON-RPC 2.0 messages to communicate between these three types of AI entities.
There are three major steps to setting up MCP for connectivity:
- Obtain a Selector API Key
- Configure the MCP Client
- Verify the MCP Connection
Prerequisites
Before beginning the MCP setup process, you must have the following prerequisites:
- A functioning MCP client (for example, Claude Desktop, Cursor, VSCode, and so on)
- Access to the Selector S2AP software. Selector MCP Server is built into Selector’s S2AP
- A valid Selector API key with appropriate permissions
Step 1: Obtain Your Selector API Key
Log in to Selector S2AP
- Navigate to your Selector S2AP instance (<customer-tenant-name>.selector.ai)
- Sign in with your credentials
Access the API Keys Section of S2AP. To do so:
- Click on your profile icon in the top right corner
- Select My API keys from the dropdown menu
Create a New API Key for MCP
- Click on Add new button
- Fill in the following fields:
- Name: Give your API key a descriptive name (such as “MCP Key”)
- Active: Ensure the checkbox is checked to make the key active
- Roles: Select a role from the dropdown list of valid entries
- Key valid until: Set the expiration date (default is one month from creation)
Generate and Save the Key
- Click the Add API key button
- IMPORTANT: Copy and save the generated API key immediately. You won’t be able to see it again!
- The key will look something like: qanMtokenxikKeBr0F
Selector MCP Details:
- Selector MCP is a Streamable HTTP Remote Server (not SSE)
- URL: https://<customer-tenant-name>.selector.ai/mcp/
- Auth Header Required
- Auth Header should follow format “Authorization”: “YOUR_API_KEY_HERE”
Client Specific Documentation
- Cursor
- VSCode (using mcp.json)
- Gemini CLI
- Claude Code
- Claude Desktop (NOT OFFICIAL DOCUMENTATION)
Some Helpful MCP Client Specific Tips: Please note that these helpful tips are offered here to help you adopt MCP technology faster. Please refer to vendor documentation for more specific details.
- For Cursor, there is a menu in settings for MCPs (or edit the .cursor/mcp.json file)
- For VSCode, there is a command palette entry for adding MCP servers (or also a .vscode/mcp.json file)
- >MCP: Add Server
NOTE: The > sign (Ctrl+Shift+P) is used to find any show or run commands in the VS Code command palette.
- For Gemini CLI, use the settings.json file to add MCPs
- The Selector MCP is very similar to the Github example in the linked documentation above. You will use the “httpUrl” and “headers” keys.
- For Claude Code, you can do this with a command:
- claude mcp add --transport http <name> <url> --header “Authorization: \ Bearer YOUR_API_KEY_HERE”
- For Claude Desktop, in the settings, go to Developer and click Edit Config. This opens the claude_desktop_config.json file. Remote MCP with Bearer token is not technically supported natively. For this, we can use “mcp-remote” like so:
`{`
  `"mcpServers": {`
    `"selector": {`
      `"command": "npx",`
      `"args": [`
        `"mcp-remote",`
        `"https://<customer-tenant-name>.selector.ai/mcp/",`
        `"--header",`
        `"Authorization: Bearer YOUR_API_KEY_HERE"`
      `],`
      `"env": {}`
    `}`
  `}`
`}
- An example of the mcp.json file in Cursor or VSCode:
`{`
 `"mcpServers": {`
   `"Selector MCP": {`
     `"url": "https://<customer-tenant-name>.selector.ai/mcp/",`
     `"headers": {`
       `"Authorization": "Bearer YOUR_API_KEY_HERE"`
     `}`
   `}`
 `}`
`}`
Important Notes for Step 2:
- Replace YOUR_API_KEY_HERE with the API key you generated in Step 1
- Replace <customer-tenant-name>.selector.ai with your actual Selector instance URL
- Make sure the url ends with /mcp/ (the trailing / is necessary)
- Ensure the JSON syntax is valid (that is uses proper quotes, commas, etc.)
- Save and Start (Restart)
- Save the configuration file
- Start (Restart)
- In some cases, another restart may be required
Step 3: Verify the Connection
- echo
- ask_selector
- query_selector
- get_image_for_nl_query
- list_maintwindows
- create_maintwindow
- get_maintwindow_by_name
- update_maintwindow
- delete_maintwindow_by_name
- get_selector_phrases
To get a detailed list of the tools, ask for the available tools from Selector MCP.
4 - Analytics & Queries
4.1 - System Analytics
Selector System Analytics
WAN Analytics
The network may face performance degradations for a variety of reasons. The issue could be intermittent or there could be an outage. While it’s important to monitor the WAN metrics to predict performance degradations, it is also important to identify the issues based on multiple data sources. Errors such as port errors/discards are seen over SNMP, but other events such as system reboots are conveyed by syslogs. Consolidating all the data sources to identify the health of a device is crucial.
Selector can gather events and information from various “virtual edge” sources, whether over the Internet, from wireless portions such as LTE, or tunneled portions using MPLS.
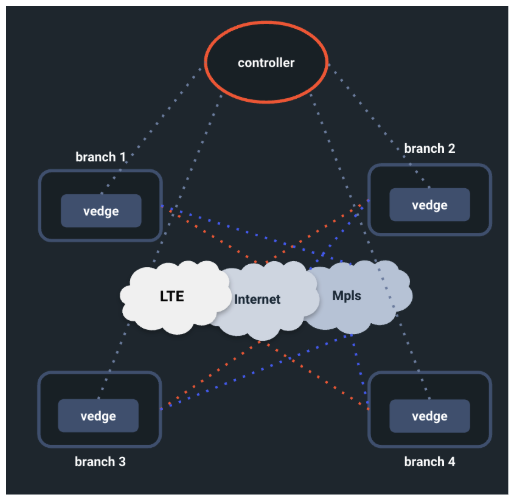
The Selector POC considers the following data sources for WAN analytics:
| Data Source | Type of Ingest |
|---|
| Vmanage | API (Rest Poller) |
| Syslogs | Direct syslogs over udp/514 |
| Snmp | SNMP engine (60s poll interval) |
| Thousand eyes | API (Rest Poller) |
As part of the solution, the platform uses the following integrations:
- SNMP—This integration is based on SNMP OIDs. The polling frequency is tunable and currently set to 60 seconds by default. Adding a new OID is as simple as navigating to the integrations page and adding a new group to poll.
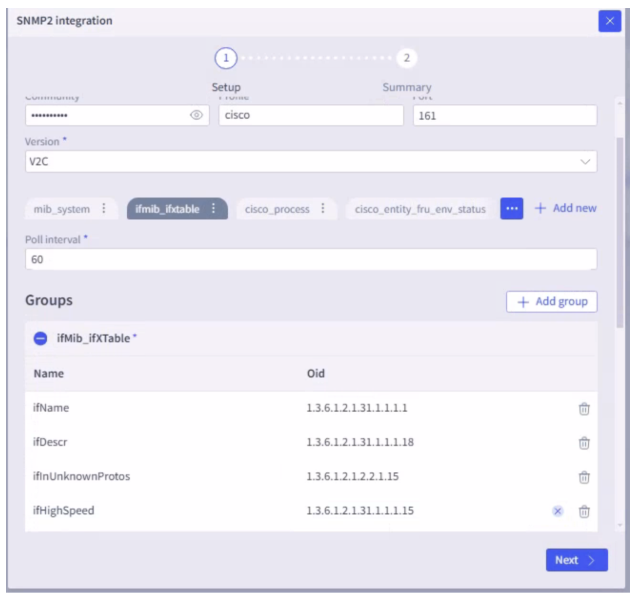
Various data points are collected, such as system, interface, CPU, memory, BGP, and so on.
- REST poller—The Selector platform has a rest poller integration for data sources that need to interact using rest APIs. The platform can perform GET and POST commands to process the raw data.
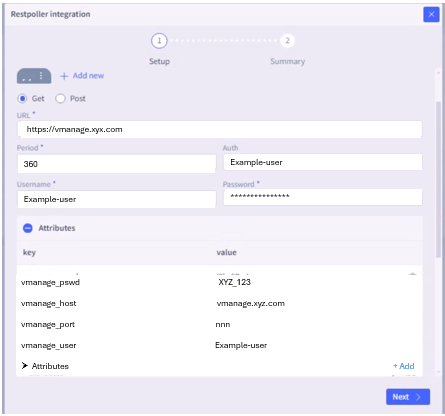
Other integrations are used to ingest vmanage and thousand eyes KPIs.
Inventory—Selector can have a configuration management database (CMDB) that is used to build an inventory of all the devices. The metastore2 integration helps to ingest static files provided with device name and latitude and longitude information used to display devices over a geographical map. Inventoried devices are polled by the SNMP engine to capture various metrics such as interface name, utilization, and so on. The table contains both WAN and wireless devices. If there are new fields that need to be ingested, the schema is modifiable. The Selector platform can collect configuration data through SSH or 3rd party integrations such as GIT, and track configuration changes, but the platform does not participate in configuration changes to the devices directly. Selector can also work with 3rd party configuration and automation platforms for configuration automations. Selector’s device-discovery capabilities enable customers to scan the network environment, identify devices, and populate Selector’s integrated CMDB.
Detected devices are matched to a device profile to enable the automated instrumentation and monitoring of those devices.CMDB inventory status fields indicate the state of each device, which can be factored into alerting and notification workflows.
As an open data platform, Selector readily integrates with data sources and downstream services and can integrate with CMDB or ERP platforms as required.
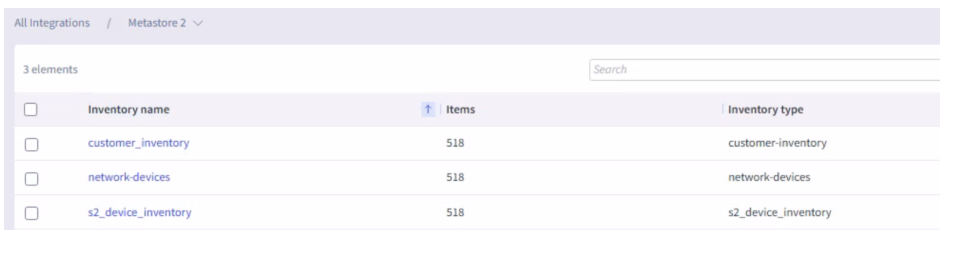
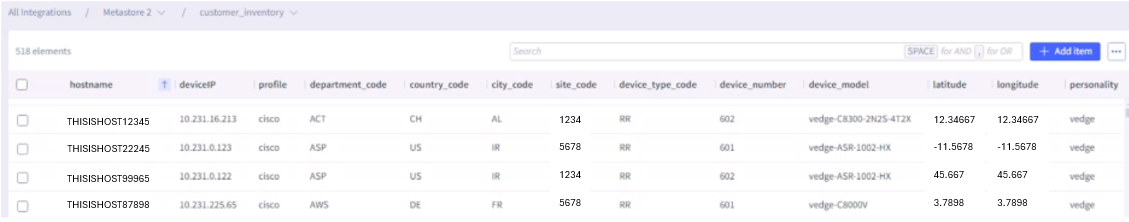
- Syslogs—Selector is capable of ingesting syslogs, as mentioned in the previous section. The syslogs can be mined for patterns and further used in correlations. The logs that are redirected to the platform on UPD port 514 are ingested. Raw logs are converted to events through a process of labeling. Both raw logs and labeled logs can be viewed. Selector further leverages a combination of AI and ML to analyze log messages, identifying patterns and anomalies related to the rate, severity and content of the logs. This capability automatically identifies anomalies and the context of those anomalies, enabling correlation, root cause analysis, and ticket consolidation.
Raw Logs View
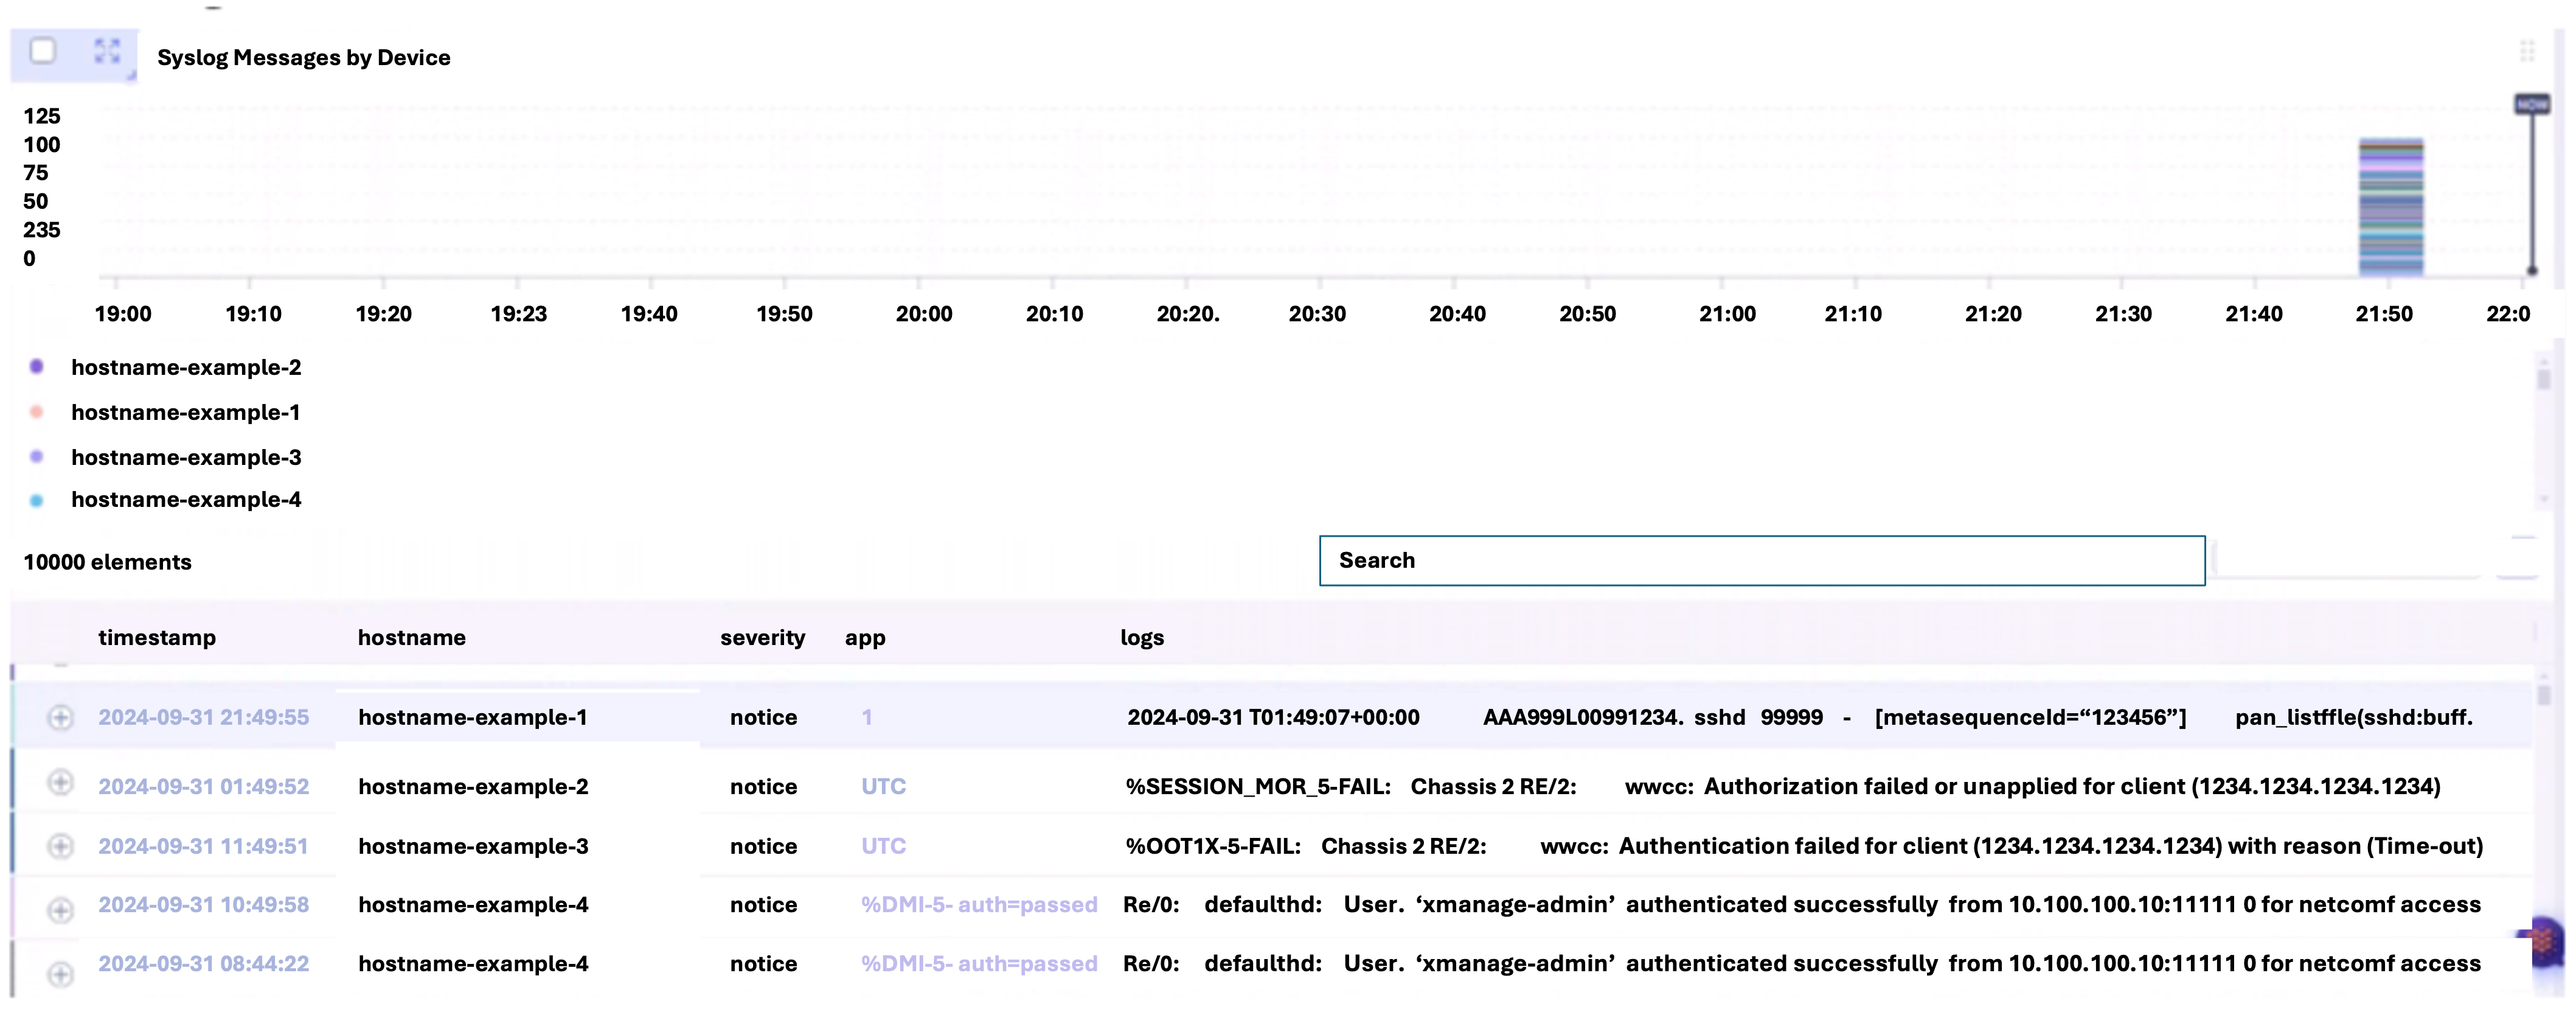
Device_event_ml Table
Labeled logs are continuously trained and a model is created for inference. Any newly generated logs matching the respective labeled pattern are automatically identified as an event which further powers the correlations from the data sources.
Additionally, if there are data sources needing to use a python-sdk, the Selector platform can handle as well. For netflow, the Selector platform has a netflow collector to process these packets.
Wireless Analytics
The Selector platform can ingest data from multiple sources. When part of a POC, the wireless analytics are derived from ingesting metrics from various data sources. Correlated events can be identified to gain insights related to clients connecting to access points (APs). The performance of the APs can be derived leveraging all the data from WLC, controllers and switches (soon). End-to-end correlation within a given site are based on contextual data and joining across switches and routers at the site.
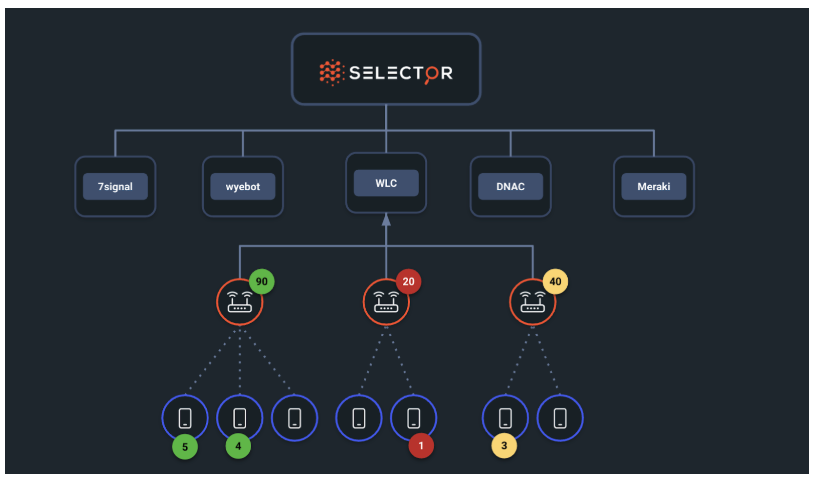
Selector considers the following data sources for wireless analytics:
| Data Source | Type of Ingest |
|---|
| Meraki | API |
| DNAC | API |
| Wyebot | API |
| WLC | SNMP, Syslog |
The Selector platform ingests these data sources as part of a wireless observability POC. The mechanisms are the same for WAN analytics.
In addition to ingestion, the process of generating device health, creating an aggregated health for the WLC, and correlating the events are the same for WAN analytics. From the Selector platform perspective, the key parameters are metrics and labels. These are used to display various dashboards and therefore the process remains the same.
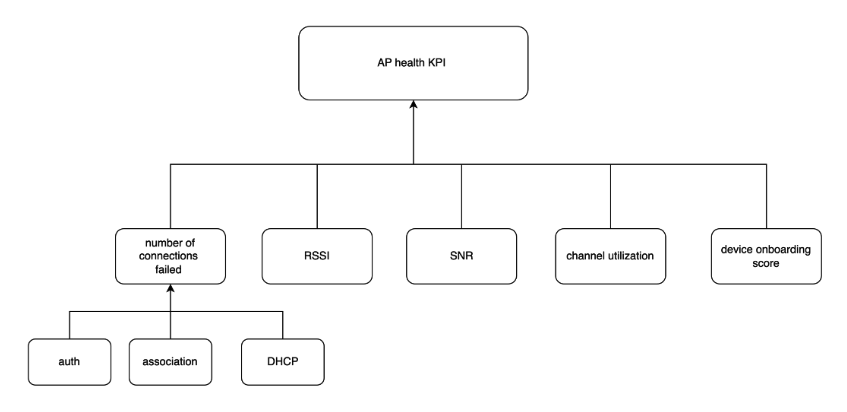
Representation of Meraki
Honeycombs are created for different data points, such as SNR, RSSI, Onboarding, and so forth. Violations are computed based on defined thresholds. The Selector platform can also add derived metrics such as channel switch identification, interface flaps, flap rate, and so on. This tracking is extensible if needed.
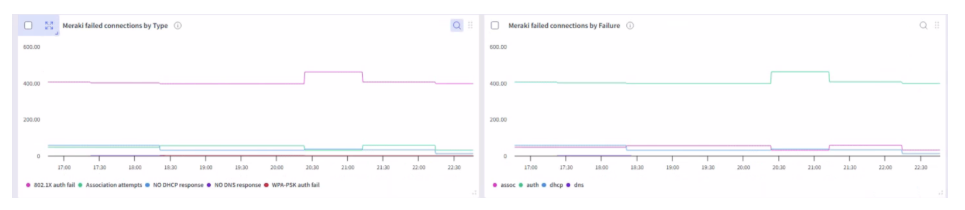
DNAC
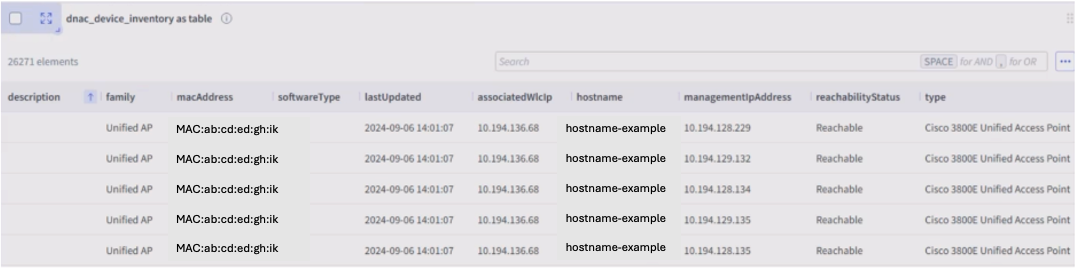
Wyebot
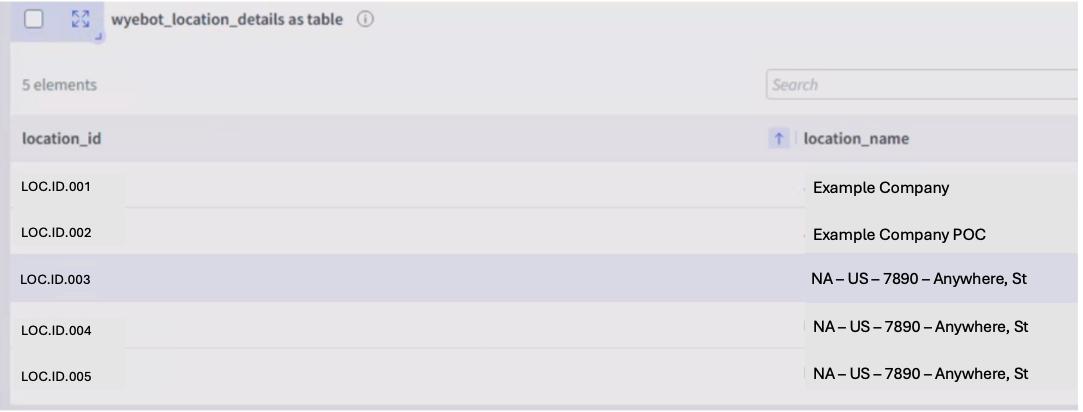
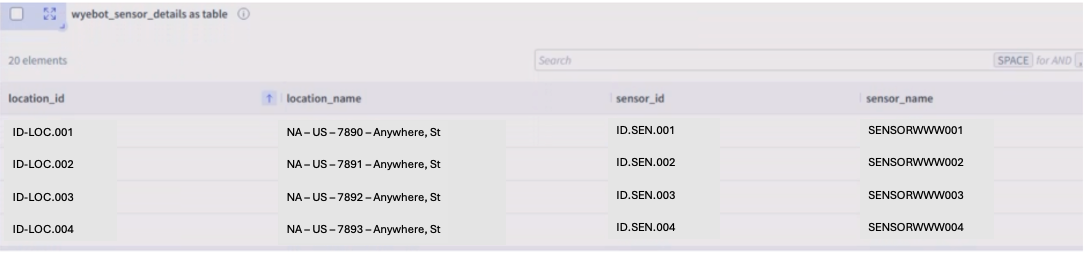
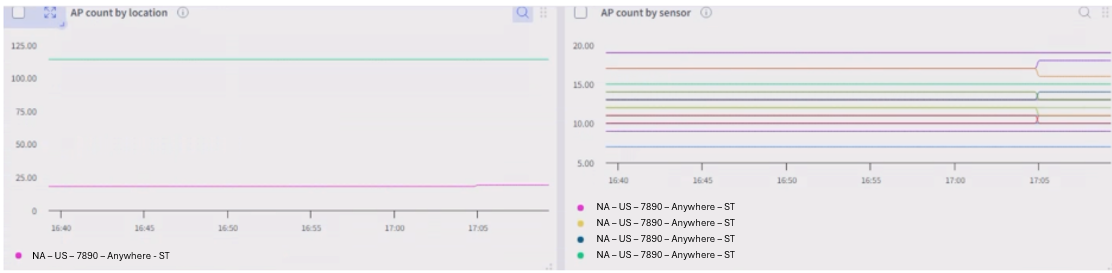
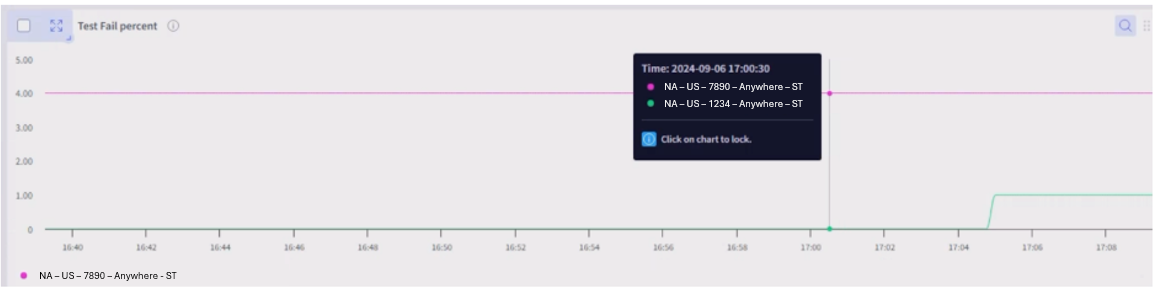
Correlations
Wireless correlation is the same as with the WAN analytics.
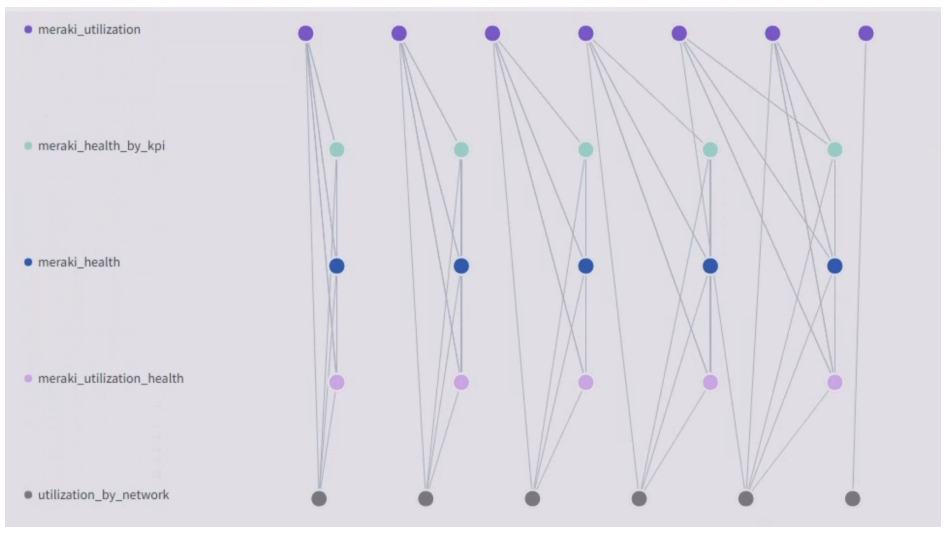
Health Report
The health report for a site is built based on multiple kpi violations. The report considers all devices associated with a site such as routers, switches, and so on. The violations help in “bubbling up” site health depending on the device and number of impacted devices.
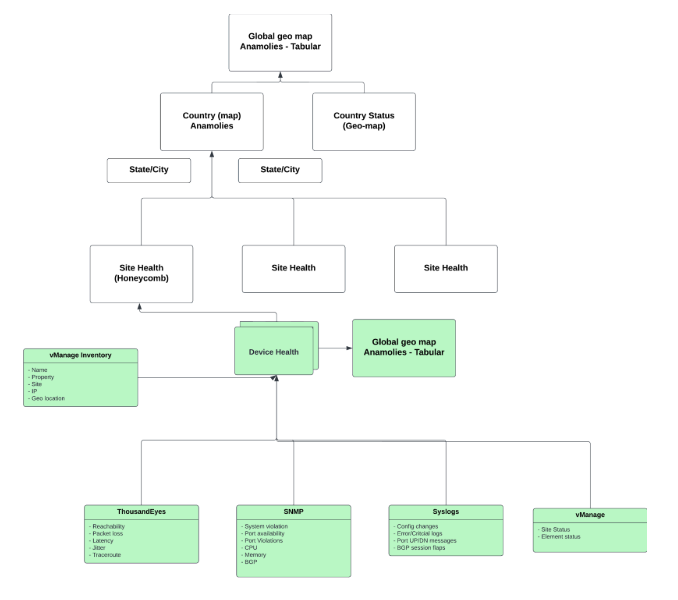
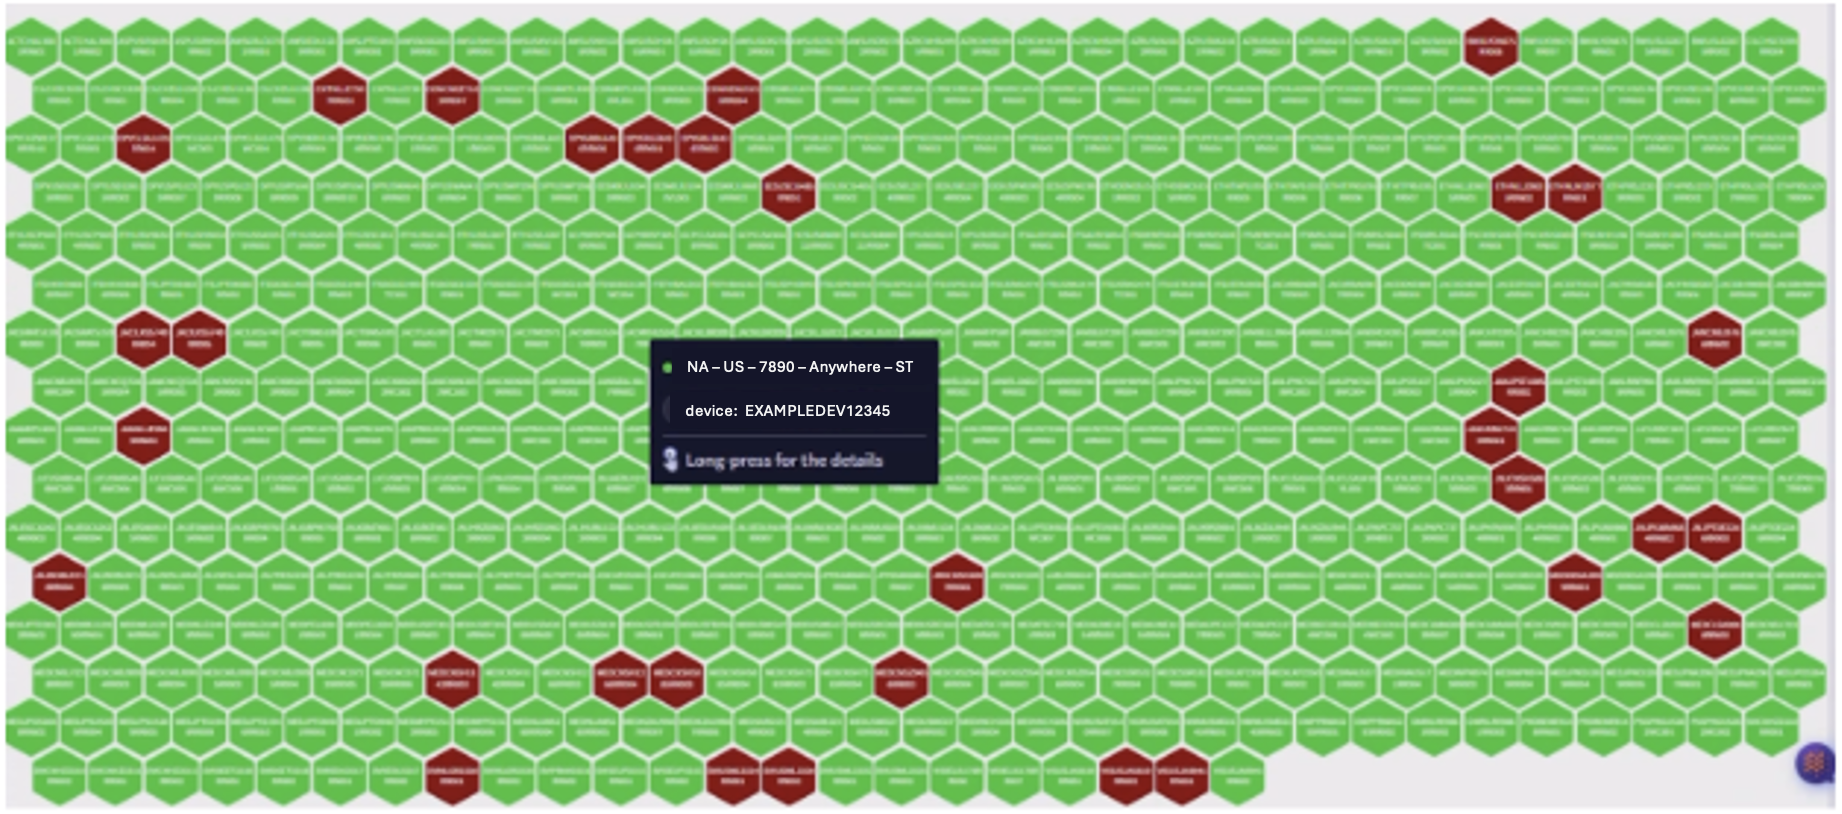
Each device can then be drilled down to reveal respective metrics and contributing KPIs for violations for behavior understanding.
Geographical maps are created to represent the devices or sites and to identify and show violations. Drill downs are created to allowing simpler user to query. For geographical maps to work, the latitude and longitude values need to be provided. These can come from inventory tables in vmanage or provided static files.
Site level views are created to easily navigate based on site ID instead of device name or region.
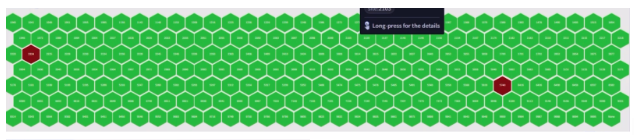
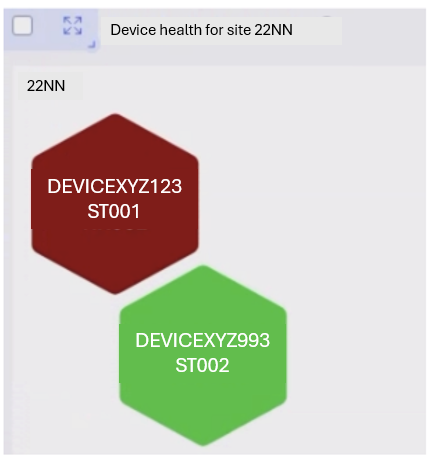
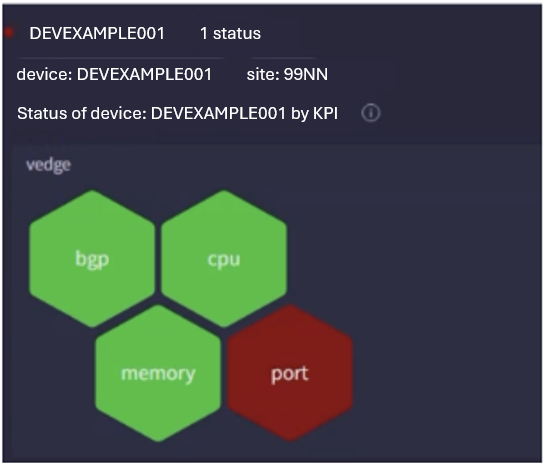
Long presses provide drill-down views on the same screen.
Report Generation and Exports
Users can generate automated reports on a monthly, weekly, or daily basis to generate network insights. These reports can be automated as emails as well, and the timeline is customizable. In addition, Selector can export data as either a PDF or in CSV format.

Topology Representation
The topology of a given site or across and between sites can be identified using. For example, LLDP and CDP data. These are obtained from SNMP and the topology is constructed based on identification of network nodes and edges.
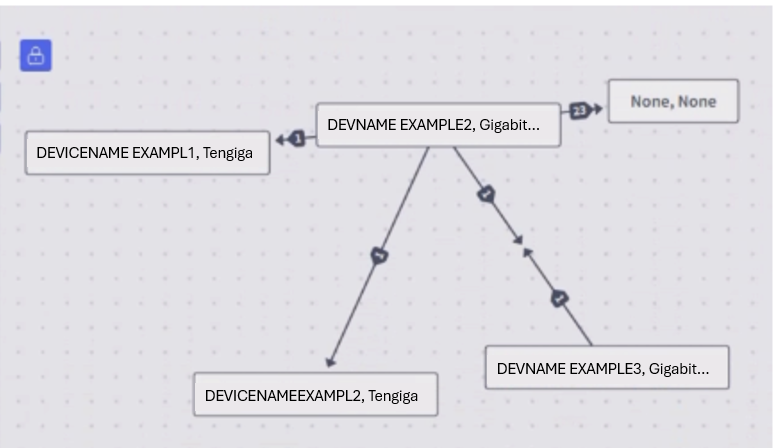
Selector can also overlay metrics and color code in addition to representation. Customized color code definitions are also possible.
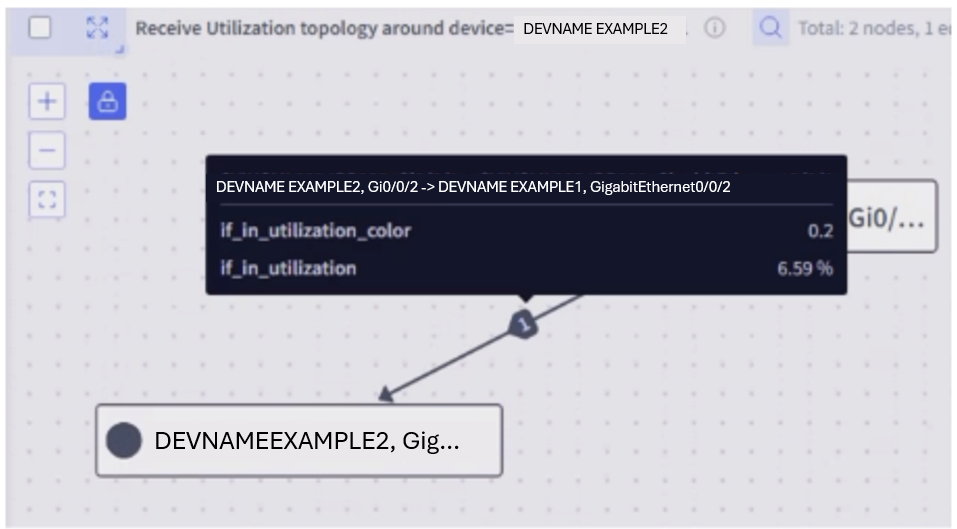
4.2 - S2QL User Guide
A guide for using Selector’s S2QL
Selector Software Query Language (S2QL) User Guide
Table of Contents
Introduction
Main Query Structure and Keywords
Fetching Data
Details On How to Fetch Data Relevant to Draw Insights
Data Rendering
Advanced Query Capabilities
Best Practices for Queryables
Supported Rendering Styles and Usage Examples
Introduction
This document provides a comprehensive guide to the Query Builder, a key tool on the Selector Platform designed for answering your questions about your network using efficient data retrieval and intuitive data visualization. This guide offers in-depth explanations of how S2QL works, its advanced techniques, as well as examples to help construct effective queries to get best insights from your data.
Back to TOC
Main Query Structure and Keywords
The Query Builder employs a structured syntax and a set of keywords to precisely define how data is fetched and displayed. This guide examines how to select data and then shows how to render the data effectively for the insights in the most intuitive manner. There are 2 overall steps: fetching data and data rendering.
Back to TOC
Fetching Data
Start by selecting the data you want to look at Any search involves the following four most important components:
1. Data Source: where to search for data (called Queryables).
2. Filter conditions : what specific data you need for network insights (the where clause).
3. Specific data attribute : attributes of the data user is interested in (the in clause).
4. Time Range: the time range to use for the query.
The Selector platform collects and maintains data for long time periods (data retention timelines are configurable). This allows the platform to use ML to learn from past observations and to predict future behavior. The platform also supports network DVR operations to allow users to examine network conditions at a specific period in the past using the Time Range filter in the Query.
The following figure shows how the S2QL Queryable combines the where clause, the in clause, the time range, and some other organizing keywords (show-by, group-by) to create a widget to link to a dashboard on the Selector platform. All of these aspects of the S2QL are detailed in this guide. Note that the Queryable can be built using the UI or by typing.
Back to TOC
Details On How to Fetch Data Relevant to Draw Insights
- Queryable (Data Source): A Queryable is one of the most important constructs of the Selector platform. ****The Queryable specifies the origin of the data being processed. This could be a metric from a time series database (stored in Prometheus), a table from inventory or events database (stored in MongoDB database), or enriched logs from Loki.
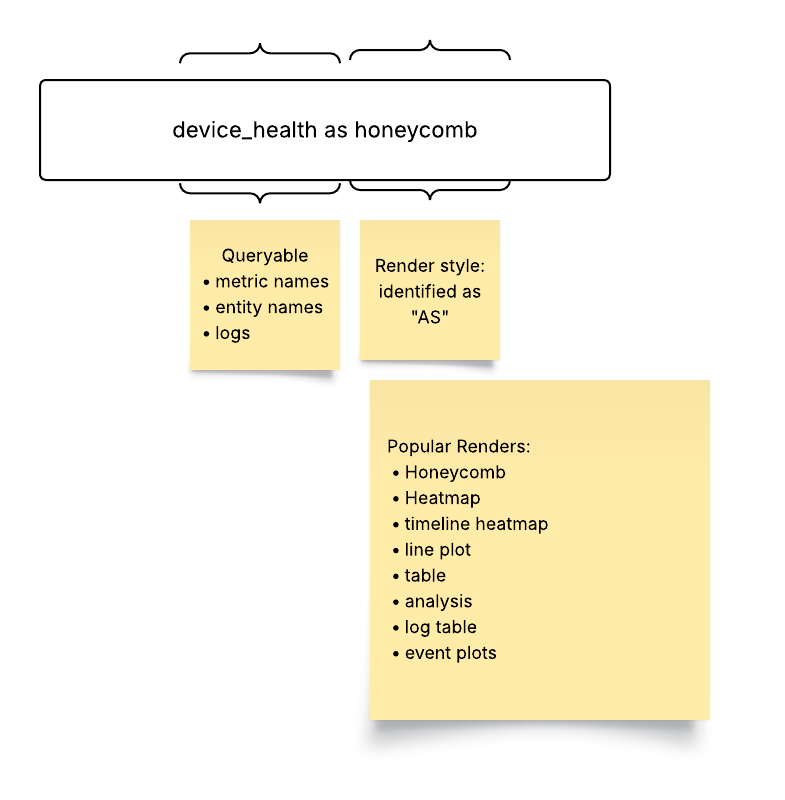
- Where (Filter condition) : The where keyword (UI filter group) applies filters to the query, narrowing down the data by matching specified conditions. The where clause utilizes key-value pairs, comparison operators, and logical operators to create precise filtering criteria.
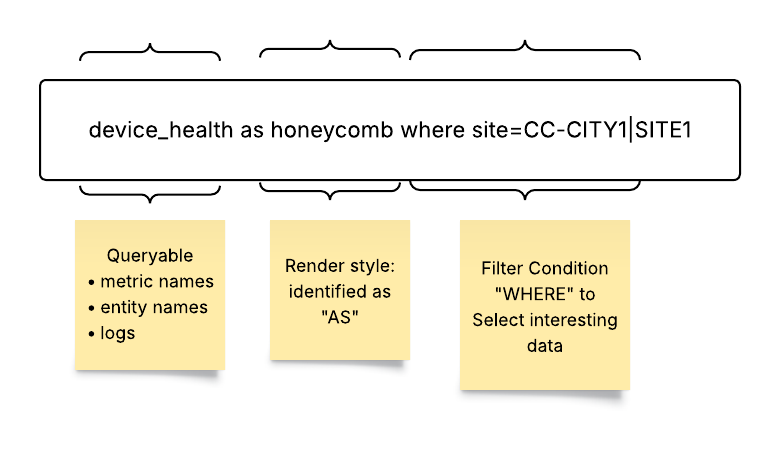
- In (Data Attributes): A Queryable points to a data source where enriched data resides in multiple attributes (or columns). To answer a specific question and to derive business insights, a user might want to select only specific attributes of the Queryable. The in keyword selects specific columns. Using attributes allows more targeted data retrieval, helping users to focus on the relevant aspects of the data to answer user questions and to generate insights.
Syntax and Examples:
site, device_type in (Selects the site and device_type columns from the Queryable)
response_time in (Selects the response_time column from the Queryable)
Note that if the in keyword is omitted, then all columns from the Queryable are retrieved and presented in table format.
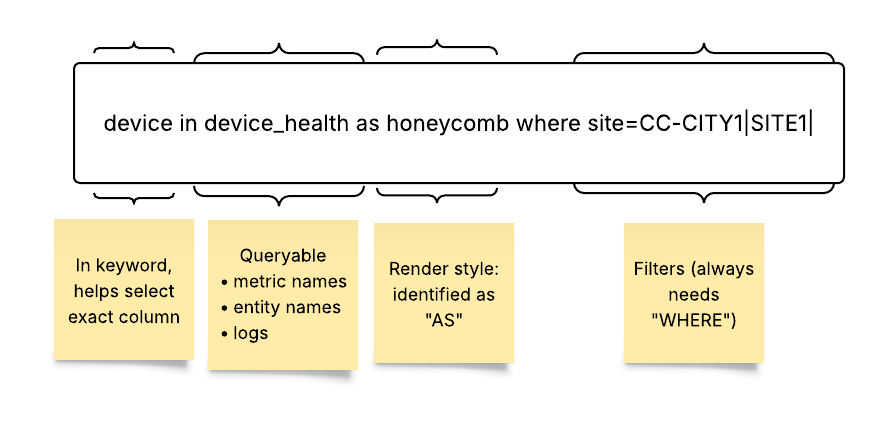
- Time (Time Range): The time keyword defines the time range for the query. The range allows for historical analysis, real-time monitoring, or future projections.
Data Rendering
After fetching the selected data, it is equally important to render it in the most intuitive user-friendly way. The Selector platform allows many data rendering options.
Drop down menus show the rendering styles available for each metric on Query Builder UI.
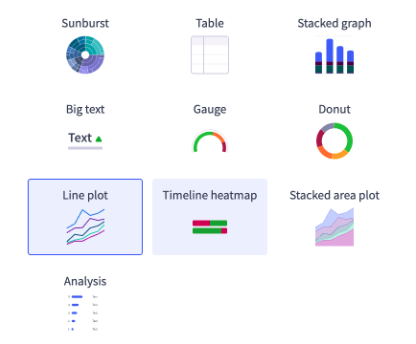
Drop down menus show the rendering styles available for each metric on Query Builder.

If you do not pick a rendering style, the S2QL picks what it thinks is the best way to render the data. All queries have a default rendering style. For example, an inventory database is always rendered as a simple table with rows and columns. You can render multiple Queryables on a line plot. For best results, limit the multiple queries to two or three at most.
Keywords for Selecting Render Types in Query Builder Bar:
- As: The as keyword (called renders in the UI) determines the visual representation of the queried data. The Query Builder supports a variety of render styles, each suited for different types of data and analysis. A complete list of all rendering options available on the platform is at the end of this chapter.
Syntax and Examples:
as Line Plot (Renders the data as a line plot)
as Table (Renders the data as a table)
as Honeycomb (Renders the data as a honeycomb)
Note that other available render styles include Heat Map, Timeline Map, Event Plot, Topology View, DOPO Map, Path, HTML Text, Big Text, Donut, and Sunburst. Some styles are not available in all Queryable data forms.
- Show-By: The show-by keyword is used to arrange and organize the visual elements (tiles or honeycombs) in the portal. It is particularly relevant for Honeycomb and Sunburst render styles.
Syntax and Examples:
- show-by site, device (Arranges the tiles or honeycombs by site, and then by device)
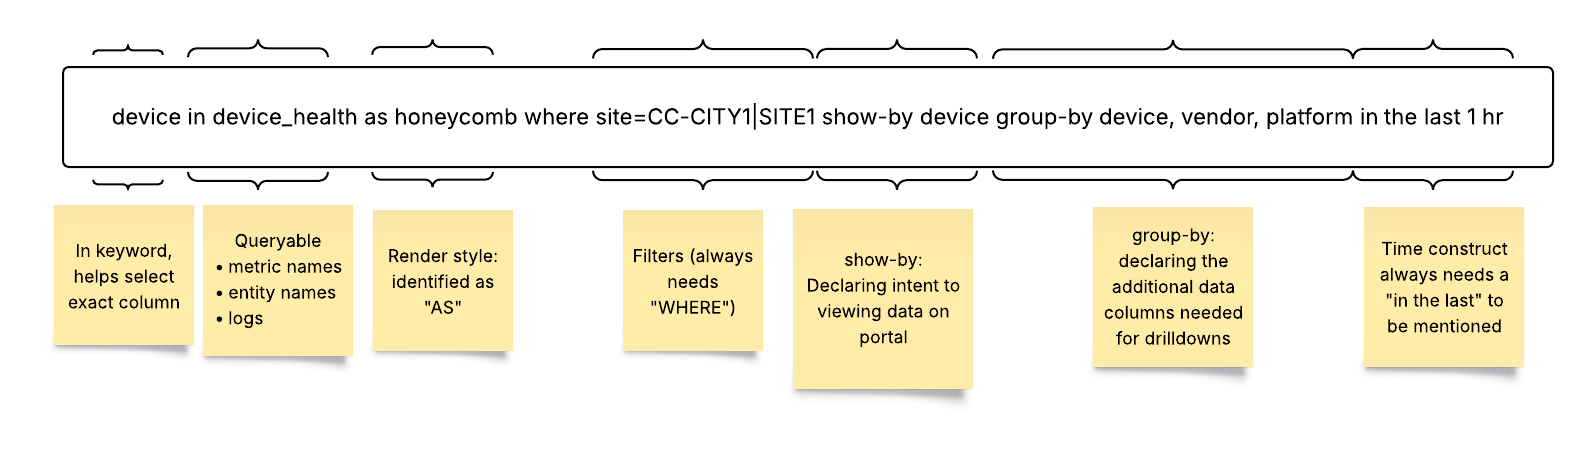
Back to TOC
Advanced Query Capabilities
- Order-By: The order-by keyword facilitates drill-down analysis by querying additional columns from the backend. While order-by doesn’t impact the initial visualization, it provides contextual information when users drill down into the data.
Syntax and Examples:
- order-by device_type, location (Groups the data by device type. and uses location for drill-down)
- Group-By: The group-by keyword facilitates drill-down analysis by querying additional columns from the backend. While group-by doesn’t impact the initial visualization, it provides contextual information when users drill down into the data.
Syntax and Examples:
- group-by device_type, location (Groups the data by device type and location for drill-down)
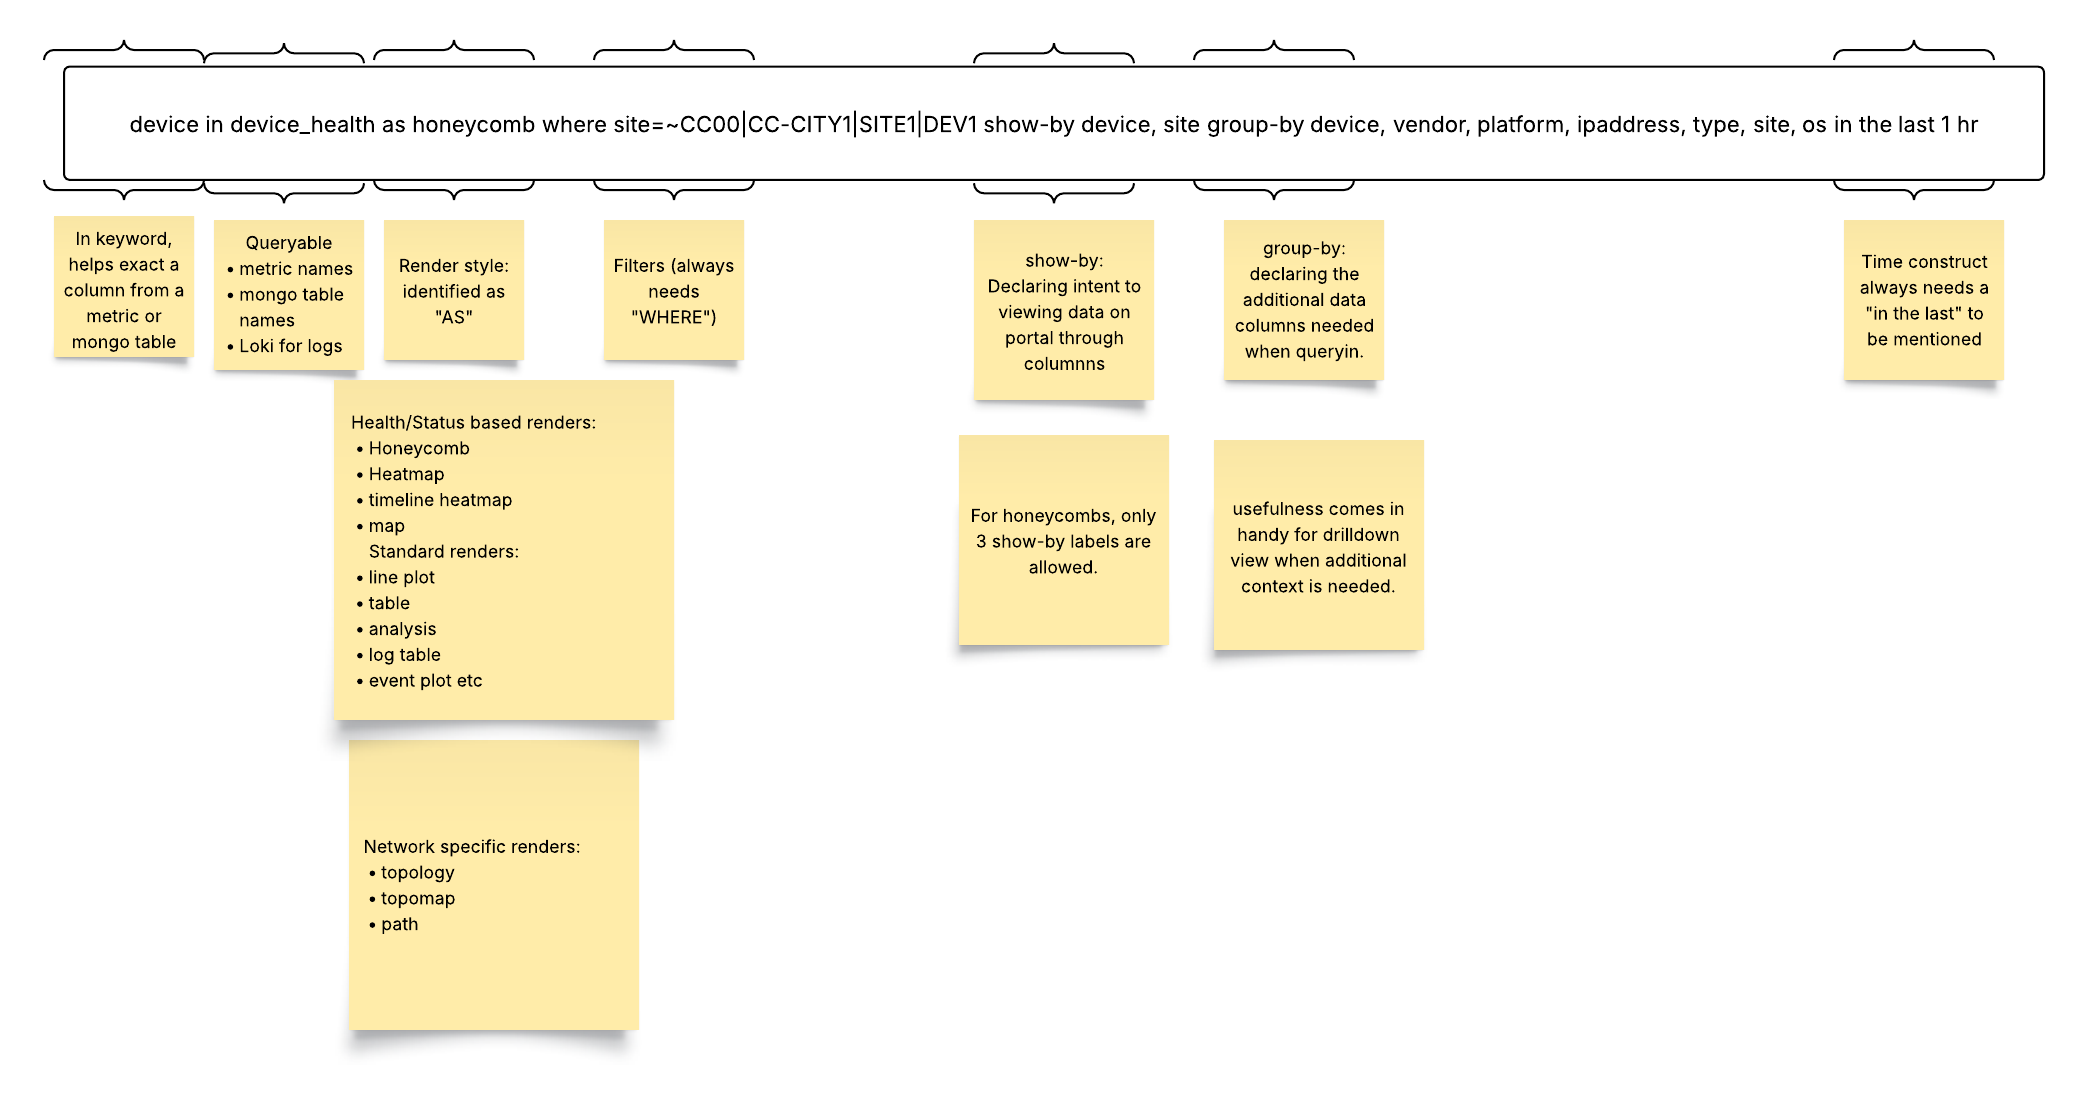
- Column Aliases: Column aliases allow assignment of user-friendly names to columns, enhancing the clarity and readability of the visualization.
Syntax and Examples:
device_health: Site Health (Assigns the alias Site Health to the device_health column)
Note that aliases have several important restrictions, as shown below:
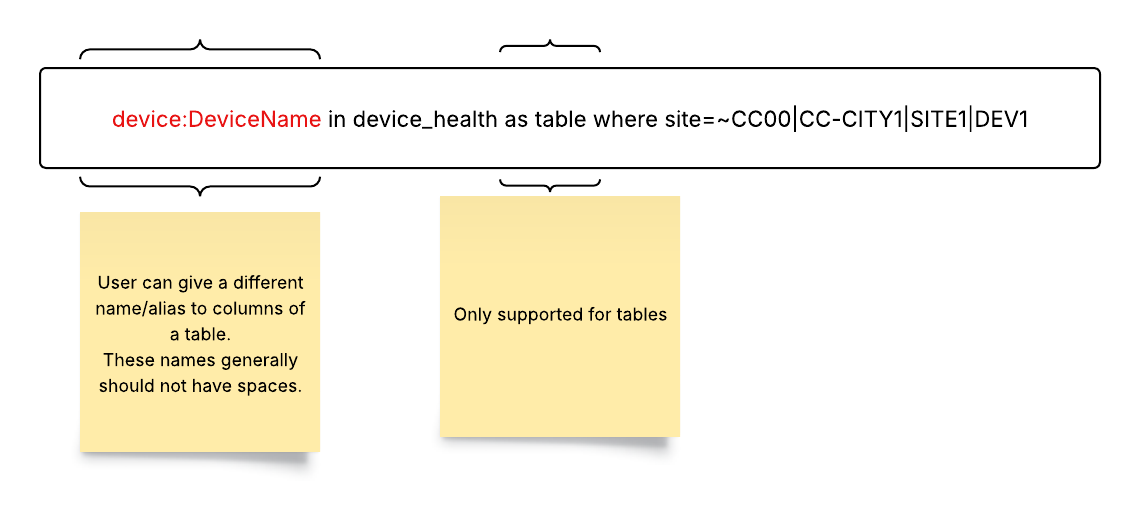
- Multi-Queryable: The Multi-Queryable feature enables the plotting of multiple metrics on a single line plot. It is exclusively supported for the Line Plot render style.
Syntax and Examples:
Queryable: Metric1 | Metric2 (Plots both Metric1 and Metric2 on the same line plot)
Note that the metrics must share the same set of labels or a similar family of labels for this feature to work correctly. These restrictions are shown below:
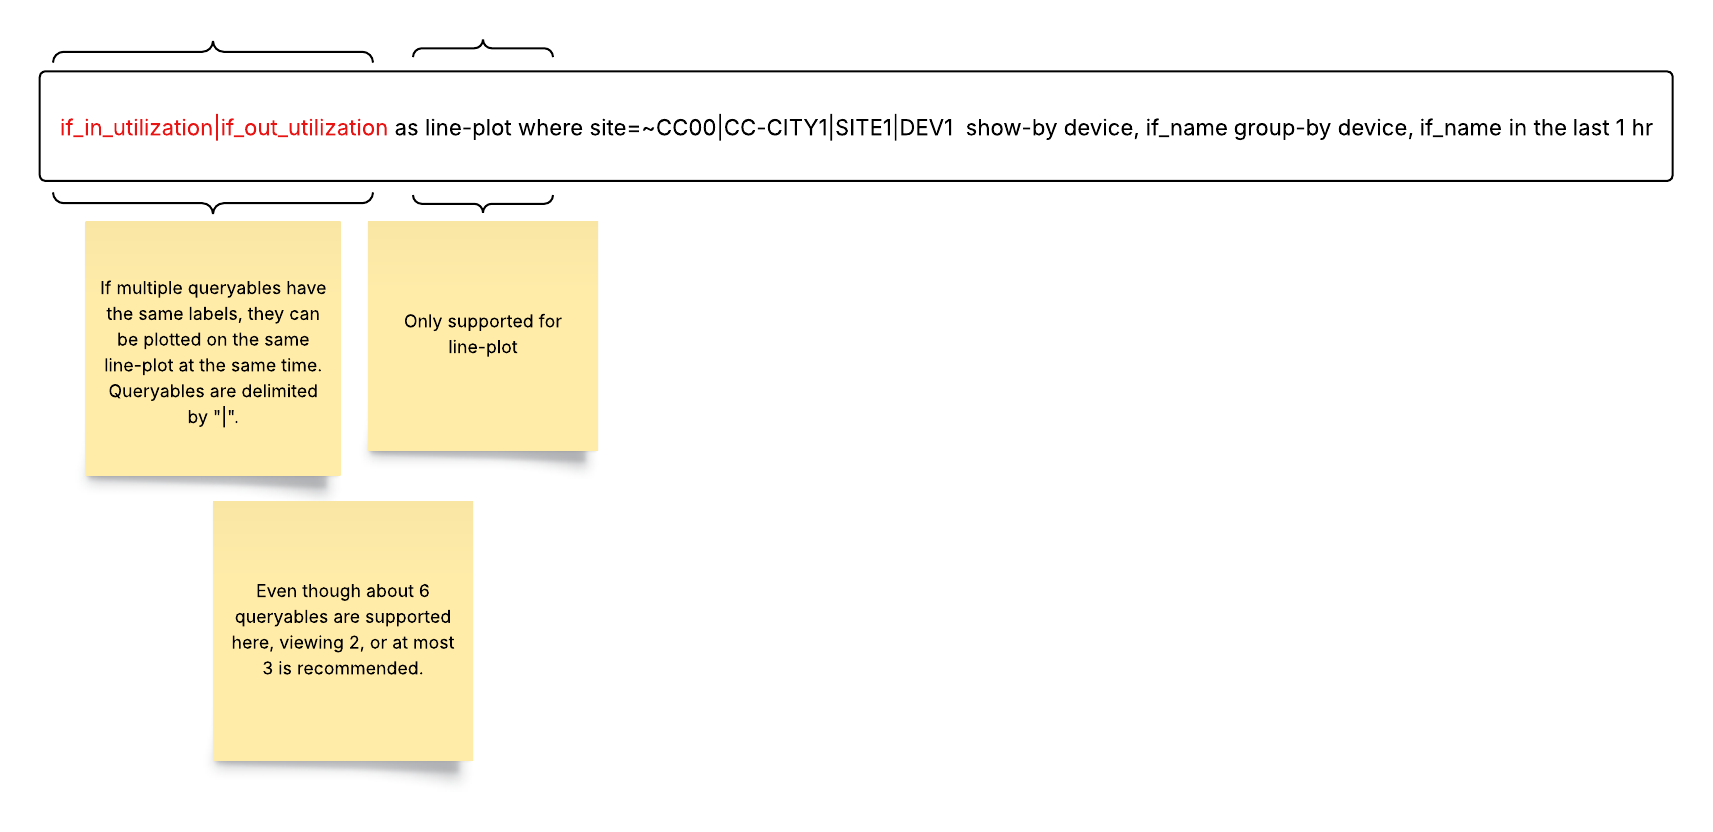
5. Aggregation Queries: This feature provides statistical insights into numerical values stored in a mongo table. Use cases include reporting based on availability, roll-up tables, and entity-related data like uptime availability. For example, if device availability is a numerical value in the inventory table, this function allows end users to see “average” device availability over a selected time window. Aggregation is not supported for metrics or logs
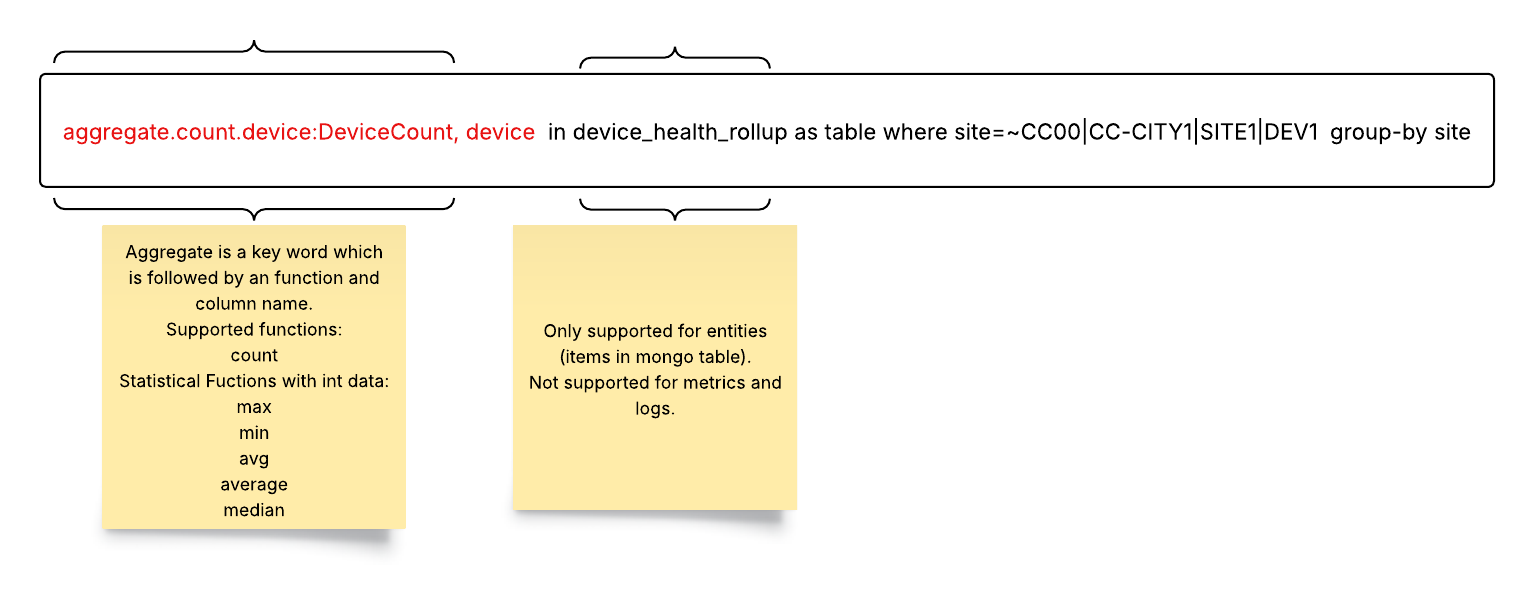
To use aggregate functions, start with the aggregate keyword.
Follow with the function (for example, count).
End with the column name (for example, device).
The following Aggregate Functions are supported:
count: this provides the count of unique instances that match a given filter condition
max: the maximum value of the set that matches a filter condition (default)
min: the minimum value of the set that matches a filter condition
median: the median value of the set that matches a filter condition
avg / average: the average value of the set that matches a filter condition
Using count with aggregate is a powerful combination. It provides the count of unique occurrences of instances (label) that match the filter/group by condition. Every unique instance and the corresponding number of occurrences for that filter condition is shown in the result.
Here is an example using aggregate.count in abc_table as a table group-by abc_number:
Query: aggregate.count in abc_table as table group-by abc_number

6. Nested Queries: Nested queries are used to filter information within a JSON structure. In the where clause, you can specify a nested filter within a JSON structure as shown below:
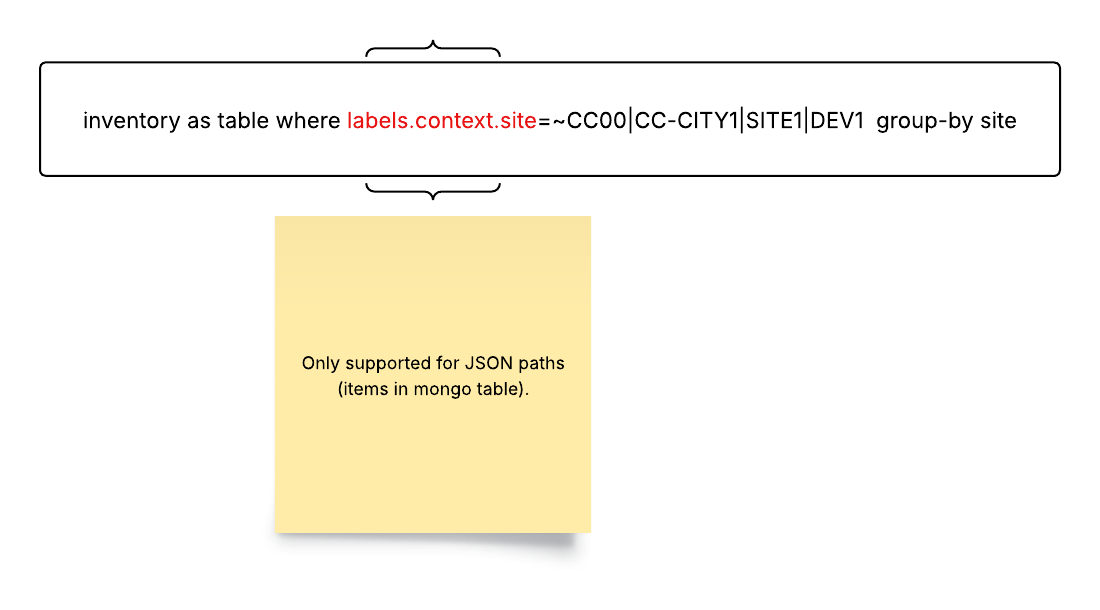
Back to TOC
Best Practices for Queryables
Use Meaningful Aliases: Assign clear and descriptive aliases to columns for better understanding.
Leverage Filtering: Utilize the where clause to focus on specific data subsets.
Optimize Time Ranges: Choose appropriate time ranges for your analysis to avoid excessive data retrieval.
Explore Visualizations: Experiment with different render styles to find the most suitable representation for your data.
Validate Your Queries: Regularly test and validate your queries to ensure accuracy and efficiency.
Back to TOC
Supported Rendering Styles and Usage Examples
Standard Data Rendering Styles
| Render Style | Description | Example Usage |
|---|
| | |
line-plot  | Data is generically rendered as a series of connected points | Numerical metrics packets transmitted traffic volume |
table  | Data is rendered as a simple array of rows and columns | tabular view of inventory |
log-table  | Data in log events is rendered in a simple table of rows and columns | Viewing frequency of syslogs and events over time grouped by severity. |
big-text  | Data is rendered as text with font proportional to the predominance of the information | Important highlights: Network availability Network uptime |
donut  | Data is rendered as a hollowed-out pie chart with color proportions equal to the predominance of the information | Piechart view : Device availability |
gauge  | Data is rendered as a type of speedometer arc | Speedometer view: Device availability |
stacked-area-plot  | Data is rendered as a series of lines stacked and coded to show the separation of values as areas | Average CPU usage by site. |
event-plot  | Events are generically rendered as a series of points connected by lines | Events: Events ordered by time |
stacked-event-plot  | Events are rendered as a series of lines stacked and coded to show the separation of values as areas | Events Events are ordered chronologically and grouped by frequency |
sunburst 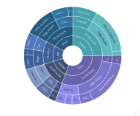 | Data is rendered as a radial treemap (multi-level pie chart) organized as a set of nested rings | Vendor distribution KPI breakdown of a device |
analysis  | Categorical and numerical distribution of the data that is being rendered | Distribution of alert events to find the most common alert |
Render Styles Ideal for Showing Health Status
| Render Style | Description | Example Usage |
|---|
map  | Data is rendered on a map. This is a special format. | Showing health of devices across the US based on latitudes and longitudes. |
threshold-violation-matrix 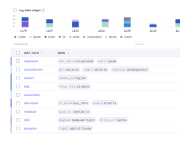 | Data is rendered as color-coded areas from “cold” to “hot” to emphasize violations | Packet drops, latency, and availability across different sites |
honeycomb 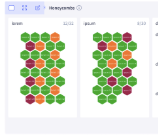 | Data is rendered in six-sided cells to emphasize violations. | Important high-lights: Device status Site status |
timeline-heatmap 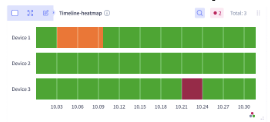 | Data is rendered along a time line as a color range from “cold” to “hot” | change of health of device over period of time |
Render Types Ideal for Network Visualization
| Render Style | Description | Example Usage |
|---|
topology 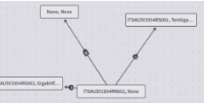 | Network date is rendered as a plot of connected devices, sites, or other equipment | BGP adjacency connections between ASNs |
topomap 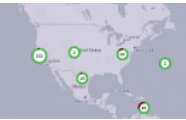 | Network data is rendered as a plot of connected devices, sites, or other equipment against a geographical map | BGP adjacency connections between ASNs shown on a world map based on latitudes and longitudes. |
path  | Network data is rendered as a directional graph. This is a special format. | Displaying the intermediate hops in a segment routing path based on user defined source and destination sites. |
pathmap  | Network data is rendered as a directional graph on a map. This is a special format. | Displaying the intermediate hops in a segment routing path on a world map based on defined latitudes and longitudes. |
Back to TOC
4.3 - NL Queries and Aliases
A Guide to using natural language with Selector
Natural language (NL) queries allow more free-form requests for information from the Selector S2 platform. Instead of using the strict syntax used in the Selector Software Query Language (S2QL), NL use is more like typical human questioning.
So, instead of using a complex string such as:
device:DeviceName in device_health as honeycomb where site=~CC00|CC-CITY1|SITE1|DEV1
An NL query in the GUI or with Slack would look like:
GUI NL Command: device status
Slack NL Command: /select device status
Both NL commands give the user a honeycomb grid of device status which can be drilled down into to visualize further details.
Use of Aliases
NL queries work by mapping NL queries to a series of aliases that stand for the S2QL equivalent. Aliases are best thought of as “query shortcuts.” This process lets the NL process see that the queries “Where are we driving?” and “What place are we going in the car?” are very similar, so the LLM can map them to the same alias for S2QL, such as “destination in automobile.”
Any sentence can be mapped to any alias. However, users must still be aware of the role that aliases play. Because the process tries to map NL to aliases, the better the context provided, the easier it is for the LLM to find the closest alias to the NL query.
For example, if the following aliases have been stored:
If the user asks, “How is BGP doing?” the system has a hard time finding the correct alias to choose. The problem is that “status” and “health” are very similar words, so the system struggles to separate them. Therefore, when aliases are created, it is important to make sure to distinguish aliases with context that adds NL similarity and not NL ambiguity. In this case, better aliases would be:
- bgp overall status
- bgp device health
Once more context is added, the NL query “How is BGP doing?” would correctly map to bgp overall status.
Named Entity Recognition and Structured Labels
Named Entity Recognition (NER) is the NL feature that allows specific queries (such as What is the status of device XTZ123?) to be generalized (What is the status of device yyy? where “yyy” can stand for any device.).
The challenge here is to have NER aware of all possible device label replacements. The process starts with the concept of entity scraping as the Selector Software runs.
Entity Scraping, Enumerations, and Label Autopopulation
Entities for NL processing are structured labels and their corresponding values that are extracted from incoming deployment data. They serve as identifiable data points that can be referenced in structured queries.
Enumerations or Enums are a complete list of all possible values for a given label, as gathered by the Selector software as it runs.
Label Autopopulation is a way used by the Selector Software to gather label values as the software runs, a process called automatic label population.
Together, these three aspects of NER work together to allow NL queries. Each of these concepts is described in this section.
Entities
Examples of entities would be things like:
- Region: USA
- Router ID: XYZ123
These entities help users interact with the system dynamically by allowing queries to reference known data points.
How Does Entity Scraping Work?
The NL query process continuously “scrapes” incoming data from various sources to identify and store entities. This process is performed by periodic pollers that extract relevant information from:
- Loki (log aggregation, etc)
- Prometheus (metrics monitoring, etc)
- MongoDB (database collections)
- Dashboard variables
These pollers can be enabled or disabled based on deployment configurations. In MongoDB, specific collections can also be targeted for entity extraction.
Entity scraping settings, including poller activation and MongoDB collection targeting, can be adjusted in the configuration section of the deployment.
Enumerations
Enumerations (Enums) provide a complete list of all known values for a given label. For example, when querying enums for s2_inst, the system returns all detected instances, such as:
customer1-s2mcustomer1-stagings2dev
Enumerations Improve the Querying Experience
When a user selects a filter value for a label (such as ticker), the NL process automatically retrieves all known values for that label. This provides a list of valid options for the selection, enhancing usability and reducing errors.
While users can select from the suggested values, they can also enter a custom value if needed.
Label Autopopulation
Entity storage in Selector NL processing enables automatic label population in various features. This functionality is leveraged in two situations:
- Maintenance Window (MW) creation (covered in this section)
- Alias resolution (covered in the next section)
Autopopulation in Maintenance Window Creation
When creating a Maintenance Window (MW), users can enable label autopopulation.
Note that:
- If enabled, when a user provides a description during MW creation, the Event Consolidator Service (ECS) queries the NL process for any detected entities.
- If a match is found in the s2_entities table, the MW is automatically assigned a label.
For example, if you create a Maintenance Window with the description
“Ticket opened for the machine 12345”
- If “12345” is a recognized router_id in s2_entities, the NL process automatically assigns a MW label router_id = 12345
This feature streamlines the MW creation process by ensuring labels are applied correctly without manual input.
Aliases and Alias Resolution
Aliases are a core feature of NL processing and enables you to create shortened, more human-readable, and easier-to-remember versions of complex S2QL queries. This simplifies query execution, making it more intuitive and user-friendly.
Example of a Basic Alias
- Alias: all kpi violations
- S2QL Equivalent:
s2ap_infra_health_by_kpi as honeycomb where s2ap_infra_health_by_kpi_violation > 0 show-by kpi_name, s2_inst group-by role, kpi_name, s2_inst
Once this alias is created and saved, you can invoke the query by simply typing “all kpi violations” instead of manually entering the full S2QL query.
When a user submits a query, the Collab Service first checks for alias resolution. If an alias match is found, it is automatically converted to its S2QL equivalent before execution.
Dynamic Alias Resolution
The Selector NL process supports dynamic alias resolution, allowing aliases to include template-like placeholders for entities. These placeholders enable flexible query execution based on user input.
Example of a Dynamic Alias
- Alias: show kpi violations for {{S2_INST1}}
- S2QL Equivalent:
s2ap_infra_health_by_kpi as honeycomb where s2_inst={{S2_INST1}} show-by kpi_name
In this example, the string {{S2_INST1}} acts as a dynamic placeholder that represents an entity value.
How It Works:
- The user types: show kpi violations for s2m
- The NL process detects the S2_INST1 placeholder and substitutes s2m in its place.
- The final S2QL query executed:
s2ap_infra_health_by_kpi as honeycomb where s2_inst=s2m show-by kpi_name
Accessing and Editing Aliases
Aliases are accessed on the UI through their settings:
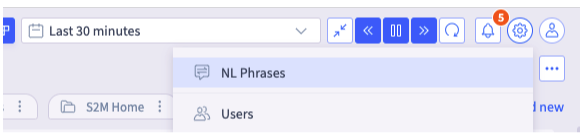
When selected, a list of aliases is displayed:
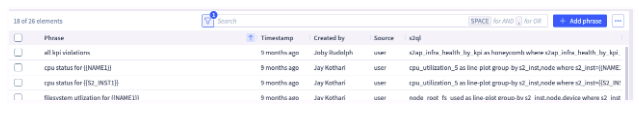
Each alias contains the phrase (alias), some metadata like timestamp and creator, and finally the s2ql.
You can perform CRUD operations from this page. All CRUD operations go through the same endpoint.
One important field to note is the source field. Sources can be these types:
- Users–an alias created by the user
- Widgets–an alias created from widgets by setting name of widget as an alias and the s2ql of widget as alias s2ql
Users
S2AP has an integration function called the Natural Language Phrases List where you can edit, add, and test all aliases. This list can be found on the right-hand side of the query bar at the top:

Through the Actions button you can add an alias like this:
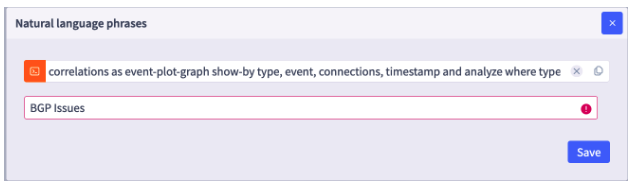
The first entry line is for the actual s2ql queryable. The second line gives the alias name to which the LLM maps.
Selector uses widgets in dashboards to show all the necessary data for the customer and the deployment. Widgets form the core representation of what users want to query. For this reason, all widgets are added as aliases where the widget title is the alias name.
Because of this widget aliasing, it is important to establish a good naming convention for widgets to have a good representation of aliases. If a widget is deleted, added, or edited, this is shortly reflected on the Natural Language Phrases List.
Note that widget aliases cannot be edited on the Natural Language Phrases List editor. Therefore, if users want to change an alias of source widget, they must directly edit the main widget.
Intelligent Alias Matching
One of the key advantages of aliases is that they do not require an exact match. You can enter queries with:
- Minor misspellings
- Slight variations in wording
- Different phrasing (e.g., “violations for device” vs. “violations of device”)
NL processing intelligently matches the input to the most relevant alias and processes the query accordingly. This allows for a more flexible and user-friendly querying experience.
Limitations of Entity/Filter Matching
While alias matching is lenient, entities/filters require exact spellings (for example, router_id or s2_inst or region)
Since the NL process performs a direct substitution for these values, they must be spelled correctly and match exactly as stored in the system.
Alias Label Autopopulation
While aliases significantly streamline the query process, their manual construction can sometimes be complex or unintuitive. Users must follow specific rules when inserting template placeholders, and mistakes can result in nonfunctional aliases.
For example, if you want the alias:
“device events for devices abc and def*”*
To resolve to the following S2QL query:
device_events_ml as table where device=abc or device=def
You might struggle with how to define dynamic fields needed:
- Should you use
{{DEVICE}}, {{DEVICE1}}, or {{DEVICE_1}}? - How should it handle multiple devices (such as
{{DEVICE2}})?
To address this, the NL process supports alias label autopopulation using entity recognition. Instead of requiring you to manually insert template fields, the NL process can automatically detect and normalize them as follows.
- Create an alias with a natural language query (such as “device events for devices abc and def”) but without template placeholders.
- Enter the corresponding S2QL query as usual.
- The NL process scans the S2QL query for potential filter values (such as
abc and def for device). - The NL process searches for these values in the alias text and dynamically assigns template placeholders where applicable.
- The alias is normalized so that future queries can be processed dynamically without manual intervention.
Here is an example:
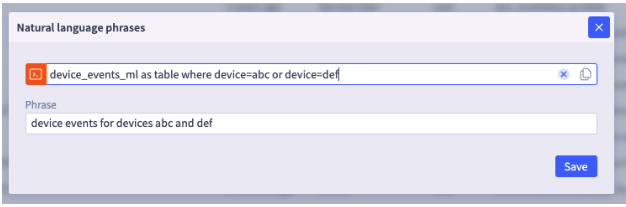
After clicking save and creating the alias, the alias page appears as follows:
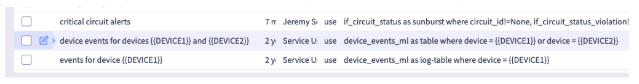
This autopopulation feature is especially useful for those inexperienced with alias creation and/or dealing with aliases that are overly complex. It can also be used to test out the validity of an alias–if the NL process is not able to resolve and normalize, then this entity does not exist in the s2_entities collection.
Best Practices for NL Queries
Here is a brief list of best practices when using NL queries and aliases.
When building NL queries:
Start an existing widget:
1. Use the "NL Phrase" button for the widget.

2. Type in an NL phrase that can be used to invoke the widget. Reference any entities in the s2ql in the NL phrase, and the NL phrase is automatically generalized, such as:

    “*Show me the status of router xxx interface yyy*”
Use the query builder:
1. Get the query built as the user prefers, including filters, sorting, groups, and so on.

2. "Add Phrase"

3. For any entity filters needing to be generalized, ensure that a reference to those entities in the NL phrase.
Use Copilot to build dashboards.
When building NL Aliases:
- Make NL queries at least 3 words long.
- The NL queries should be meaningful.
- Create entity-specific NL queries so that the system learns the broader label names (a generic query is generated from a specific query from created aliases).
- Avoid semantic overlap when possible (status of devices and health of devices).
- Avoid use of phrases like Show me…, What is the…? For example, instead of using show me the status of devices, just use status of devices. The extra words should not cause problems, but it is better to limit the alias to meaningful words.
4.4 - Queryables Overview
Overview
Queryables are S2AP entities that can be used with the S2 Query Language (S2QL). Queryables are generated from various sources the S2AP platform ingests and integrates through multiple pipelines in the platform. For supported integrations, see the Selector Public documentation.
Queryables can be rendered in various ways for the best visualization purpose. For more details and options for the various renderings see the Data Rendering Section in the S2QL user guide.
The Selector platform comes pre-populated with several queryables that can be used to build insightful and actionable dashboards.
Queryables follow established naming conventions:
- _health: This prefix presents metrics on the health of a resource
- _health_by_kpi: This prefix presents metrics on the health of a resource by KPI
- _status prefix: This prefix presents metrics on the status of a resource
- _rate prefix: This prefix presents metrics on the rate a resource is changing
- _utilization: This prefix presents metrics on the utilization of a resource
- _events: This prefix presents event tables
- _topology : This prefix presents topology tables
- _inventory: This prefix presents inventory tables
Listing Queryables in Your Deployment
You can list the queryables available for your S2AP deployment by doing the following:
- Go to the query builder on the S2AP UI.

- Click on the query builder edit button.
- Click on Export list to get a full CSV list of available queryables for the deployment.
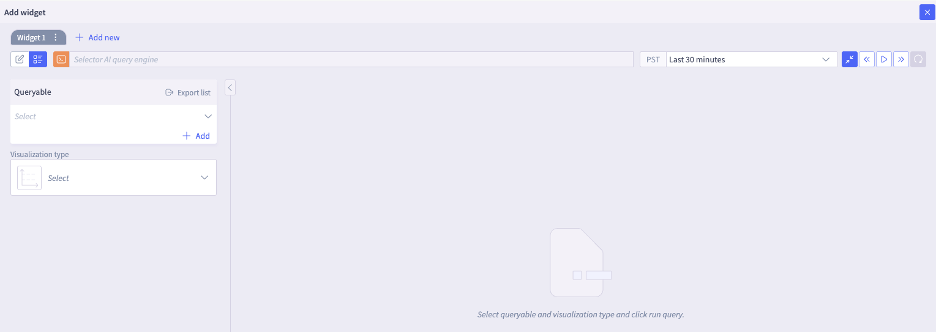
Key Queryables
There are certain Key Queryables that generate tables or metrics. These key queryables are available in the Selector system for querying a device, an interface, overall site health, the inventory, and logs.
These key queryables have been organized into two tables for Metric and Table results to make it easier to find specific queries and outputs.
Note: The queryables described in these tables are not an exhaustive list of all queryables that the platform supports out of the box. Depending on the deployment integrations and configurations, there can be additional ones. Generate the full queryables list from your deployment for all supported types.
4.4.1 - Metric Queryables
Selector Queryable Metrics
These are queryables that return metrics.
Metric Queryables
| Metric Queryable | Queryable Category | Description | Key usage | Typical Render Views |
|---|
| availability | Device Reachability | Tracks the availability when devices are pinged using ICMP | Verify device reachability: operators use this to monitor device ICMP reachability | Honeycomb, line-plot |
| bgp_device_health | BGP Status | Aggregate metric that indicates the health status of devices participating in BGP routing | BGP Monitoring: Used to monitor the status of BGP devices to identify and troubleshoot issues | Honeycomb, line-plot |
| bgp_flap_rate | BGP Status | Aggregate metric that indicates the BGP flap rate in a time period | BGP Monitoring: Used to monitor the BGP link/interface flap rate to identify and troubleshoot BGP issues. | Honeycomb, line-plot |
| bgp_peer_downtime | BGP Status | Aggregate metric that tracks the BGP peer down time to monitor the health status of BGP | BGP Monitoring: Used to monitor the status of BGP devices to identify and troubleshoot issues | Honeycomb, line-plot |
| bgp_peer_state | BGP Status | Metric that indicates the health status of a BGP peer | BGP Monitoring: Used to monitor the status of BGP devices to identify and troubleshoot issues. | Honeycomb, line-plot |
| bgp_peer_status_by_kpi | BGP Status | Aggregate metric that indicates the overall health status of BGP by KPI | BGP Monitoring: Used to monitor the status of BGP devices by KPI to identify and troubleshoot issues. | Honeycomb, line-plot |
| circuit_health | Circuit Health | Tracks the health of Layer 2 circuits | Circuit Monitoring: Monitors circuit health | Honeycomb, line-plot |
| cpu_usage | Device Health | Tracks the CPU usage of devices. | Detailed Device Health monitoring: Allows operators to monitor device CPU usage to prevent device health degradation. | Honeycomb, line-plot |
| device_availability | Device Reachability | Tracks the availability when devices are pinged using ICMP | Verify device reachability: operators use this to monitor device ICMP reachability | Honeycomb, line-plot |
| device_harddown_health | Device Health | Indicates if a device is “hard down” i.e. completely unreachable. This is a critical device liveness, health check via SNMP , ICMP. indicator, | Overall device Health monitoring: Operators monitor devices, and when a device is confirmed to be unreachable via SNMP and ICMP, a high severity alert is typically triggered | Honeycomb, line -plot |
| device_health | Device Health | Aggregate health metric showing overall health status of devices. It aggregates various health signals (such as SNMP, ICMP, CPU, memory etc.) to provide a single health status (e.g., Green/Healthy, Red/Unhealthy) | Overall device Health monitoring: primary metric to monitor overall operational state of the device network fleet | Honeycomb, line-plot |
| device_health_by_kpi | Device Health | Aggregate metric that shows device health status based on specific Key Performance Indicators (KPIs) such as CPU, port, memory, power etc. The value of this metric is derived based on the health of the individual KPIs, and 0 indicates healthy (green), 1 indicates unhealthy (red) | Device Health monitoring: Allows operators to identify the specific KPI (CPU, Health, Memory, Interface, Disk, BGP etc.) causing a device health degradation. | Honeycomb, line -plot |
| device_health_rollup | Device Health | | | Honeycomb, line-plot |
| device_inventory_presence | Device Inventory | Count of number of devices present grouping devices together by model, product | Device Inventory Monitoring: Operators use it to monitor device inventory such as count of devices | Honeycomb, line-plot |
| device_ping_availability | Device Reachability | Tracks availability status of devices based on Pingmesh (ICMP ping) results. It tracks the reachability of devices from various probes. Values include: - -1: Unreachable - 0: No Loss (Healthy) - 1: Total Loss | Verify Network reachability: Operators monitor devices, and when a device is confirmed to be unreachable ICMP, a high severity alert is typically triggered | Honeycomb, line-plot |
| device_ping_health | Device Reachability | Derived metric that is derived from ping availability metrics and feeds into device health and KPI | Verify device reachability: operators use this to monitor device ICMP reachability health | Honeycomb, line-plot |
| device_power_status | Device Health | Metric that tracks the status of device power | Device Health Monitoring | Honeycomb, line-plot |
| device_reset_health | Device Health | Metric that tracks if a device got reset ie device crash or device rebooted | Device Health Monitoring: Allows operators to monitor if a device got reset (crash or restart) | Honeycomb, line-plot |
| device_snmp_availability | Device Reachability | Tracks the availability of devices for SNMP | Verify device reachability: operators use this to monitor device SNMP reachability | Honeycomb, line-plot |
| device_temperature_f_health | Device Health | Metric that tracks the device temperature in farenheit | Device Health Monitoring | Honeycomb, line-plot |
| disk_device_health | Device Health | Tracks the disk health of devices. | Detailed Device Health monitoring: Allows operators to monitor disk health to prevent device health degradation. | Honeycomb, line-plot |
| ec2_instance_health | EC2 instance health | Metric that tracks EC2 instance health | EC2 Monitoring: Operators monitor the health of their EC2 instances running in AWS public cloud. | Honeycomb, line-plot |
| ec2_instance_health_by_kpi | EC2 instance health | Metric that tracks EC2 instance health by KPI | EC2 Monitoring: Operators monitor the health of their EC2 instances running in AWS public cloud. | Honeycomb, line-plot |
| if_admin_oper_status | Interface Health | Aggregate metric that shows agregate of the admin status and operational status of a port (up/down). | Interface Health monitoring: Used to monitor the operational status of network interfaces by various KPIs | Honeycomb, line-plot |
| if_flap | Interface Health | Shows the count of Interface flaps | Interface Health monitoring: Used to monitor interface flaps | Honeycomb, line-plot |
| if_host_status | Interface Health | Shows the status of the host that the interface belongs to? | Interface Health monitoring: Used to monitor interface flaps | Honeycomb, line-plot |
| if_in_errors | Interface Health | Shows the count of interface inbound errors | Interface Health monitoring: Used to monitor interface errors | Honeycomb, line-plot |
| if_in_utilization | Interface Health | Shows interface inbound traffic utilization/throughput | Interface Health monitoring: Used to monitor interface utilization | Honeycomb, line-plot |
| if_out_errors | Interface Health | Shows the count of interface outbound errors | Interface Health monitoring: Used to monitor interface errors | Honeycomb, line-plot |
| if_out_utilization | Interface Health | Shows interface outbound traffic utilization/throughput | Interface Health monitoring: Used to monitor interface utilization | Honeycomb, line-plot |
| if_status | Interface Health | Metric that indicates the status of an interface - good (interface up) , bad (interface down/some issue). Values: 0 (Good), 1 (Bad). | Interface Health monitoring: Used to monitor the operational status of network interfaces | Honeycomb, line-plot |
| if_status_by_kpi | Interface Health | Interface health status based on specific Key Performance Indicators (KPIs). Shows health of kpis for an interface | Interface Health monitoring: Used to monitor the operational status of network interfaces by various KPIs | Honeycomb, line-plot |
| ipsla_device_health | IPSLA | Metric that monitors of IP SLA device health analysing traffic metrics like jitter, latency, packet loss etc. | IP SLA monitoring: Operators monitor IP SLA traffic metrics like latency, jitter, packet loss to track the state of their devices, and network. | Honeycomb, line-plot |
| jitter | Device Reachability | Tracks the jitter when devices are pinged | Verify device reachability: operators use this to monitor device reachability health. When there is high jitter, the device connectivity has issues. | Honeycomb, line-plot |
| l3vpn_vrf_device_status | L3vpn device status | Metric that tracks the L3VPN device status | L3VPN monitoring: Operators monitor the L3VPN VRF status of devices | Honeycomb, line-plot |
| l3vpn_vrf_status | | Metric that trcks the L3VPN status | L3VPN monitoring: Operators monitor the L3VPN VRF status of devices | Honeycomb, line-plot |
| latency | Device Reachability | Tracks the latency when devices are pinged | Verify device reachability: operators use this to monitor device reachability health. When there is high latency the device connectivity has issues. | Honeycomb, line-plot |
| link_monitor_device_health_by_kpi | Link Health | Metric that tracks the state of a link based on KPIs to understand the health of the device. | Link Monitoring: Operators monitor the state of links by KPIs to detect issues in their device health proactively | Honeycomb, line-plot |
| link_monitor_state | Link Health | Metric that tracks the state of a link | Link Monitoring: Operators monitor the state of links to detect issues in their network, data centers proactively | Honeycomb, line-plot |
| lldp_session_status_by_kpi | LLDP | Metric that tracks the status of LLDP sessions by KPIs | LLDP Monitoring: Operators monitor LLDP session status by KPIs undestand the state of their network and devices | Honeycomb, line-plot |
| log_counts | Logs | Metric that counts the total volume of raw logs | Log Monitoring | Honeycomb, line-plot |
| memory_usage | Device Health | Tracks the memory usage of devices. | Detailed Device Health monitoring: Allows operators to monitor device memory usage to prevent device health degradation. | Honeycomb, line-plot |
| ospf_device_health | OSPF status | Aggregate metric that indicates the health status of devices participating in OSPF | OSPF Monitoring: Used to monitor the status of OSPF devices to identify and troubleshoot issues. | Honeycomb, line-plot |
| ospf_if_status | OSPF status | Aggregate metric that indicates the health status of interfaces of devices participating in OSPF | OSPF Monitoring: Used to monitor the status of OSPF device interfaces to identify and troubleshoot issues. | Honeycomb, line-plot |
| ospf_nbr_state | OSPF status | Metric that indicates the health status of an OSPF neighbor | OSPF Monitoring: Used to monitor the status of OSPF devices to identify and troubleshoot issues. | Honeycomb, line-plot |
| ospf_status_by_kpi | OSPF status | Aggregate metric that indicates the health status of devices participating in OSPF by KPI | OSPF Monitoring: Used to monitor the status of OSPF devices by KPI to identify and troubleshoot issues. | Honeycomb, line-plot |
| packet_loss_pct | Device Reachability | Tracks the packet loss when devices are pinged | Verify device reachability: operators use this to monitor device reachability health. When there is 100% packet loss, the device is unreachable | Honeycomb, line-plot |
| port_device_health | Port Health | Metric that monitors the health of a port to catch device health issues proactively | Device Port Monitoring: Operators monitor port health of devices to catch issus proactively | Honeycomb, line-plot |
| power_supply_state | Power Supply state | Metric that monitors the state of the power supply | Power Supply Monitoring: Operators monitor the health of power supplies to get proactive notification on issues so that they can prevent broader outages (server, devices, networks etc. ) | Honeycomb, line-plot |
| rollup_if_utilization | Interface Health | Rollup metric that shows interface utilization | Interface Health monitoring: Used to monitor interface utilization , used in capacity reports | Honeycomb, line-plot |
| sd_wan_device_health | Sdwan Health | Metric that tracks the health of Sdwan devices | Sdwan monitoring: Operators can monitor the health of Sdwan devices | Honeycomb, line-plot |
| site_bgp_status | Site BGP Status | Aggregate metric that indicates the BGP status of a site, based on the aggregate of all BGP devices in that site | BGP Monitoring: BGP Monitoring at site level to identify and troubleshoot issues. | Honeycomb, line-plot |
| site_harddown_health | Site Health | Aggregate metric that indicates if a site is “hard down” i.e. all devices in the site are completely unreachable. This is a critical device liveness, health check via SNMP , ICMP | Overall Site Health monitoring: Operators monitor health of the overall site, based on the aggregate of health of all devices in that site. When an entire site is unreachable (because all devices are unreachable via SNMP and ICMP), a high severity alert is typically triggered. | Honeycomb, line-plot |
| site_health | Site Health | Aggregate health metric showing overall health status of site. It aggregates various health signals to provide a single status for site health (e.g., Green/Healthy, Red/Unhealthy) | Overall Site Health monitoring: Operators monitor health of the overall site, based on the aggregate of health of all devices in that site When an entire site is unreachable (because all devices are unreachable via SNMP and ICMP), a high severity alert is typically triggered. | Honeycomb, line-plot |
| site_health_by_kpi | Site Health | Aggregate health metric showing overall health status of site KPIs. It aggregates various KPI signals to provide a single status for site KPI health (e.g., Green/Healthy, Red/Unhealthy) Shows health of KPIs for a site | Overall Site Health monitoring: Operators monitor health of the overall site KPIs, based on the aggregate of health of all KPIs for that site. | Honeycomb, line-plot |
| sys_uptime | System Health | Metric that tracks system uptime - time since the device has been up. | Device monitoring | Honeycomb, line-plot |
| tunnel_status_by_device | Tunnel Status | Metric that tracks IPSec tunnel up/down status for a device. Tunnel up is red, Tunnel down is green | Tunnel Status: | Honeycomb, line-plot |
| wilc_ap_failed_count | Wireless Monitoring | Metric that tracks the failed Access Point (AP) count | Wireless Monitoring: Operators use this to monitor their wireles devices (AP, Wireless lan controller) . Single pane, unified view across wireless and wired with Selector | Honeycomb, line-plot |
| wlc_ap_connect_count | Wireless Monitoring | Metric that tracks the cconnected Access Point (AP) count | Wireless Monitoring: Operators use this to monitor their wireles devices (AP, Wireless lan controller) . Single pane, unified view across wireless and wired with Selector | Honeycomb, line-plot |
| wlc_max_clients_count | Wireless Monitoring | Metric that tracks the count of max clients connected to an Access Point (AP) | Wireless Monitoring: Operators use this to monitor their wireles devices (AP, Wireless lan controller) . Single pane, unified view across wireless and wired with Selector | Honeycomb, line-plot |
4.4.2 - Table Queryables
Selector Queryables Table
These are queryables that return tables.
Table Queryables
| Table Queryable | Queryable Category | Description | Key usage | Typical Render Views |
|---|
| audit_logs | Audit logs | Table of Audit logs | Auditing and compliance Monitoring: Trackers users, and their key actions on S2AP and timestamps. | Table |
| configs_diff | Config change monitoring | Tracks if a device config has changed from a previous snapshot. Ex. Ip address changed of a device | Configuration change monitoring: Operators can monitor configuration changes to be able to pin point causes of issues. | Honeycomb, line-plot |
| correlation_events | Correlated Insights | Table that stores correlated events metadata, the records in this table are correlated and anchored by specific labels to improve event grouping. | Correlated Insights: Used to monitor correlated events to get a comprehensive view of root cause of issues | Table |
| correlations_summary | Correlated Insights | Table that stores the summary of correlated events used in the correlations graph and dashboards | | Table |
| device_event_patterns | Device Events | Table that stores structured log event patterns from networking devices. Event patterns are categorized as .. to facilitate trend analysis and automated correlation. | Log Pattern Analysis: Used for analysing network event patterns from logs | Table |
| device_events_ml | Device Events | Table that stores structured log event stream from networking devices that have been processed and modeled using Machine Learning. Unlike raw logs, these events are categorized (e.g., Interface Flap, BGP Peer Down) to facilitate trend analysis and automated correlation. | Log Pattern Analysis: Used for analysing network event patterns from logs | Table |
| device_events_pattern_groups | Device Events | Table that stores structured log event patterns and groups from networking devices. Event pattern groups are categorized to facilitate trend analysis and automated correlation. | Log Pattern Analysis: Used for analysing network event patterns from logs | Table |
| device_logs | Device Logs | Table that stores the raw logs ingested from the network devices. This contains the original log messages, timestamps, and severity levels without the ML modeling layer. | Raw logs analysis and troubleshooting | Honeycomb, line-plot |
| devicediscovery | Device Discovery | Table that contains the raw device discovery inventory | | Table |
| interface_database_inventory | Interface Inventory | Metastore Inventory table containing detailed information about network interfaces. It provides metadata such as interface names, descriptions, speeds, types, and connected remote devices. | Contextualize interface metrics with interface config metadata | Table |
| ipsec_logs | | | | Table |
| ipsec_reason_events_ml | IPSec state | Table that stores IPsec events information | | Table |
| isp_inventory | ISP Inventory Table | Table that stores key isp information for devices | ISP inventory: | Table |
| layer2_topology | Layer 2 Topology | Table containing Layer 2 topology data. | Layer 2 Topology Inventory | Table, Topology map |
| lldp_table | LLDP | Table that holds LLDP inventory (Link Layer Discovery Protocol) | LLDP Monitoring: Operators use LLDP to discover device topologies, and build a topology map | Table |
| s2_device_inventory | Device Inventory | Metastore inventory table containing detailed metadata about all network devices. It serves as the source of truth for device attributes like Vendor, Model, Operating System, Site, Location, and Roles. | Contextualize metrics and logs with device metadata | Table |
| s2_if_metatags | Interface Metadata | Interface metadata? | | Table |
| s2_query_trace | Query Metadata | This table stores query details such as S2QL or Natural Language queries, usage metrics, user who executed the query and the time to return a response. | Query monitoring: Operators use this to track details around the queries being executed by users, their usage and the performance of those queries | Table |
| s2_snow_incidents | Service Now Incidents | Table that stores the SNOW incidents data | SNOW Incident monitoring | Table |
| s2_snow_incidents_analysis | Service Now Incidents | Table that has Service Now Incidents data for incident analysis dashboards | SNOW Incident monitoring | Table |
| s2_snow_inventory | Service Now Incidents | Table that stores the SNOW incidents data | SNOW Incident monitoring | Table |
| snmptrap_default_event | SNMP Traps | Landing table for initial ingestion of SNMP traps | SNMP Trap monitoring | Table |
| synthetics_topology | Synthetics | Table that has the synthetics probe inventory. | | Table |
| sys_logs | Device Logs | Table that stores the raw system log stream ingested from the network devices. This stream contains the original log messages, timestamps, and severity levels without the ML modeling layer. | Raw logs analysis and troubleshooting | Honeycomb, line-plot |
| topology_bgp | Topology State | Table that stores BGP topology data | Topology State: Operators use this to get BGP Topology information | Table, Topology Map |
| topology_isis | Topology State | Table that stores ISIS topology data | Topology State: Operators use this to get ISIS Topology information. | Table, Topology Map |
| topology_l3vpn | Topology State | Table that stores L3VPN topology data | Topology State: Operators use this to get L3VPN Topology information. | Table, Topology Map |
| topology_ldp | Topology State | Table that stores LDP topology data | Topology State: Operators use this to get LDP Topology information. | Table, Topology Map |
| topology_ospf | Topology State | Table that stores OSPF topology data | Topology State: Operators use this to get OSPF Topology information. | Table, Topology Map |
5 - Security & Compliance
5.1 - Selector Security and Compliance Posture
Selector System Security and Compliance Information
Selector is highly invested in safeguarding client data and maintaining a robust security posture that meets and exceeds modern regulatory standards. We integrate a proactive “shift-left” approach by building security into the early stages of product planning.
Selector Security and Governance (Assurance)
Our security organization is led by tenured cybersecurity professionals, including a dedicated Chief Information Security Officer (CISO), who ensures policies remain current with regulatory and compliance needs.
Certifications and Audits
Selector demonstrates commitment to stringent industry standards through external, independent verification:
- SOC 2 Type 2 & ISO 27001 Certification: We engage an independent, third-party auditor (approved by the AICPA) to conduct comprehensive annual assessments of our SaaS infrastructure, development processes, and overall Information Security Management System (ISMS).
- Continuous Monitoring & Audit Coverage: We implement continuous monitoring across our enterprise and SaaS platform, conducting internal audits and periodic verification of our security controls.
- Vulnerability Management: We leverage a continuous vulnerability management framework, using tools like Trivy, Dependency Track and Snyk to generate and scan our Software Bill of Materials (SBOM), addressing potential vulnerabilities early in the development lifecycle.
- Annual Penetration Tests: Independent third-party experts conduct annual penetration tests on our code and infrastructure to proactively identify and remediate vulnerabilities, keeping us strong against evolving threats.
Access and Authentication Policies
We enforce strict controls over who can access our systems and how they authenticate.
- Role-Based Access Control (RBAC): The Selector platform supports RBAC to manage user privileges and groups, enforcing the Principle of Least Privilege to limit access to only necessary parts of the platform.
- Strong Authentication and SSO: Selector works with customers to configure Single Sign-On (SSO) using multiple identity providers, including Okta, Azure AD, Active Directory, Google, Ping ID, Generic OIDC, and SAML 2.0.
- No Backdoor/Local Dev Accounts in Production: Selector does not use backdoor accounts or hardcoded developer usernames and passwords in production systems. We do not maintain local user accounts on the platform’s underlying Operating System (OS).
Product and Customer-Facing Controls (Protection)
These security measures are implemented directly within the S2AP platform and its deployment model to protect customer environments and data.
Network and Instance Security
- Dedicated SaaS Tenancy: We provide a dedicated SaaS tenancy for each customer, ensuring effective isolation of data and infrastructure.
- Zero-Trust Network Model: We implement a Zero-Trust approach internally to limit access, and enforce network security via application and traditional firewalls and VPN-only access to our SaaS instances.
- Strict Access Control: Only allowed IP addresses and authenticated users have access to the hosted infrastructure. Cloud-based security tools continuously monitor user behavior and access to detect anomalies.
- Local VM Firewalling: Local firewalling is used on the Kubernetes services to ensure only desired traffic is permitted internally.
- On-Premise Guidance: For on-premises deployments, we work with customers to ensure correct external firewalling is configured and tested.
Data Protection and Privacy
Data Handling on S2AP features:
- Non-Retention of Sensitive Data: The S2AP platform does not retain any sensitive customer or user data such as MAC addresses, individual IP addresses, PII, PCI, or PHI. This ensures strict adherence to related compliance policies.
- Read-Only Client/Infrastructure Data: We maintain only client and infrastructure data in a read-only format to facilitate network performance monitoring for customers.
- Secure Code Practices: We perform continuous automated scans of our code base and leverage security tooling to review libraries for vulnerabilities, actively preventing accidental leaks of sensitive information.
Endpoint and Malware Protection
- Advanced Threat Detection: We use advanced threat detection and prevention features for our S2AP SaaS platform leveraging Cloud Service Provider capabilities.
- Endpoint Detection and Response (EDR): Effective EDR tools secure our on-premises and mobile devices, monitoring files and applications in real-time to instantly block and quarantine threats.
- Device Compliance: Our solution checks every laptop accessing our network to ensure antivirus and anti-malware software (like XProtect, Windows Defender, and Gatekeeper) is active.
- Email Security: Strong email filtering and quarantine capabilities utilize content-based, heuristic, and Bayesian filtering, to perform real-time scans to isolate suspected spam and harmful messages.
Patching, Resilience, and Incident Management (Operations)
Patch Management
Selector implements a comprehensive, automated patch management strategy across all assets:
- SaaS Infrastructure: We leverage the native automated patching service provided by our Cloud Service Provider (GCP) for centralized control over Linux and Windows systems.
- Enterprise and Endpoints: For our internal enterprise assets (Macintosh and Windows laptops), we automate patching using vendor-provided tools, with continuous monitoring from EDR solutions to verify effectiveness.
- Client-Premise Solutions: For Selector-managed SaaS solutions deployed on client premises, we provide risk-adjusted management solutions that ensure security and compliance proportional to the solution’s impact.
- Vulnerability Remediation: Vulnerabilities identified through our scanning tools are prioritized based on criticality and impact, with patching deployed efficiently via an automated process.
Backup and Business Continuity
We utilize cloud provider capabilities to ensure service resiliency and swift recovery:
- SaaS Backup and Redundancy: Our SaaS solution leverages Google Cloud’s infrastructure for real-time data replication, automated backups, redundancy, and global reach to protect customer data.
- Disaster Recovery (DR) Drills: We run annual drills to test our disaster recovery plans and ensure our team can effectively manage a disruption.
- On-Premise Guidance: For on-premises solutions, we guide customers on best practices for backups, system redundancy, and disaster recovery tailored to their specific setups.
Incident Response and Recovery
Selector maintains a well-defined Incident Response and Recovery (IRR) plan to minimize downtime and ensure transparency:
- Proactive Team: The Incident Response Team has clearly defined roles and conducts regular exercises (for example, simulated phishing and ransomware).
- Response Process: As soon as an issue is detected, the Site Reliability Team (SRE) assesses the situation and coordinates remediation.
- Communication: Our Business Continuity Plan (BCP) emphasizes clear and timely communication, providing regular, transparent updates to all involved stakeholders throughout the incident lifecycle.
- Post-Incident Review: After service is restored, a review is conducted to learn lessons and improve future processes.
6 - AI & Machine Learning
6.1 - Selector AI and ML Models and Capabilities
Introduction to Selector AI and ML
High Level Architecture
Selector uses a variety of models across the entire stack purpose built for solving various use cases from auto baselining metrics, translating unstructured logs into events, correlating various anomalies seen, identifying root cause, interacting with the platform in natural language and finally summarizations in copilot and events. This document provides additional information on each of the models used.
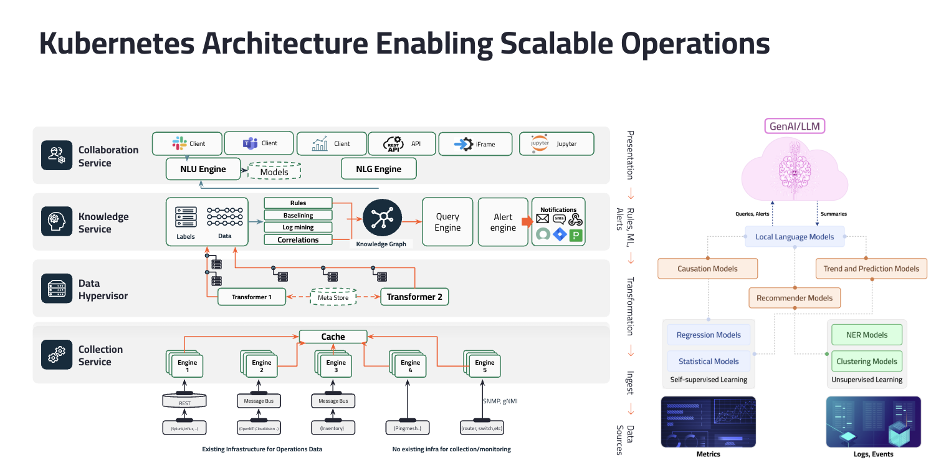
Selector Co-Pilot
The Selector Co-Pilot suite of technologies powers a conversational interface, allowing users to interact with complex system data using natural language.
Large Language Models (LLMs) using Gemini
Gemini is a family of advanced AI models that understands and processes human language. It serves as the “brain” for the Selector Co-Pilot, interpreting user questions and generating coherent, relevant answers. This provides an intuitive way for engineers to query system behavior without needing specialized languages, drastically speeding up investigation.
These models convert sentences into numerical representations that capture their underlying meaning. This enables the system to find information that is conceptually related to a user’s query, even if it doesn’t contain the exact keywords. The benefit is a more intelligent and accurate search that understands user intent, leading to faster discovery of relevant information. This technology is a core component of Selector’s Network Language Model (NLM).
Selector uses algorithms for several open-source libraries for its AI and ML features.
Several of these models can be tuned to be used for sentence or text-embedding generation. They can be used with the sentence-transformers package found at Hugging Face.
The Selector Network Language Model (NLM)
The Selector NLM allows:
- Embedding Queries: When an engineer types a natural language query like, “What was the root cause of the last production outage in San Jose?” the Sentence Transformer model converts this entire question into a numerical vector called an embedding. This vector represents the semantic meaning of the query.
- Embedding Data: Selector proactively does the same the data it ingests. Every log entry, alert, metric, and configuration item is also passed through the model and stored as a vector in a specialized database. A log message like “High latency detected for db-master-sjc-prod” and a user’s query about a “slowdown in San Jose” have very similar vector representations.
- Vector Search: The system performs a vector search (or similarity search). It takes the vector from the user’s query and instantly finds the data vectors in its knowledge base that are mathematically closest. “Closeness” in this vector space equates to semantic relevance.
Selector finds the right answers even if the terminology doesn’t match exactly. A query for “application slow” can correctly match alerts about “high response time” or “transaction latency exceeded” because the model understands these concepts are related.
BM25 for Lexical Search
BM25 is a powerful algorithm that ranks search results based on keyword relevance. It complements semantic search by quickly finding exact matches for specific terms, error codes, or hostnames mentioned in a query. This hybrid approach ensures that search is both fast for simple terms and context-aware for complex questions.
PydanticAI Framework for LLM Interaction
This framework imposes structure and validation on the data flowing to and from the LLM. It ensures that user requests are correctly formatted for the AI and that the AI’s responses are reliable and predictable. This enhances the overall stability and accuracy of the Co-Pilot, making it a trustworthy tool for critical operations.
Correlations
These methods automatically identify relationships between different system signals (metrics, logs, traces) to surface the bigger picture during an incident.
Self-Supervised Deduplication
This technique uses machine learning to automatically identify and group redundant or similar alerts and events. It learns what constitutes a “duplicate” from the data itself, without needing human input. This massively reduces alert noise, allowing operators to focus on unique issues rather than being overwhelmed by repetitive notifications.
Temporal Proximity Filtering
This method groups events that occur closely together in time, operating on the principle that things happening around the same time are often related. It’s a fast and effective way to build a preliminary timeline of an incident. This provides an initial, high-level context that helps engineers understand how an issue unfolded.
Recommender Systems-Based Algorithm
Selector uses collaborative filtering algorithms. Traditionally, collaborative filtering recommends items to users based on the preferences of similar users. In the context of AIOps, Selector repurposes this technique to correlate anomalous events. Instead of users and products, the platform analyzes the “behavior” of various system components, metrics, and logs.
The process begins with the ingestion and enrichment of metrics and logs, from network devices, cloud infrastructure, and applications. This data is then transformed into a format that the machine learning models can understand, a process that involves creating detailed “embeddings” or representations of each data point. These embeddings capture the essential characteristics and context of the operational data.
This is where the recommender system comes into play. By applying collaborative filtering to these rich data embeddings, Selector can identify “similarities” between different anomalous events. If a particular type of network error frequently occurs in conjunction with a specific application performance degradation, the recommender system will learn this association. When a new anomaly is detected, the system can then recommend other related anomalies that are likely part of the same underlying issue.
Topology awareness
This involves understanding the map of how services, hosts, and applications are interconnected. The system uses this infrastructure map to trace how a problem in one area could logically impact another. This provides critical context, enabling the system to pinpoint the source of a problem by following the path of dependencies.
Selector automatically discovers and builds a model of the entire infrastructure environment. This includes:
- Network Topology: How routers, switches, firewalls, and other network devices are interconnected.
- Application Topology: The relationships between different microservices, applications, and the underlying infrastructure they run on.
- Service Dependency: How various services rely on each other to function correctly.
- Cloud Infrastructure: The connections between virtual machines, containers, and other cloud resources. This “digital twin” of the environment is continuously updated to reflect any changes, ensuring the model remains accurate.
Improving Correlation with Topology Context
Once this topological map is established, Selector uses it to enhance its correlation in several keyways:
- Focusing on Relevant Data: Instead of analyzing every single alert from every device, the system uses the topology to understand which components are related. When an issue is detected with a specific application, the correlation engine prioritizes data from the servers, and network segments that the application actually depends on. This drastically reduces noise and false positives.
- Tracing the Path of Failure: Topology awareness allows the system to trace the path of a problem as it propagates through the environment. It can follow the chain of events from a user-facing application error, down to the specific microservice, and further down to the underlying network issue that caused it. This ”service-aware” correlation is far more effective than just looking for simultaneous anomalies.
By combining its powerful machine learning and recommender systems with a deep understanding of the environment’s topology, Selector can quickly and accurately pinpoint the root cause of even the most complex issues.
Causations
This method goes beyond correlation to identify potential cause-and-effect relationships.
Associative rule mining sifts through historical incident data to discover strong “if-then” rules. For example, it might learn that “if service A shows high latency, then database B experiences a CPU spike 90% of the time”. This provides actionable insights that help teams move from reactive problem-solving to proactive prevention.
Metric Anomaly Detection
The following models continuously monitor system performance metrics to find abnormal behavior.
Self-supervised Learning
This method learns the “normal” behavior of a system directly from its operational data, without needing manual labeling. It then flags any deviation from this learned baseline as a potential anomaly. This allows the system to detect novel or “zero-day” issues that have never been seen before, providing a powerful layer of proactive monitoring.
Ensemble of Regression and Statistical Models
This method combines the predictions from multiple different anomaly detection models to make a more accurate final decision. By leveraging a diverse set of techniques, it can spot a wider variety of issues, from sudden spikes to subtle drifts. This ensemble approach improves detection accuracy and significantly reduces false positives, ensuring that alerts are trustworthy.
Advanced Log Mining
These techniques extract structured, meaningful information from messy, unstructured log data.
DBSCAN Clustering
DBSCAN is an algorithm that automatically groups similar log messages and isolates rare ones. It sifts through millions of logs to find the few that are different, which often indicate errors or critical events. This automates the tedious task of manual log review, quickly surfacing the “needle in the hay” that points to a problem’s cause.
Named Entity Recognition (NER)
NER automatically scans log text to identify and classify key entities like IP addresses, service names, file paths, or error codes. It transforms raw, unstructured text into structured, searchable information. This makes it possible to easily filter, aggregate, and correlate log data with other signals to get a complete picture of an issue.
A CMDB or inventory database contains a wealth of information, but much of it is often stored in free-form text fields like hostname, description, or notes. For example, a device’s hostname might be cr01.sjc02.prod.net.com. While a human engineer can instantly decode this as a core router (cr01) in San Jose (sjc02) in the production (prod) environment, a machine sees it as a single, meaningless string. Without context, the correlation engine can’t use this valuable information. The model identifies and extracts key business and operational entities. From cr01.sjc02.prod.net.com, it would extract:
Device Role: core-router
Location: san-jose-02
Environment: production
Metadata Tagging: These extracted entities are then applied as structured metadata tags to the device within Selector’s internal model. The single device is now enriched with multiple layers of context. This structured metadata acts as an input to the Selector’s correlation engine, dramatically improving its accuracy.
Trend and Forecasting
These models predict future system behavior to enable proactive planning and issue prevention.
Constraint-aware Auto Regressive Seasonal Model
This model forecasts future metric values by analyzing past trends and seasonal patterns, while also understanding system limits, such as maximum disk capacity. It predicts when a resource is on a trajectory to hit its limit. This enables teams to perform proactive capacity planning and prevent resource-exhaustion outages well before they occur.
LightGBM
LightGBM is a highly efficient machine learning framework used here to build forecasting models. It can process numerous influencing factors simultaneously to generate highly accurate predictions. Its speed and scalability make it possible to provide reliable forecasts for thousands of metrics across a large and complex environment.
Open Source Models
Other algorithms from several open-source libraries used for Selector’s AI and ML features include:
scikit-learn. SciKit-Learn is an ML package for Python.
PyTorch. The PyTorch Foundation is the deep learning community home for the open source PyTorch framework and ecosystem.
spaCy. This is a free, open-source library for natural language Ppocessing in Python. It features named-entity recognition (NER), part of speech (POS) tagging, dependency parsing, word vectors, and more.
mlxtend is a Python library of useful tools for the day-to-day data science tasks, including logistic regression, random forest, RBF kernel SVM, and ensemble diagrams.
7 - Selector Role-Based Access Control
Overview
Selector supports a robust role-based access control (RBAC) model that allows for flexible and right-scoped permissions and resource access.
Selector supports three out-of-box default roles along with highly flexible custom roles. Users can be dynamically mapped to these roles based on required permissions.
In all contexts, System resources refer to users, roles, system settings, API keys, and more. Internal system resources refer to internal platform systems such as Kafka, MongoDB, and so on.
All roles can be inspected by navigating to the Roles information in the S2AP user interface settings, as shown below (Roles is the third item in the drop-down list on the right):
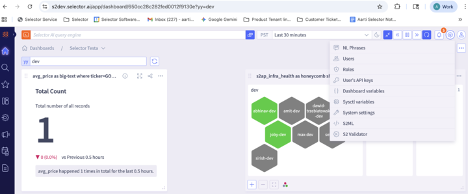
This document content is organized as follows:
- Out-of-box role: Admin
- Out-of-box role: Regular
- Out-of-box role: Read Only
- Custom Roles
- S2AP User-to-Role Mapping
- Summary
Out-of-Box Role: Admin
The Admin role provides Full permissions (Read, Write, Modify, Delete) access to everything.
- Full permissions across dashboards, widgets created by any user
- Full permissions for all integrations.
- Full permissions to all system resources (users, roles, system settings, and all API keys)
- Full Access to internal system resources like Kafka, MongoDB
The Admin role details can be viewed through the user interface:
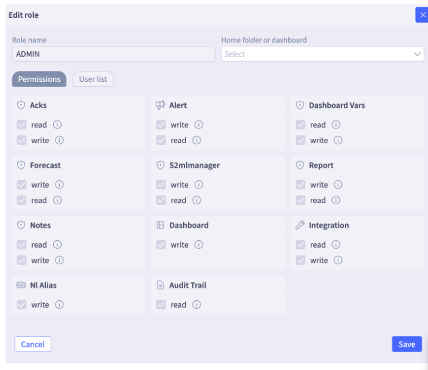
Out-of-Box Role: Regular
The Regular role provides a more restricted access.
- Full permissions for dashboards, widgets.
- Read permissions for Integrations.
- Full permissions for system resources created by that user only (example, API keys). No permissions to system resources of other users.
- No permissions to internal system resources.
The Regular role details can be viewed through the user interface:
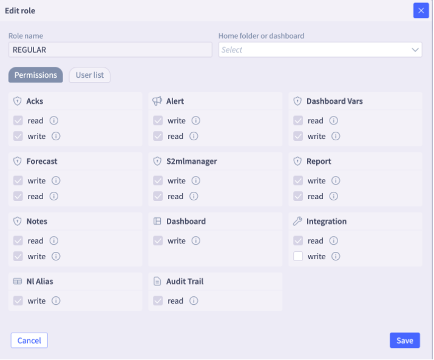
Out-of-Box Role: Read Only
The Read Only role provides the most restricted access
- Read only permissions for all dashboards, widgets.
- Read Only permissions for Integrations.
- Read, Write, Modify, Delete access to their own system resources (ex. API keys). No permissions to system resources of other users.
- No access to internal system resources.
The Read Only role details can be viewed through the user interface:
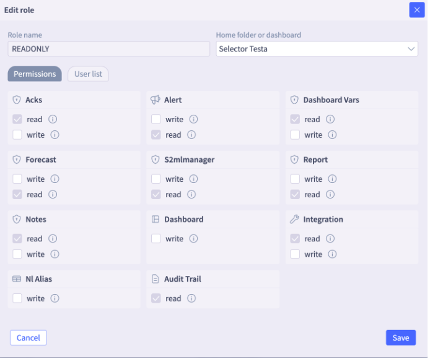
Custom Roles
Selector also supports Custom Roles that allow assigning any flexible combination of permissions
- Flexible permissions (as configured) limited to the dashboards they are assigned to.
- Read, Write, Modify, Delete access to their own system resources (ex. API keys). No permissions to system resources of other users.
- No access to internal system resources.
The Custom role details can be configured through the user interface:
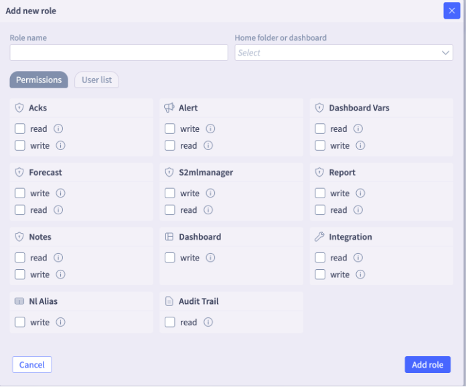
S2AP User-to-Role Mapping
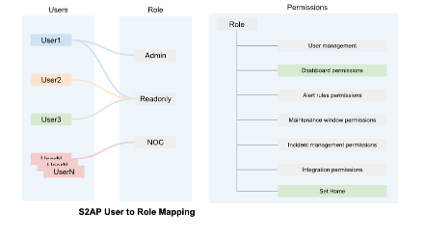
In the RBAC system, users are mapped to various roles, and the roles are linked to permissions to accomplish certain tasks, such as managing users or permissions for alert rules. There can be multiple users per role, and role permissions can be customized to fit the organization’s needs.
Selector Offers Comprehensive Security
In summary, the S2AP system offers a comprehensive and flexible role-based access model that allows Selector customers to adhere to secure, least-privilege principles to allow users to remotely access resources in their network. Key features include:
- API, UI support
- Integration with any generic OIDC IDP for Single Sign on (SSO)
- Dynamic SSO based role, attribute mapping
- Comprehensive audit trail for all S2AP interactions across users, resources and platform stacks
8 - Support & Training
8.1 - Selector Support
Selector System Support
Selector has extensive experience in the telecommunications industry and counts seven Tier-1 ISPs as customers. The founding team has a collective 95 years in the networking industry with most of that time specifically focused on ISPs.
Initial System Customization and Deployment
Selector supports very large-scale service providers and enterprises worldwide and has teams located in the US, Canada, Europe, Asia, and India to ensure a seamless deployment experience. In one large-scale deployment, Selector is the primary operational tool for frontline NOC personnel and SRE teams. The customer operates a “follow the sun” support model and Selector has geo-redundant teams.
Recently Selector replaced Broadcom CA Spectrum in a large multinational enterprise with over 15,000 locations; the entire deployment needed to be finished in 90 days due to contractual requirements of the legacy vendor. Selector assigned an overall program manager along with several dedicated solutions and platform engineering teams to ensure a successful cutover. At the same time, Selector built and owned the project plan and reporting to the executive management teams.
While lessons learned from deployments are used to improve overall performance, each customer deployment is considered unique and a deployment plan is built tailored to the outcomes and priorities of the customer.
Selector supports several platforms and tools to engage with customer teams before, during, and after the deployment to ensure effective communication. Jira is used inside Selector to manage sprints and customer stories. Customers have access to the Jira system for creating tickets and viewing status. MS Teams and Slack are channels are uses for collaboration across various departments (Tier 1 Support, SRE, NRE, and so on).
Maintenance and Governance
The Selector platform is based on continuous delivery as a service. There are regression test suites run alongside testing on staging environments before promoting a release as production. In addition, these are tested on customer staging environments before upgrading the customer production environment.
Minor service changes can be achieved without system downtime by utilizing a multi-node cluster. Major changes may have small periods of downtime and are always scheduled with the customer.
Development environments are used to test any changes prior to use within production environments.
New product capabilities such as new data sources, new notification endpoints, integrations, and so on, are generally done through code updates through Git-based systems and do not require service restarts or platform disruptions.
Selector does not charge for support and maintenance activities. Software patches and updates are readily available to all customers with an active subscription and are automatically applied by your account team.
Service SLAs
Here is the standard Selector support agreement with severity identification, contact method, and SLA response.
“Standard Contact” means the Support Portal (for example, JIRA Service Desk) through which a Support Ticket is submitted to Selector AI.
“Priority Contact” means the priority phone number separately provided by Selector for Customer’s Severity Level 1 or Severity Level 2 Issues.
| Severity Level | Contact Mechanism | Response Time SLA |
|---|
| “Severity 1” Service is down or there is a major malfunction resulting in a product inoperable condition. Users are unable to reasonably perform their important day-to-day functions; the affected functionality is mission-critical to the Customer’s business; and the situation is reasonably considered an emergency | Priority Contact:- Selector Support Center 1-866-95-AIOPS or 1-866-952-4677
- Direct 1-408-583-6385
| 1 Hour |
| “Severity 2” Critical loss of functionality or performance of the Service resulting in a high number of users unable to perform their important day-to-day functions. There is a major feature/product failure in the Service such that, while the Service is usable, it is severely limited. | Priority Contact:- Selector Support Center 1-866-95-AIOPS or 1-866-952-4677
- Direct 1-408-583-6385
| 2 Hours |
| “Severity 3” Moderate loss of functionality or performance in the Service resulting in multiple users impacted in their important, day-to-day functions. There is a minor feature/product failure or a minor performance degradation. | Standard Contact | 4 Business Hours |
| “Severity 4” Minor loss of functionality in the Service; product feature requests, and how-to questions. “How-to” questions may include questions related to use of the Service; integration, installation and configuration inquiries regarding the Service, enhancement requests, or documentation questions | Standard Contact | 3 Business Days |
8.2 - Selector Training
Selector Software Training
Training enables the customer team to fully utilize the Selector platform. This is achieved in several ways:
- On-site training sessions with key teams and stakeholders on how to use the Selector platform.
- Recorded training that can be published specific to the customer. These can be embedded into the customer’s learning platforms.
- If desired, Selector can host customer employees at corporate offices for in-person sessions with the Selector engineering teams. Attendees get dedicated sandbox environments for practice.
Selector also works with the customer to provide manuals in native languages as needed.
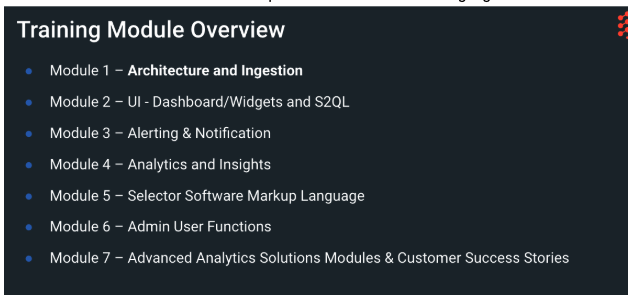
9 - Selector API Usage Guide
Selector System API Usage Information
This document describes Selector API usage for various categories.
Authentication
Bearer Token (using API_KEY placeholder): All API requests require a Bearer token for authentication. In the examples below, replace API_KEY with your actual token. The token is passed in the Authorization header as a Bearer token.
To create your API_Key, go to your profile, then select My API Keys.
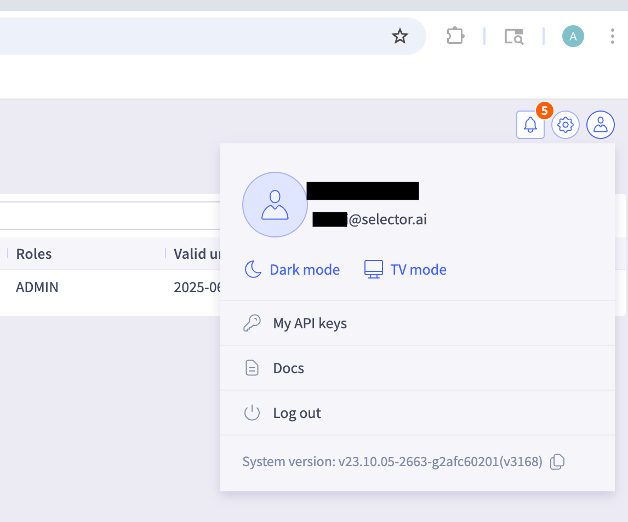
Sample Schema and Base URL
Schema
The following inventory schema is used in API the following examples:
Inventory name: device_test
Primary keys: hostname and ip
Contents
All the following examples assume that the base URL for the Metastore APIs is:
https://<customer-tenant-name>.selector.ai/docs/apis/metastore2-inventory-manager/
The examples in this document use demo.selector.ai as the base URL.
The appropriate API endpoint URL must be appended to the base URL when you call the APIs.
This section describes the v1 Inventory management APIs used for managing entries in a device inventory. These entries use the system generated id for inventory management.
Selector customers, please refer to https://<customer-tenant-name>.selector.ai/docs/apis/metastore2-inventory-manager/ for a complete list of Selector Metastore2 APIs.
Adding an Entry to an Inventory
POST Entry to Inventory
Method/Endpoint: POST /api/inventory-manager**/**v1/inventory/{name}
URL:
https://demo.selector.ai/api/inventory-manager/v1/inventory/device_test
Payload:
{
    "hostname": "host1",
    "ip": "10.1.1.1",
    "region": "us-west",
    "age": "7"
}
POST Entry Response (201 OK)
{
    "message": "Added new item to device_test",
    "response": {
        "hostname": "host1",
        "ip": "10.1.1.1",
        "region": "us-west",
        "age": 7,
        "id": "AABBCCDD-1234-1234-1234-AABBCCDDEEFF",
        "__s2_expiry": "2025-07-31T21:52:04.705402+00:00"
    }
}
NOTE: For possible error responses, see the section on “Error Handling.”
Back to Contents
Retrieving All Entries in an Inventory
GET All Entries
Method/Endpoint: GET /api/inventory-manager/v1/inventory/{name}
URL:
https://demo.selector.ai/api/inventory-manager/v1/inventory/device\_test
GET All Response (201 OK)
[
  {
    "hostname": "host1",
    "ip": "10.1.1.1",
    "region": "us-west",
    "age": "7",
    "_ctime": 1755025254,
    "_utime": 1755025254,
    "id": "AABBCCDD-1234-1234-1234-AABBCCDDEEFF",
  },
  {
    "hostname": "host2",
    "ip": "10.1.1.2",
    "region": "us-east",
    "age": "10",
    "_ctime": 1755025273,
    "_utime": 1755025273,
    "id": "AABBCCDD-1234-1234-1234-AABBCCDDEEFF",
  },
  {
    "hostname": "host3",
    "ip": "10.1.1.3",
    "region": "eu-west",
    "age": "7",
    "_ctime": 1755027415,
    "_utime": 1755027415,
   "id": "AABBCCDD-1234-1234-1234-AABBCCDDEEFF",
  },
  {
    "hostname": "host4",
    "ip": "10.1.1.4",
    "region": "mexico-central",
    "age": "10",
    "_ctime": 1755027712,
    "_utime": 1755027712,
    "id": "AABBCCDD-1234-1234-1234-AABBCCDDEEFF",
  }
  {
    "hostname": "host5",
    "ip": "10.1.1.5",
    "region": "us-central",
    "age": "10",
    "_ctime": 1755030717,
    "_utime": 1755030717,
    "id": "AABBCCDD-1234-1234-1234-AABBCCDDEEFF",
  }
]
Back to Contents
Retrieving a Single Entry from an Inventory
GET Single Entry
Method/Endpoint: GET /api/inventory-manager/v1/inventory/{name}/{id}
NOTE: This retrieves a single entry using inventory name and id, which is the ID generated when the entry was first created. See “Adding an Entry to an Inventory.”
URL:
https://demo.selector.ai/api/inventory-manager/v1/inventory/device\_test/891e8d7e-cfe7-4f80-896f-52ea7de8df0b
GET Single Response (201 OK)
[
  {
    "hostname": "host1",
    "ip": "10.1.1.1",
    "region": "us-west",
    "age": "7",
    "_ctime": 1755025254,
    "_utime": 1755025254,
    "id": "AABBCCDD-1234-1234-1234-AABBCCDDEEFF",
  }
]
Back to Contents
Modifying a Single Entry in an Inventory
PUT Single Entry
Method/Endpoint: PUT /api/inventory-manager/v1/inventory/{name}/{id}
NOTE: This modifies a single entry using inventory name and id, which is the ID generated when the entry was first created. See “Adding an Entry to an Inventory.”
URL:
https://demo.selector.ai/api/inventory-manager/v1/inventory/device\_test/b0538634-1085-4534-b889-0b7c2f2ddad1
Payload:
{
  "hostname": "host5",
  "ip": "10.1.1.5",
  "region": "us-central",
  "age": 7
}
PUT Single Response (201 OK)
{
 "message": "Updated item to device_test",
  "response": {
    "hostname": "host5",
    "ip": "10.1.1.5",
    "region": "us-central",
    "age": "7",
    "id": "AABBCCDD-1234-1234-1234-AABBCCDDEEFF",
    "__s2_expiry": "2025-08-12T20:38:36.189678"
  }
}
Back to Contents
Deleting a Single Entry from an Inventory
DELETE Single Entry
Method/Endpoint: DELETE /api/inventory-manager/v1/inventory/{name}/{id}
NOTE: This deletes a single entry using inventory name and id, which is the ID generated when the entry was first created. See “Adding an Entry to an Inventory.”
URL:
https://demo.selector.ai/api/inventory-manager/v1/inventory/device\_test/b0538634-1085-4534-b889-0b7c2f2ddad1
DELETE Single Response (200 OK)
{
  "message": "Updated item to device_test",
  "response": {
    "hostname": "host5",
    "ip": "10.1.1.5",
    "region": "us-central",
    "age": "7",
    "id": "AABBCCDD-1234-1234-1234-AABBCCDDEEFF",
  }
}
Back to Contents
This section describes how the newer v3 Inventory management APIs that are used with primary keys to manage entries in a device inventory in a simplified manner.
Selector customers, please refer to https://<customer-tenant-name>.selector.ai/docs/apis/metastore2-inventory-manager/ for a complete list of Selector Metastore2 APIs.
Retrieving a Single Entry in an Inventory
GET Single Primary
With v3 API it is possible to retrieve a single entry in an inventory using all primary keys or with a single primary key when multiple primary keys are present.
Example using ALL primary keys:
Method/Endpoint: GET /api/inventory-manager/v3/inventory/{name}/items?key1=value1&key2=value2
Retrieves a single entry using inventory name and primary keys (example, hostname and ip)
URL:
https://demo.selector.ai/api/inventory-manager/v3/inventory/device\_test/items?hostname=host1\&ip=10.1.1.1
GET Single Primary Response (201 OK)
[
  {
    "hostname": "host1",
    "ip": "10.1.1.1",
    "region": "us-west",
    "age": "7",
    "_ctime": 1755025254,
    "_utime": 1755025254,
    "id": "AABBCCDD-1234-1234-1234-AABBCCDDEEFF",
  }
]
Back to Contents
Example using a single primary key (but not ALL primary keys, as above):
Method/Endpoint: GET /api/inventory-manager/v3/inventory/{name}/items?key1=value1 OR key2=value2
Retrieves a single entry using inventory name and any of the primary keys (example, hostname OR ip)
URL:
https://demo.selector.ai/api/inventory-manager/v3/inventory/device\_test/items?hostname=host1
GET SIngle Primary Response (201 OK)
[
  {
    "hostname": "host1",
    "ip": "10.1.1.1",
    "region": "us-west",
    "age": "7",
    "_ctime": 1755025254,
    "_utime": 1755025254,
    "id": "AABBCCDD-1234-1234-1234-AABBCCDDEEFF",
  }
]
NOTE: In the above example if there are multiple entries for hostname=host1, the response will return all of them.
Back to Contents
Adding a Single Entry to an Inventory
POST Single Entry
Method/Endpoint: POST /api/inventory-manager/v3/inventory/{name}/items?key1=value1&key2=value2
Adds a single entry using inventory name and primary keys
URL:
https://demo.selector.ai/api/inventory-manager/v3/inventory/device\_test/items
Payload:
{
"hostname": "host5",
"ip": "10.1.1.5",
"region": "us-central",
"age": "7"
}
POST Single Entry Response (201 OK)
{
"message": "Added new item to device_test",
"response": {
"hostname": "host5",
"ip": "10.1.1.5",
"region": "us-central",
"age": "7",
"id": "AABBCCDD-1234-1234-1234-AABBCCDDEEFF",
"__s2_expiry": "2025-08-12T20:38:36.189678"
}
}
Back to Contents
Modifying a Single Entry in an Inventory Using Primary
PUT Single Primary Inventory
Method/Endpoint: PUT /api/inventory-manager/v3/inventory/{name}/items?key1=value1&key2=value2
Modifies a single entry using inventory name and primary keys
URL:
https://demo.selector.ai/api/inventory-manager/v3/inventory/device_test/items?hostname=host5&ip=10.1.1.5
Payload:
Single Primary Response (201 OK)
{
  "message": "Updated successfully",
  "response": {
    "hostname": "host5",
    "ip": "10.1.1.5",
    "region": "us-central",
    "age": "20",
    "_ctime": 1753998724,`
    "_utime": 1753999115,`
    "id": "AABBCCDD-1234-1234-1234-AABBCCDDEEFF"
  }
}
Back to Contents
Deleting a Single Entry from an Inventory Using Primary Keys
DELETE Single Entry Using Primary
Method/Endpoint: DELETE /api/inventory-manager/v3/inventory/{name}/items?key1=value1&key2=value2
Deletes a single entry using inventory name and primary keys
URL:
https://demo.selector.ai/api/inventory-manager/v3/inventory/device\_test/hostname=host5\&ip=10.1.1.5
DELETE Single Entry Response (200 OK)
 {
  "message": "Deleted successfully from device_test"
  }
Back to Contents
Executing S2QLs with APIs
Selector provides the ability to use APIs to query the data that have been ingested. The APIs wrap the entire command into the payload, allowing a user to either employ a natural language (NL) query or use an S2QL command to obtain the data.
Example of an S2QL command:
S2QL (Selector Query Language) follows this general pattern:
1 | #select [fields] as [visualization] where [conditions] group-by [fields] order-by [field] top [N] |
|---|
[fields] specifies which columns to retrieve from
which source (table), device, ipaddress in s2_device_inventory
[visualization] specifies how the information is rendered, or displayed.
Selector supports the following:
table- Tabular data displaytimeline-heatmap- Time-series heatmaphoneycomb- Honeycomb visualization for healthbig-text- Large text display for single valuestopology- Network topology diagramline-plot- Line chartsunburst- Hierarchical sunburst chartevent-plot- Event timelinelog-table- Log viewerjson- Raw JSON outputdrilldown- Drillable hierarchical view
Filtering with “where” for example where device=FW1
Grouping and aggregation for display, for exsmple group-by site, or group-by type
Ordering and limiting, for example order-by max top 10
Example curl Command
To use a curl command, choose a given widget of interest, then click on the circled “i” for additional information. This provides an option for creating a curl command that leverages the NL Query API:
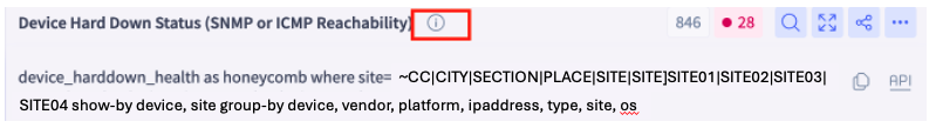
URL:
curl -X POST https://<customer-tenant-name>.selector.ai/api/collab2-slack/rules/command \
-H ‘Authorization: Bearer $APIKEY’ \
-H ‘Content-Type: application/json’ \
-d ‘{“command”:"#select device_harddown_health as honeycomb where site=~CC|CITY\SECTION|SITE|SITE01|SITE02|SITE03|SITE04|SITE05 show-by device, site group-by device, vendor, platform, ipaddress, type, site, os",“utc_offset_sec”:-14400}’
Back to Contents
POST API Example
Method/Endpoint: POST /api/collab2-slack/command
Payload:
{
  "command": "#select device_harddown_health as honeycomb where site=~CC|CITY\SECTION|SITE|SITE01|SITE02|SITE03|SITE04|SITE05 show-by device, site group-by device, vendor, platform, ipaddress, type, site, os",
  "utc_offset_sec": -14400
}
POST RESPONSE (200 OK)
{
  "meta": {
    "render": "honeycomb",
    "threshold": {
      "baseline": "programmed",
      "t0": 0.1,
      "t1": 0.5
    },
    "query": {
      "columns": [
        {
          "name": "device_harddown_health",
          "agg_func": [
            "max"
          ],
          "as_name": "device_harddown_health",
          "alias": null
        },
        {
          "name": "device_harddown_health_color",
          ......
            {
              "name": "long"
            }
          ],
          "render": {
            "annotate": {
              "multiplier": 1,
              "units": "status",
              "values": "device_harddown_health"
            },
            "color-map":,
            "columns": "device",
            "map": {
              "city_geo_codes": [
                {
                  "city": "Phoenix",
                  "lat": 33.5722,
                  "lng": -112.0891,
                  "state_id": "AZ",
                  "state_name": "Arizona"
                },
                {
                  "city": "Las Vegas",
                  "lat": 36.2333,
                  "lng": -115.2654,
                  "state_id": "NV",
                  "state_name": "Nevada"
                }
              ]
            }
          }
        }
      ]
    }
  }
}
Back to Contents
Maintenance Window APIs
A Maintenance Window defines a scheduled period when a monitored entity is expected to be unavailable or undergoing changes. The core function is to inform monitoring and alerting systems to temporarily suppress notifications related to the specified integration during the defined time frame, preventing alert noise from planned outages.
This section describes the Maintenance Window APIs which allow for the scheduling, retrieval, and management of planned downtime periods.
Selector customers, please refer to https://\<customer-tenant-name>.selector.ai/docs/apis/metastore2-inventory-manager/ for a complete list of Selector Maintenance Window APIs.
Get Configurations for All Maintenance Windows
GET Maintenance Window Configs
Method/Endpoint: GET /api/apiserver2/api/v2/maintwindow
URL:
https://demo.selector.ai/api/apiserver2/api/v2/maintwindow/
GET Maintenance Window Response (201 OK)
[
  {
    "name": "Global",
    "suppress_alerts": true,
    "global_scope": true,
    "recurring_window": null,
    "description": "User_Test_MW",
    "created_by": "user@example.com",
    "created_at": "2025-08-12 16:09",
    "active": false,
    "alert_name": "user_test_alert",
    "labels": [
      {
        "key": "name",
        "value": [
          "VPN2"
        ]
      }
    ],
    "tags": [],
    "activation_date": "2025-08-12 16:07",
    "timezone": "America/Los_Angeles",
    "end_date": "2025-08-15 16:07",
    "duration_value": 3,
    "duration_units": "d",
    "duration_set": true,
    "recurring": null,
    "uuid": "AABBCCDD-1234-1234-1234-AABBCCDDEEFF",
    "__s2_integration_name": "maintwindow",
    "__s2_obj_version": "v2"
  }
]
Back to Contents
Other Operations for Specific Maintenance Windows
You can execute other maintenance window configuration operations such as POST and GET.
Method/Endpoint: POST /api/apiserver2/api/v2/maintwindow
Method/Endpoint: GET /api/apiserver2/api/v2/maintwindow/{integration_name}
DELETE Maintenance Window Configuration
Method/Endpoint: DELETE /api/apiserver2/api/v2/maintwindow/{integration_name}
Deletes the specific maintenance window config with the specified name
URL:
https://demo.selector.ai/internal/apiserver2/api/v2/maintwindow/user\_test\_MW2
Delete Maintenance Window Response (201 OK)
{
  "message": "Deleted Integration(s) user_test_MW2"
}
Back to Contents
Error Handling
If an operation is unsuccessful, the API returns an error response, typically with a 4xx or 5xx HTTP status code and a JSON body describing the error.
401 Unauthorized or 403 Forbidden
Returned if the Bearer token (represented by API_KEY) is missing, invalid, expired, or lacks permissions for the requested operation.
404 Not Found
Returned if the inventory name or entry ID does not exist.
Example error body: UploadInventoryEntryNotFound: {"message": "Inventory entry does not exist"}
Example error body: UploadInventoryNotFound: {"message": "Table does not exist"}
409 Conflict
Returned if attempting to create an entry with a device_name and device_ip combination that already exists.
422 Unprocessable Entity
Returned if the request body is invalid or missing required fields (for example, missing device_name or device_ip on creation).
Example error body: {"detail": [{"loc": ["body", "device_name"], "msg": "field required", "type": "value_error.missing"}]}
Always check the HTTP status code and the response body for details in case of an error.
Back to Contents
10 - Release Notes
10.1 - Selector Release Notes Version 3686 Oct 6 to Dec 15 2025
Release Notes for Selector AI software releases
Selector Release Notes for Version 3686
New Features and Enhancements
Slack Bot Usage Metrics
A new queryable fetches Natural Language queries and its usage metrics: s2_query_trace
You can find the user who executed the query, the s2ql query, the status, and the time it took to return the response.
For example, you can display the results of the s2_query_trace as a table:

Or you can display the s2_query_trace queryable in a dashboard (see lower right panel):
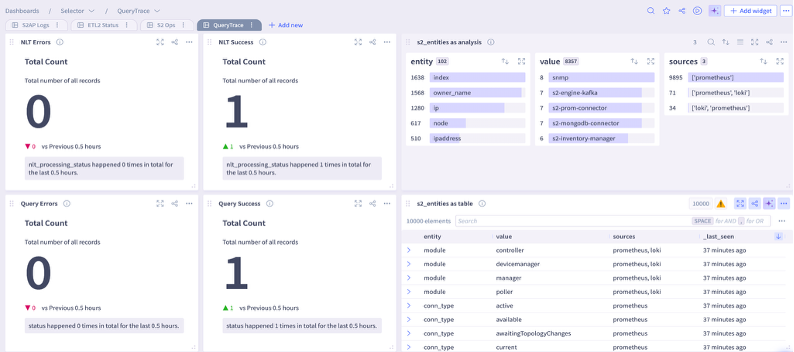
Disable or Remove Inactive Users
Identity Access Management (IAM) now monitors and disables or deletes users who have been inactive for a specified number of days.
You enable this setting by initiating a request to Selector Software or Customer Success representatives.
Customers now have the ability to define custom thresholds for any fixed pipeline. This allows customers greater granularity to set thresholds for each vendor.
For example, you can configure separate thresholds for the CPU utilization metric for each vendor such as Cisco, Arista, Fortigate, and so on.
You configure this feature by initiating a request to Selector Software or Customer Success representatives.
Enhanced Dashboard Variables in NL Queries
Queries can use predefined variables, retrieve the default values, and use those values for query building. This feature integrates Dashboard variable resolution into the existing Natural Language Translation (NLT) query system.
For example, if the s2ql query is device_status as big-text where fqdn=~{{test-device-sw}} and the NL phrase is how is test-device-sw, the correct response is returned.
Sorting Capabilities in UDF Tables
Sorting is available for tables using a transform User-Defined Function (UDF) to allow a customer-preferred sorting order.
This feature enhances the current supported S2AP UI sorting by adding support for sorting of UDF tables
For example, the query name,aggregate.count:No_of_job_ids in automation_observability_state as table where hasParent =no group-by name order-by aggregate.count:desc in last 7 days produces the result sorted by the aggregate count in descending order.
10.2 - Selector Release Notes Version 3531 Jul 15 to Oct 1 2025
Release Notes for Selector AI software releases
Selector Release Notes for Version 3531
New Features and Enhancements
New Toggle for PKCE
A new toggle for the PKCE option for OIDC is included for SSO Configuration (see bottom toggle below)
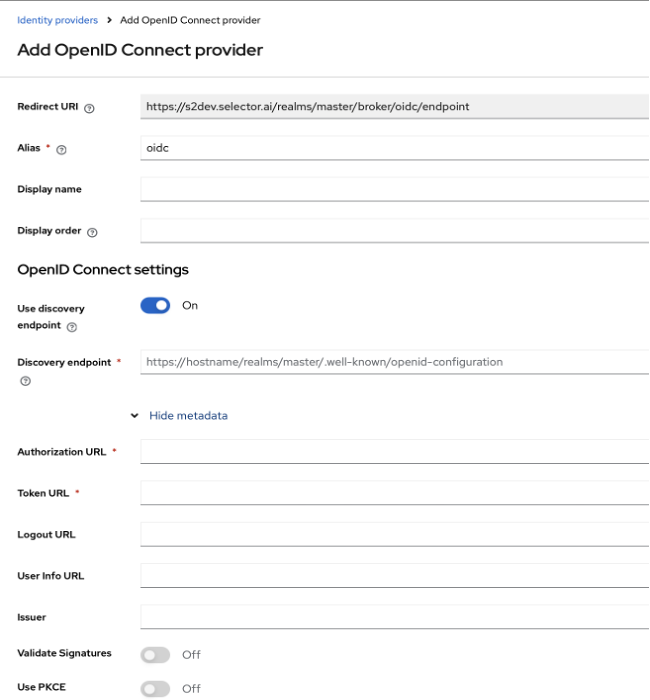
Password Policy Restrictions for Local Users
Password policy restrictions for Local user accounts are modified for better access security.
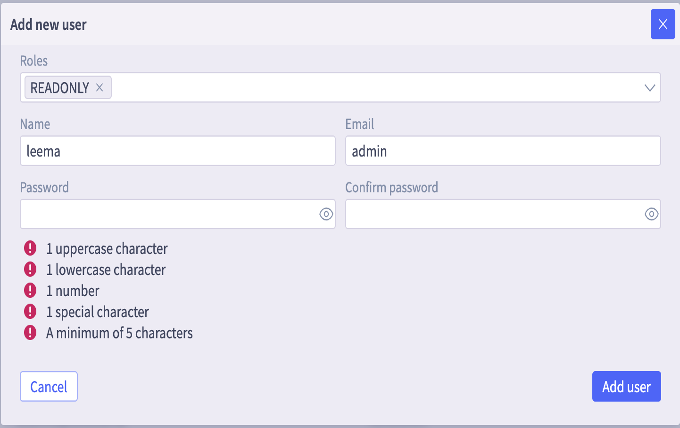
Notification Provider and Rest Poller Password Masked
Notification provider and Rest poller configuration passwords are masked for better security.
Change the type field to “secret” in any existing configuration (see bottom field in figures below).
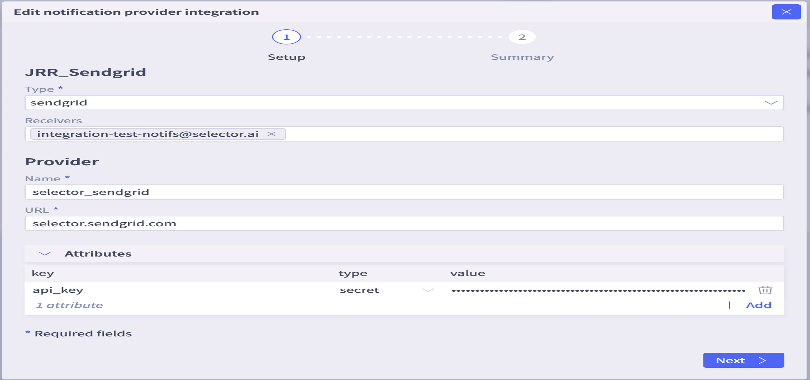
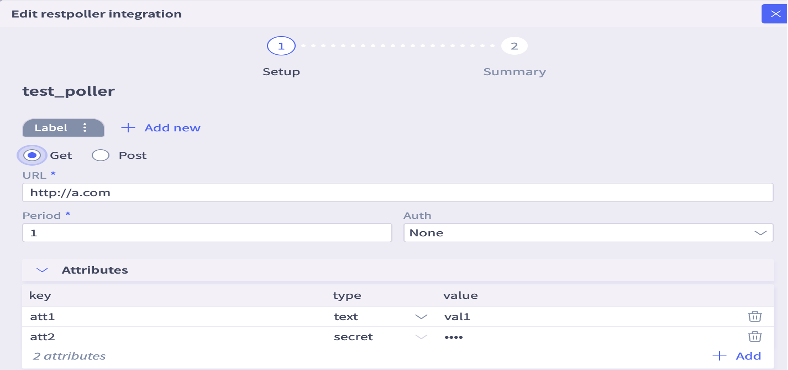
Telemetry of Most Used NL Alias Included
Note listing in figure below.
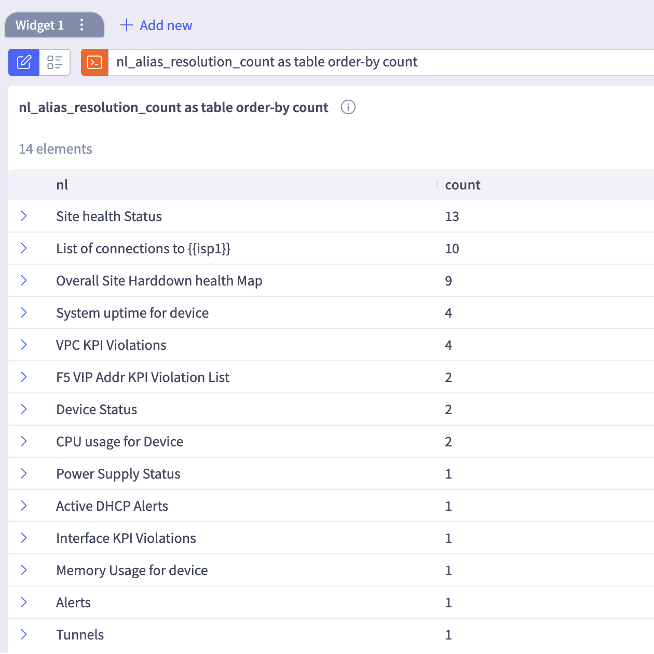
Display Thresholds on Line Plots
When more than one KPI is present in a lineplot, you need to click on a single KPI to know its corresponding threshold value.
Option to Edit IP Address or Hostname in Device Inventory
There is now an option to edit the IP address or hostname in the device inventory.
Customers often have a huge inventory of devices from different vendors. As new devices are added, customers often want to conserve their IP addresses, and assign a new device an existing IP address. Since device and IP are the primary keys in the device_inventory table, customers had to delete the previous entry and add a new one which is manually intensive.
With this feature, S2AP now supports editing primary keys in Metastore Inventories. This enables customers to easily automate API operations, with minimum information, allowing faster operations that are less prone to errors.
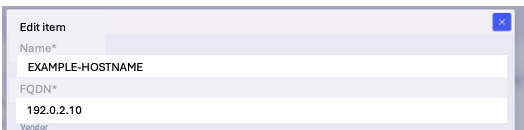
SNMP Traps Included in Correlation Engine
SNMP traps can be included in correlation engines in addition to syslogs for providing better insights.
Role Mapping Support
Selector now supports dynamically mapping fields from customer’s SSO to appropriate RBAC on the S2AP platform at login time. Role Mappers can be configured in the S2AP UI providing default role mapping as well as support for SSO Claims mapping (groups etc.). This is supported across such as Azure, Google, Okta as well as any generic OIDC capable IDP.
In this way, Selector ensures an enterprise-grade experience for customers: secure right-scoped role-based user access adhering to least privilege principles. This feature enables customers to meet their user access compliance needs.
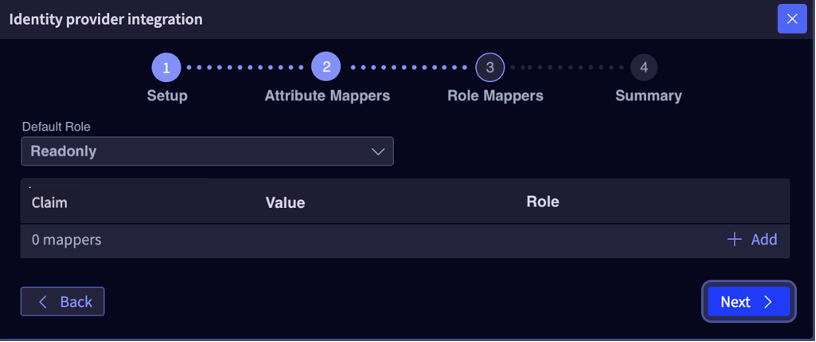
Admin Experience Enhancements
Enhanced Topology Map
The topology map view is now enhanced to show direct routes.
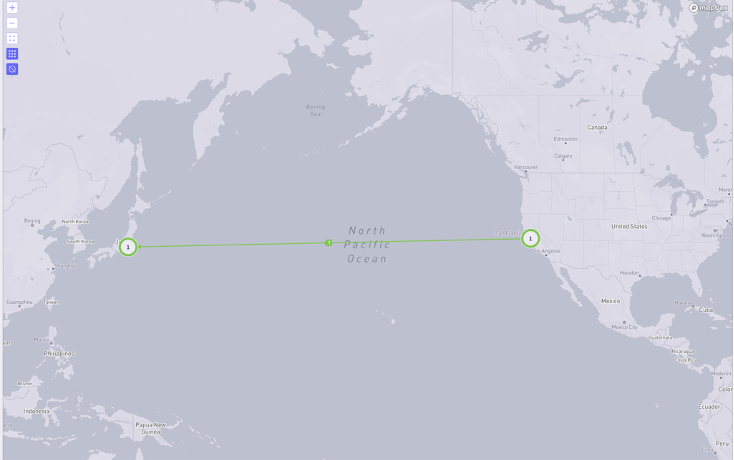
Timezone and Timestamp Hover
You can now hover and view timezone and timestamp information for better visibility.
Widget descriptions are now included for drilldown queries.
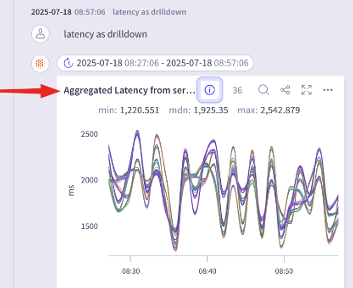
The v1 version of Inventory management APIs used for managing entries in a device inventory used a system generated id for inventory management operations like GET, PUT, DELETE.
The Metastore2 Inventory Management APIs have been enhanced to perform operations using Primary Keys.
These are the v3 APIs. This greatly simplifies the device inventory management operations for customers who can use known primary keys rather than requiring them to track a random internal system ID.
With v3 APIs it is possible to retrieve a single entry in an inventory (GET operation) using all primary keys or with a single primary key when multiple primary keys are present.
The example below shows PUT and DELETE operations with Primary keys:
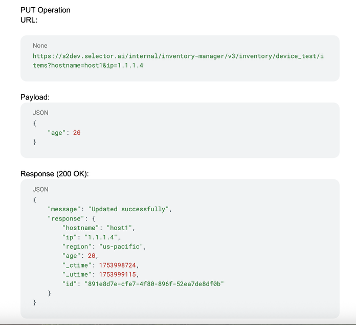
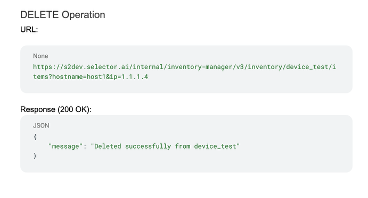
Primary keys for device_test inventory are ip and hostname, the example below shows a GET operation with only one of two primary keys:
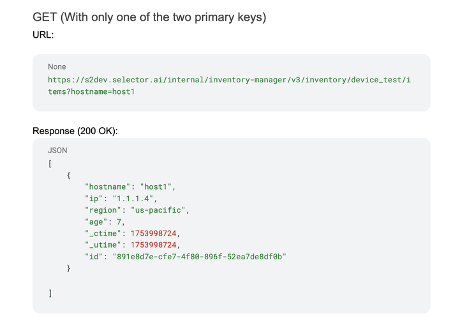
10.3 - Selector Release Notes Version 3379 May 5 to July 14 2025
Release Notes for Selector AI software releases
Selector Release Notes for Version 3379
New Features and Enhancements
Selector support with MCP
Selector supports the Model Context Protocol (MCP) which provides a standard way for AI models/LLMs to communicate with a variety of data sources and tools (similar to plugging in a standard USB device), providing an enhanced querying experience to customers,
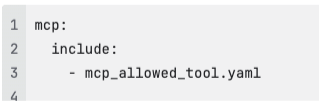
Selector’s MCP Server enables Claude Desktop to securely interact with Selector’s APIs, run queries, and access AI-powered tools-all via the Model Context Protocol (MCP).
The following tools are integrated with MCP server:
ask_selector: Allows users to send a chat-style question or content to the Selector AI and receive a conversational response. Input is validated using Pydantic and sent to the /api/collab2-slack/copilot/v1/chat endpoint.
query_selector: Enables execution of S2QL queries (structured queries for logs, events, or metadata) via the Selector backend. Only commands starting with #select are accepted, and results are fetched from /api/collab2-slack/command.
get_selector_phrases: Fetches predefined phrases or aliases from Selector, optionally filtered by a specified source (e.g., “user”, “s2ml”, or “widget”), using the /api/nlt2/alias endpoint.
Support Dashboard Variables in Natural Language (NL) Queries
The S2AP platform supports dashboard variables allowing the ability to filter on metastore entity properties such as site, model, vendor and devices for dashboard display. This feature extends Dashboard variable support to Natural Language queries while interacting with ChatOps interfaces in S2AP UI, or Collaboration tools like Slack or Microsoft teams, providing consistent and enhanced user experience with queries.
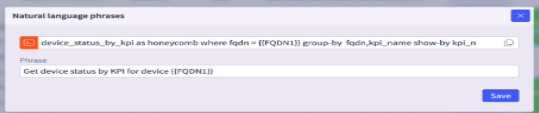
Netbox Enhancements
Netbox widgets are included into the Netbox folder, added to dashboards directory and it can support up to 20K entries.
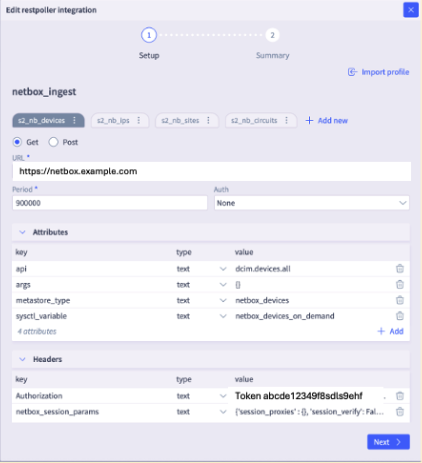
RBAC Enhancements
Selector supports secure and least privilege access principles by ensuring that only admin users have access to integrations, and S2AP internal systems like Mongo DB and Kafka. Non-admin users will not have access to these. If any data is accessed from Mongo DB or Kafka, access log is included for auditing purposes.
User have the ability to create and view aggregate routes:
- Authorized users can now create and view an aggregate collection for internet routes.
- Like the aggregate views provided for L3VPN routes, authorized users can now query the aggregate views for internet routes as well.
Admin Experience Enhancements
Maintenance window scope names are case insensitive
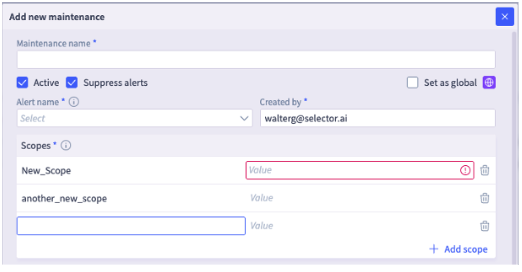
For better readability, dotted median lines in a Line Plot are optional.
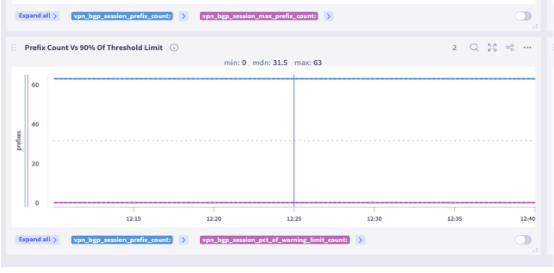
For mongodb, an IP address prefix, both the low and high value of the prefix range, is converted into a big integer (bigint) format. For example, the prefix 10.0.0.0/8 is converted into low bigint 167772160 and high bigint 184549375 for mongo aggregation pipelines.
Maintenence Window Creator
When duplicating the maintenance window, will now show ‘created by’ as ‘current logged in user’ instead of the originator.
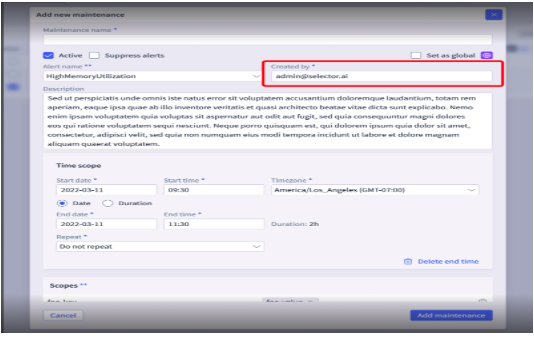
Topology View Lock Settings
You can lock the topology view settings (layout) so that it stays that way even with dashboard variables.
Alert/Notification Enhancements
Resolved alerts from Selector will be excluded from rate limiting features. This will allow ITSM(BigPanda) to get notified of resolved alerts resulting in improved alert management for customers.
In addition to the previously supported Sendgrid based notifications, Selector now allows customers to configure their SMTP server for email notifications and alerting, providing improved security and email management control for customers.