Selector AI and ML Models and Capabilities
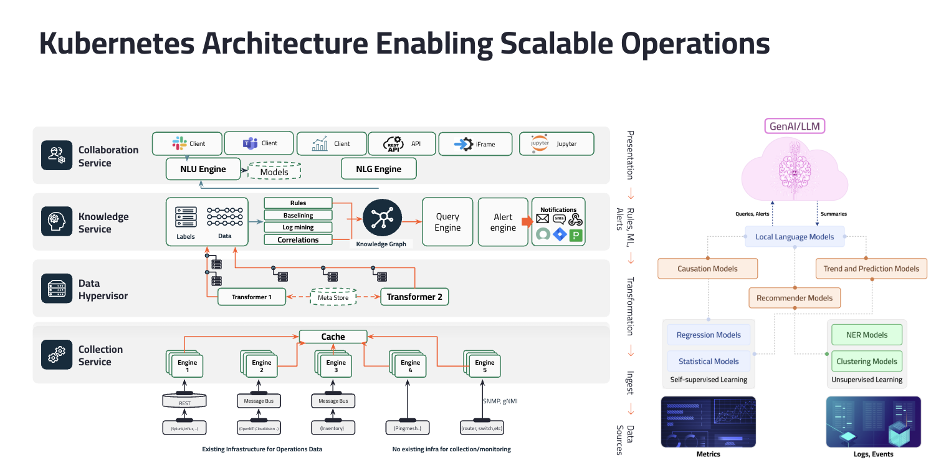
High Level Architecture
Selector uses a variety of models across the entire stack purpose built for solving various use cases from auto baselining metrics, translating unstructured logs into events, correlating various anomalies seen, identifying root cause, interacting with the platform in natural language and finally summarizations in copilot and events. This document provides additional information on each of the models used.
Selector Co-Pilot
The Selector Co-Pilot suite of technologies powers a conversational interface, allowing users to interact with complex system data using natural language.
Large Language Models (LLMs) using Gemini
Gemini is a family of advanced AI models that understands and processes human language. It serves as the “brain” for the Selector Co-Pilot, interpreting user questions and generating coherent, relevant answers. This provides an intuitive way for engineers to query system behavior without needing specialized languages, drastically speeding up investigation.
Sentence Transformers for Semantic Search
These models convert sentences into numerical representations that capture their underlying meaning. This enables the system to find information that is conceptually related to a user’s query, even if it doesn’t contain the exact keywords. The benefit is a more intelligent and accurate search that understands user intent, leading to faster discovery of relevant information. This technology is a core component of Selector’s Network Language Model (NLM).
Selector uses algorithms for several open-source libraries for its AI and ML features.
Several of these models can be tuned to be used for sentence or text-embedding generation. They can be used with the sentence-transformers package found at Hugging Face.
The Selector Network Language Model (NLM)
The Selector NLM allows:
- Embedding Queries: When an engineer types a natural language query like, “What was the root cause of the last production outage in San Jose?” the Sentence Transformer model converts this entire question into a numerical vector called an embedding. This vector represents the semantic meaning of the query.
- Embedding Data: Selector proactively does the same the data it ingests. Every log entry, alert, metric, and configuration item is also passed through the model and stored as a vector in a specialized database. A log message like “High latency detected for db-master-sjc-prod” and a user’s query about a “slowdown in San Jose” have very similar vector representations.
- Vector Search: The system performs a vector search (or similarity search). It takes the vector from the user’s query and instantly finds the data vectors in its knowledge base that are mathematically closest. “Closeness” in this vector space equates to semantic relevance.
Selector finds the right answers even if the terminology doesn’t match exactly. A query for “application slow” can correctly match alerts about “high response time” or “transaction latency exceeded” because the model understands these concepts are related.
BM25 for Lexical Search
BM25 is a powerful algorithm that ranks search results based on keyword relevance. It complements semantic search by quickly finding exact matches for specific terms, error codes, or hostnames mentioned in a query. This hybrid approach ensures that search is both fast for simple terms and context-aware for complex questions.
PydanticAI Framework for LLM Interaction
This framework imposes structure and validation on the data flowing to and from the LLM. It ensures that user requests are correctly formatted for the AI and that the AI’s responses are reliable and predictable. This enhances the overall stability and accuracy of the Co-Pilot, making it a trustworthy tool for critical operations.
Correlations
These methods automatically identify relationships between different system signals (metrics, logs, traces) to surface the bigger picture during an incident.
Self-Supervised Deduplication
This technique uses machine learning to automatically identify and group redundant or similar alerts and events. It learns what constitutes a “duplicate” from the data itself, without needing human input. This massively reduces alert noise, allowing operators to focus on unique issues rather than being overwhelmed by repetitive notifications.
Temporal Proximity Filtering
This method groups events that occur closely together in time, operating on the principle that things happening around the same time are often related. It’s a fast and effective way to build a preliminary timeline of an incident. This provides an initial, high-level context that helps engineers understand how an issue unfolded.
Recommender Systems-Based Algorithm
Selector uses collaborative filtering algorithms. Traditionally, collaborative filtering recommends items to users based on the preferences of similar users. In the context of AIOps, Selector repurposes this technique to correlate anomalous events. Instead of users and products, the platform analyzes the “behavior” of various system components, metrics, and logs.
The process begins with the ingestion and enrichment of metrics and logs, from network devices, cloud infrastructure, and applications. This data is then transformed into a format that the machine learning models can understand, a process that involves creating detailed “embeddings” or representations of each data point. These embeddings capture the essential characteristics and context of the operational data.
This is where the recommender system comes into play. By applying collaborative filtering to these rich data embeddings, Selector can identify “similarities” between different anomalous events. If a particular type of network error frequently occurs in conjunction with a specific application performance degradation, the recommender system will learn this association. When a new anomaly is detected, the system can then recommend other related anomalies that are likely part of the same underlying issue.
Topology awareness
This involves understanding the map of how services, hosts, and applications are interconnected. The system uses this infrastructure map to trace how a problem in one area could logically impact another. This provides critical context, enabling the system to pinpoint the source of a problem by following the path of dependencies.
Selector automatically discovers and builds a model of the entire infrastructure environment. This includes:
- Network Topology: How routers, switches, firewalls, and other network devices are interconnected.
- Application Topology: The relationships between different microservices, applications, and the underlying infrastructure they run on.
- Service Dependency: How various services rely on each other to function correctly.
- Cloud Infrastructure: The connections between virtual machines, containers, and other cloud resources. This “digital twin” of the environment is continuously updated to reflect any changes, ensuring the model remains accurate.
Improving Correlation with Topology Context
Once this topological map is established, Selector uses it to enhance its correlation in several keyways:
- Focusing on Relevant Data: Instead of analyzing every single alert from every device, the system uses the topology to understand which components are related. When an issue is detected with a specific application, the correlation engine prioritizes data from the servers, and network segments that the application actually depends on. This drastically reduces noise and false positives.
- Tracing the Path of Failure: Topology awareness allows the system to trace the path of a problem as it propagates through the environment. It can follow the chain of events from a user-facing application error, down to the specific microservice, and further down to the underlying network issue that caused it. This ”service-aware” correlation is far more effective than just looking for simultaneous anomalies.
By combining its powerful machine learning and recommender systems with a deep understanding of the environment’s topology, Selector can quickly and accurately pinpoint the root cause of even the most complex issues.
Causations
This method goes beyond correlation to identify potential cause-and-effect relationships.
Associative rule mining sifts through historical incident data to discover strong “if-then” rules. For example, it might learn that “if service A shows high latency, then database B experiences a CPU spike 90% of the time”. This provides actionable insights that help teams move from reactive problem-solving to proactive prevention.
Metric Anomaly Detection
The following models continuously monitor system performance metrics to find abnormal behavior.
Self-supervised Learning
This method learns the “normal” behavior of a system directly from its operational data, without needing manual labeling. It then flags any deviation from this learned baseline as a potential anomaly. This allows the system to detect novel or “zero-day” issues that have never been seen before, providing a powerful layer of proactive monitoring.
Ensemble of Regression and Statistical Models
This method combines the predictions from multiple different anomaly detection models to make a more accurate final decision. By leveraging a diverse set of techniques, it can spot a wider variety of issues, from sudden spikes to subtle drifts. This ensemble approach improves detection accuracy and significantly reduces false positives, ensuring that alerts are trustworthy.
Advanced Log Mining
These techniques extract structured, meaningful information from messy, unstructured log data.
DBSCAN Clustering
DBSCAN is an algorithm that automatically groups similar log messages and isolates rare ones. It sifts through millions of logs to find the few that are different, which often indicate errors or critical events. This automates the tedious task of manual log review, quickly surfacing the “needle in the hay” that points to a problem’s cause.
Named Entity Recognition (NER)
NER automatically scans log text to identify and classify key entities like IP addresses, service names, file paths, or error codes. It transforms raw, unstructured text into structured, searchable information. This makes it possible to easily filter, aggregate, and correlate log data with other signals to get a complete picture of an issue.
A CMDB or inventory database contains a wealth of information, but much of it is often stored in free-form text fields like hostname, description, or notes. For example, a device’s hostname might be cr01.sjc02.prod.net.com. While a human engineer can instantly decode this as a core router (cr01) in San Jose (sjc02) in the production (prod) environment, a machine sees it as a single, meaningless string. Without context, the correlation engine can’t use this valuable information. The model identifies and extracts key business and operational entities. From cr01.sjc02.prod.net.com, it would extract:
Device Role: core-router
Location: san-jose-02
Environment: production
Metadata Tagging: These extracted entities are then applied as structured metadata tags to the device within Selector’s internal model. The single device is now enriched with multiple layers of context. This structured metadata acts as an input to the Selector’s correlation engine, dramatically improving its accuracy.
Trend and Forecasting
These models predict future system behavior to enable proactive planning and issue prevention.
Constraint-aware Auto Regressive Seasonal Model
This model forecasts future metric values by analyzing past trends and seasonal patterns, while also understanding system limits, such as maximum disk capacity. It predicts when a resource is on a trajectory to hit its limit. This enables teams to perform proactive capacity planning and prevent resource-exhaustion outages well before they occur.
LightGBM
LightGBM is a highly efficient machine learning framework used here to build forecasting models. It can process numerous influencing factors simultaneously to generate highly accurate predictions. Its speed and scalability make it possible to provide reliable forecasts for thousands of metrics across a large and complex environment.
Open Source Models
Other algorithms from several open-source libraries used for Selector’s AI and ML features include:
scikit-learn. SciKit-Learn is an ML package for Python.
PyTorch. The PyTorch Foundation is the deep learning community home for the open source PyTorch framework and ecosystem.
spaCy. This is a free, open-source library for natural language Ppocessing in Python. It features named-entity recognition (NER), part of speech (POS) tagging, dependency parsing, word vectors, and more.
mlxtend is a Python library of useful tools for the day-to-day data science tasks, including logistic regression, random forest, RBF kernel SVM, and ensemble diagrams.