This is the multi-page printable view of this section. Click here to print.
Analytics & Queries
1 - System Analytics
WAN Analytics
The network may face performance degradations for a variety of reasons. The issue could be intermittent or there could be an outage. While it’s important to monitor the WAN metrics to predict performance degradations, it is also important to identify the issues based on multiple data sources. Errors such as port errors/discards are seen over SNMP, but other events such as system reboots are conveyed by syslogs. Consolidating all the data sources to identify the health of a device is crucial.
Selector can gather events and information from various “virtual edge” sources, whether over the Internet, from wireless portions such as LTE, or tunneled portions using MPLS.
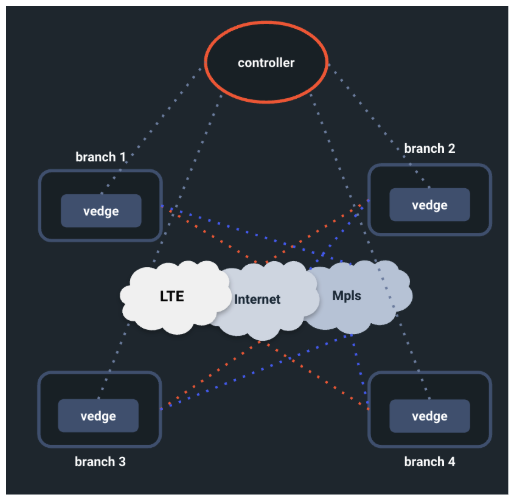
The Selector POC considers the following data sources for WAN analytics:
| Data Source | Type of Ingest |
|---|---|
| Vmanage | API (Rest Poller) |
| Syslogs | Direct syslogs over udp/514 |
| Snmp | SNMP engine (60s poll interval) |
| Thousand eyes | API (Rest Poller) |
As part of the solution, the platform uses the following integrations:
- SNMP—This integration is based on SNMP OIDs. The polling frequency is tunable and currently set to 60 seconds by default. Adding a new OID is as simple as navigating to the integrations page and adding a new group to poll.
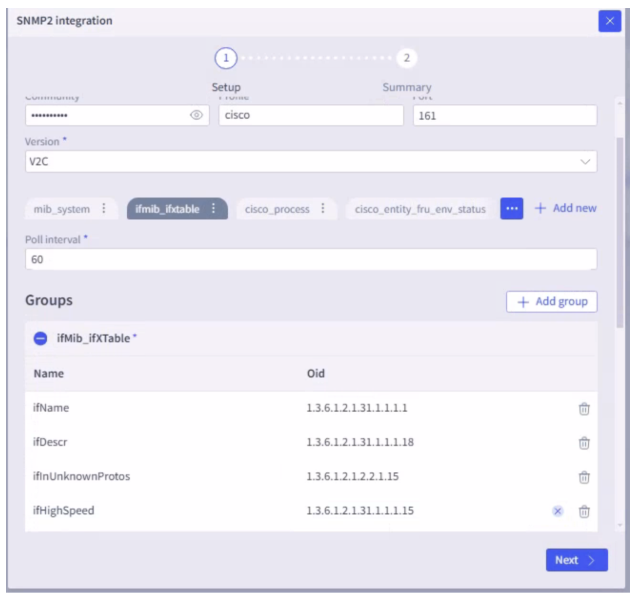
Various data points are collected, such as system, interface, CPU, memory, BGP, and so on.
- REST poller—The Selector platform has a rest poller integration for data sources that need to interact using rest APIs. The platform can perform GET and POST commands to process the raw data.
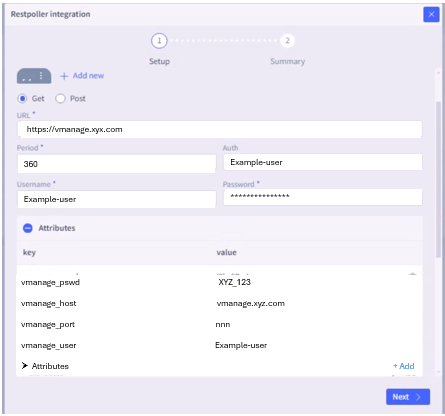
Other integrations are used to ingest vmanage and thousand eyes KPIs.
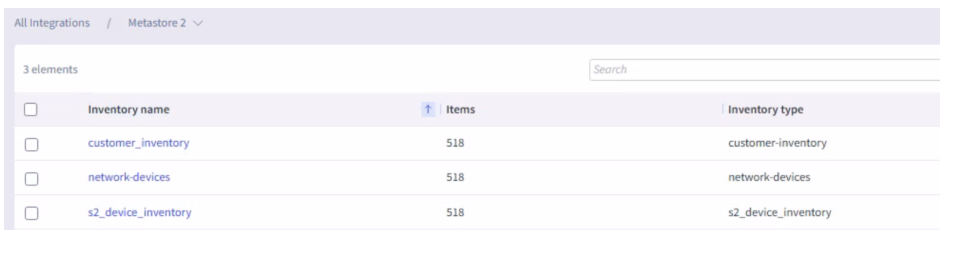
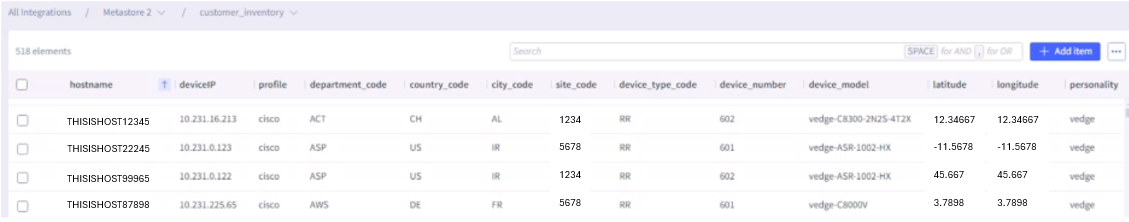
Inventory—Selector can have a configuration management database (CMDB) that is used to build an inventory of all the devices. The metastore2 integration helps to ingest static files provided with device name and latitude and longitude information used to display devices over a geographical map. Inventoried devices are polled by the SNMP engine to capture various metrics such as interface name, utilization, and so on. The table contains both WAN and wireless devices. If there are new fields that need to be ingested, the schema is modifiable. The Selector platform can collect configuration data through SSH or 3rd party integrations such as GIT, and track configuration changes, but the platform does not participate in configuration changes to the devices directly. Selector can also work with 3rd party configuration and automation platforms for configuration automations. Selector’s device-discovery capabilities enable customers to scan the network environment, identify devices, and populate Selector’s integrated CMDB.
Detected devices are matched to a device profile to enable the automated instrumentation and monitoring of those devices.CMDB inventory status fields indicate the state of each device, which can be factored into alerting and notification workflows.
As an open data platform, Selector readily integrates with data sources and downstream services and can integrate with CMDB or ERP platforms as required.
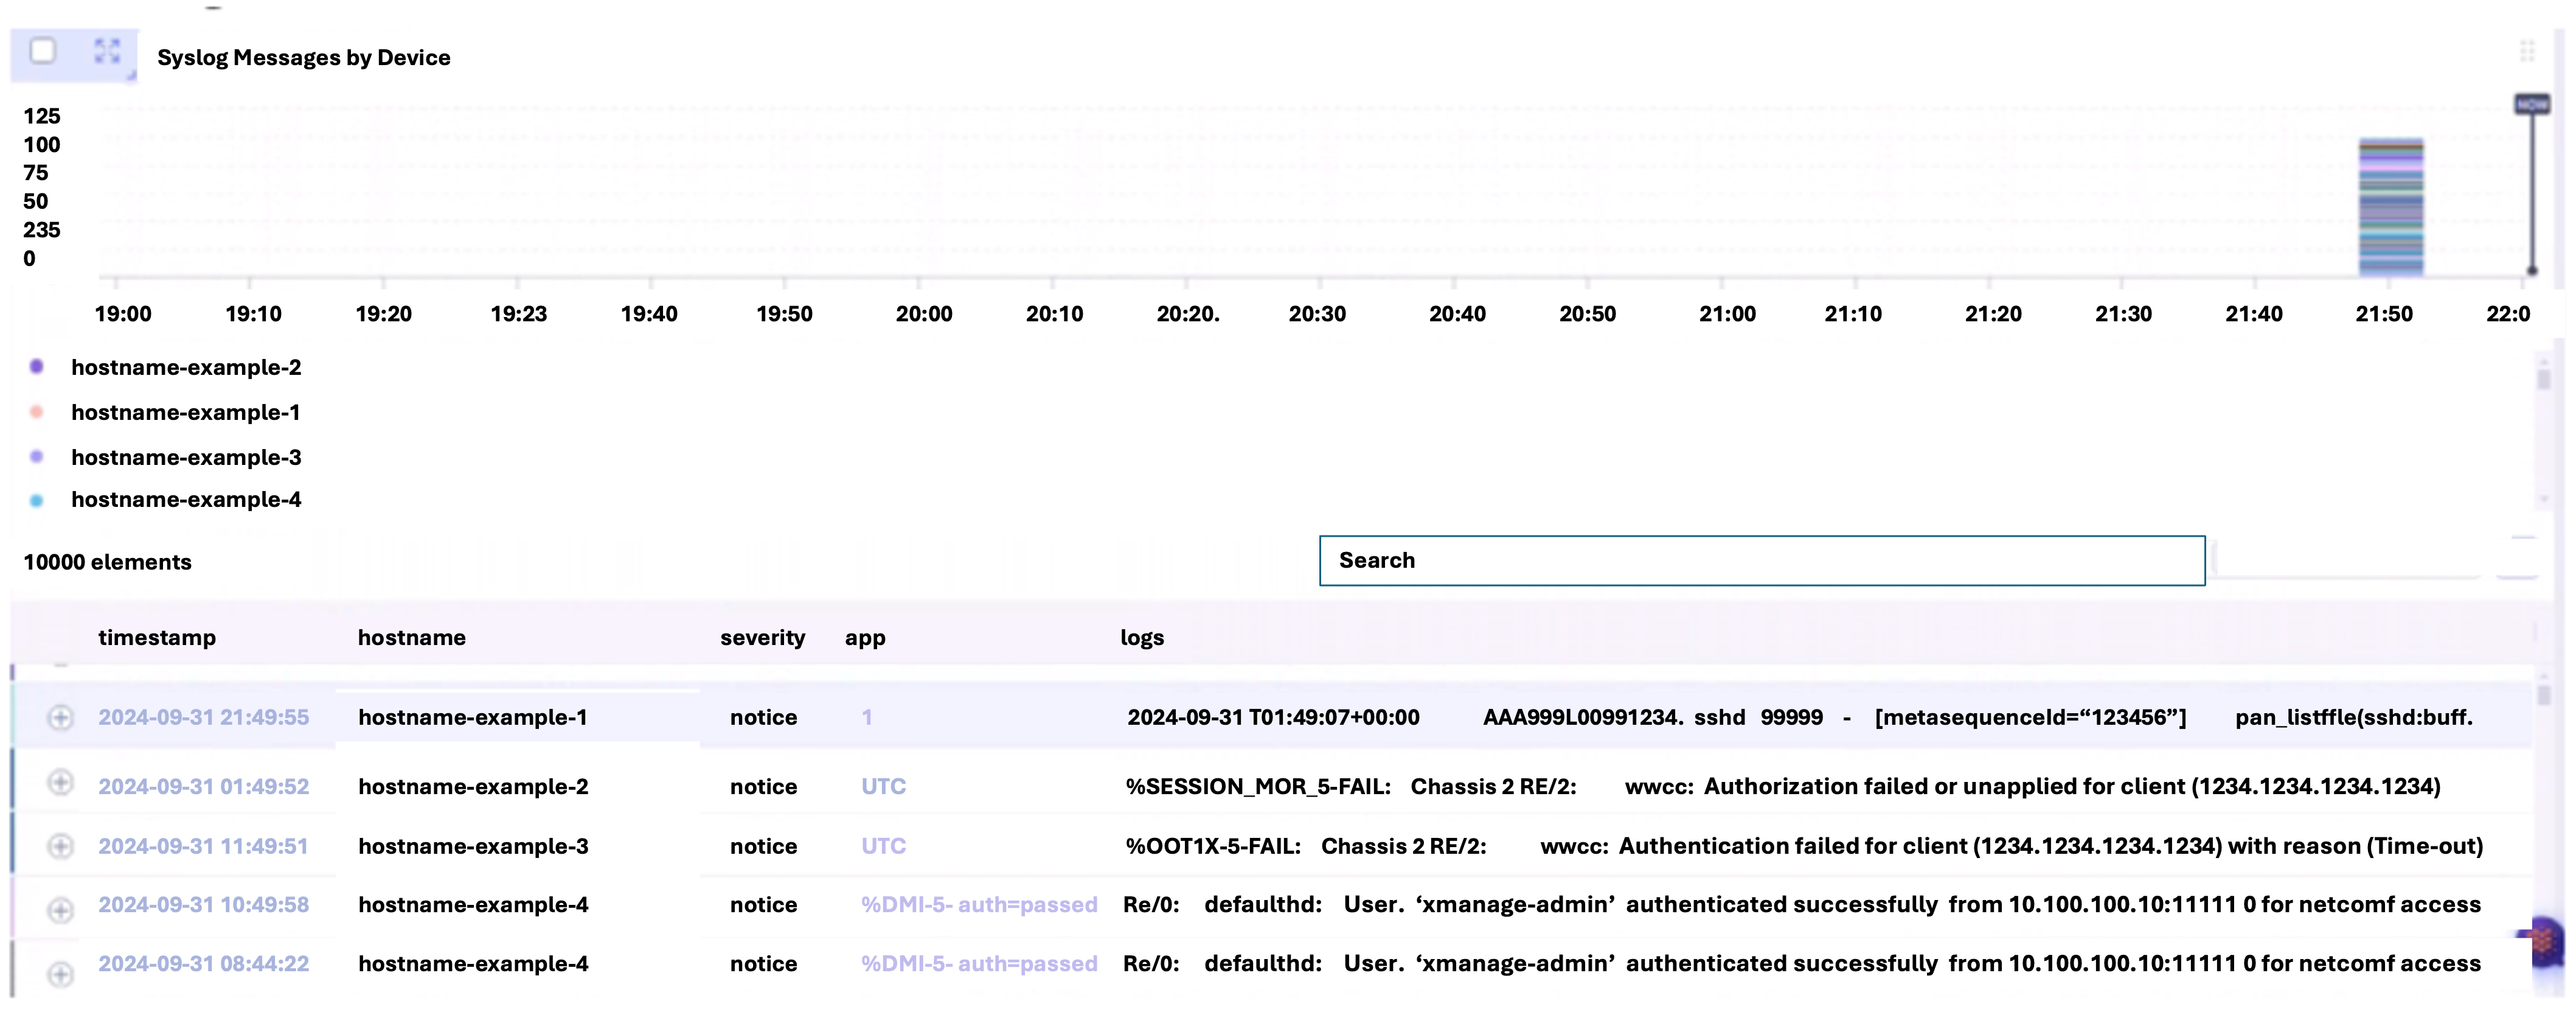
- Syslogs—Selector is capable of ingesting syslogs, as mentioned in the previous section. The syslogs can be mined for patterns and further used in correlations. The logs that are redirected to the platform on UPD port 514 are ingested. Raw logs are converted to events through a process of labeling. Both raw logs and labeled logs can be viewed. Selector further leverages a combination of AI and ML to analyze log messages, identifying patterns and anomalies related to the rate, severity and content of the logs. This capability automatically identifies anomalies and the context of those anomalies, enabling correlation, root cause analysis, and ticket consolidation.
Raw Logs View
Device_event_ml Table
Labeled logs are continuously trained and a model is created for inference. Any newly generated logs matching the respective labeled pattern are automatically identified as an event which further powers the correlations from the data sources.
Additionally, if there are data sources needing to use a python-sdk, the Selector platform can handle as well. For netflow, the Selector platform has a netflow collector to process these packets.
Wireless Analytics
The Selector platform can ingest data from multiple sources. When part of a POC, the wireless analytics are derived from ingesting metrics from various data sources. Correlated events can be identified to gain insights related to clients connecting to access points (APs). The performance of the APs can be derived leveraging all the data from WLC, controllers and switches (soon). End-to-end correlation within a given site are based on contextual data and joining across switches and routers at the site.
Selector considers the following data sources for wireless analytics:
| Data Source | Type of Ingest |
|---|---|
| Meraki | API |
| DNAC | API |
| Wyebot | API |
| WLC | SNMP, Syslog |
The Selector platform ingests these data sources as part of a wireless observability POC. The mechanisms are the same for WAN analytics.
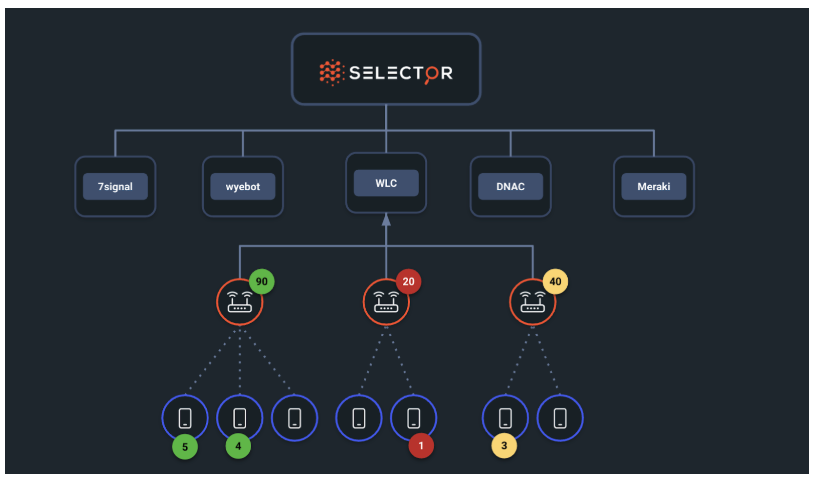
In addition to ingestion, the process of generating device health, creating an aggregated health for the WLC, and correlating the events are the same for WAN analytics. From the Selector platform perspective, the key parameters are metrics and labels. These are used to display various dashboards and therefore the process remains the same.
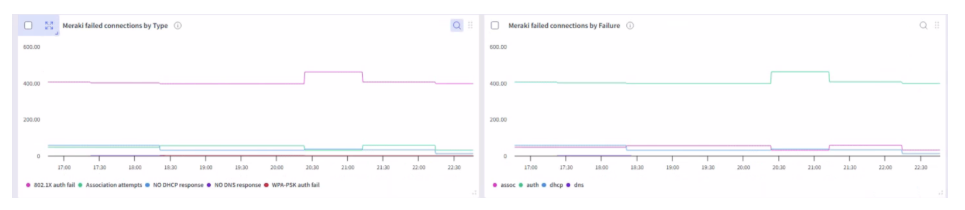
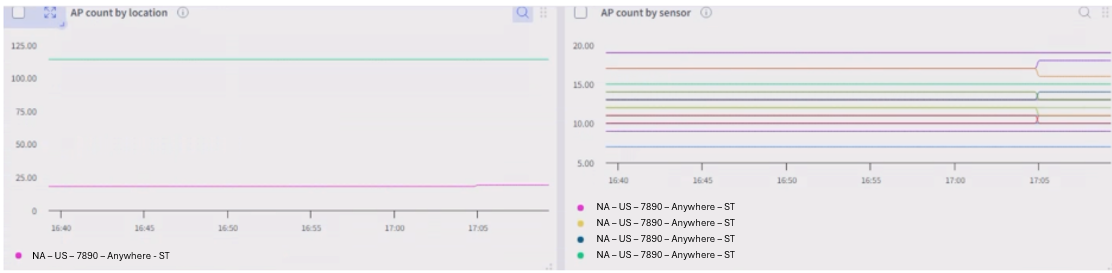
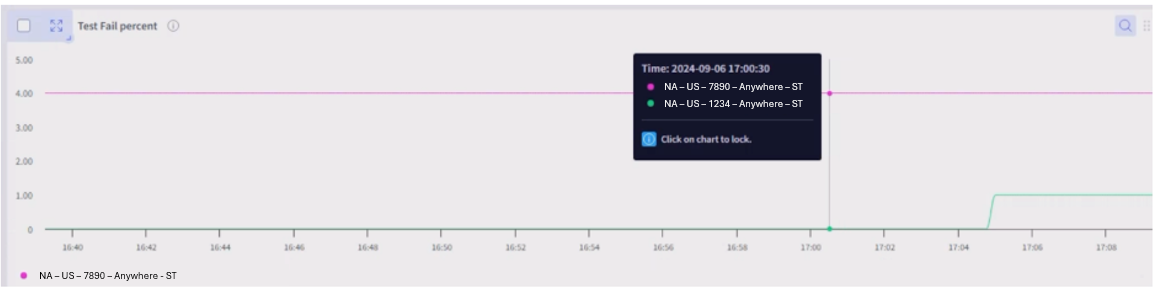
Representation of Meraki
Honeycombs are created for different data points, such as SNR, RSSI, Onboarding, and so forth. Violations are computed based on defined thresholds. The Selector platform can also add derived metrics such as channel switch identification, interface flaps, flap rate, and so on. This tracking is extensible if needed.
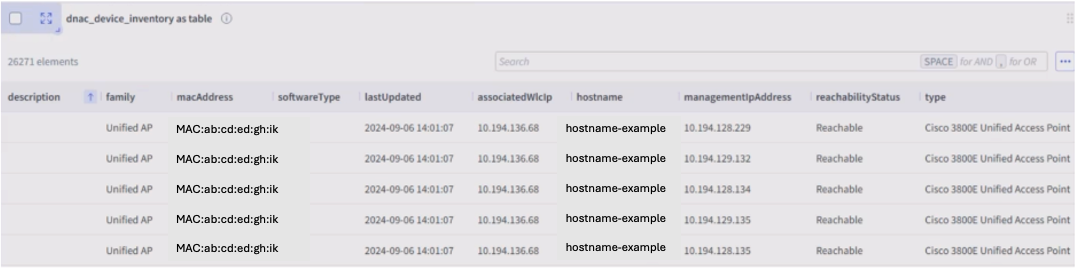
DNAC
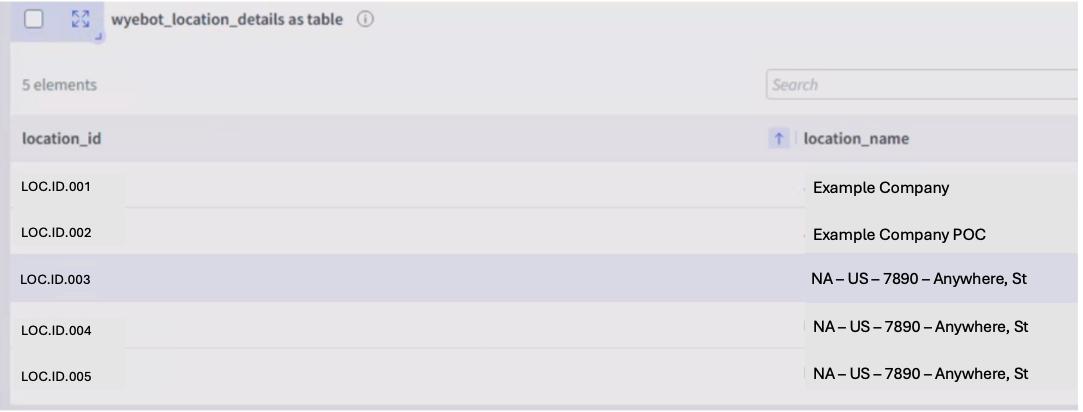
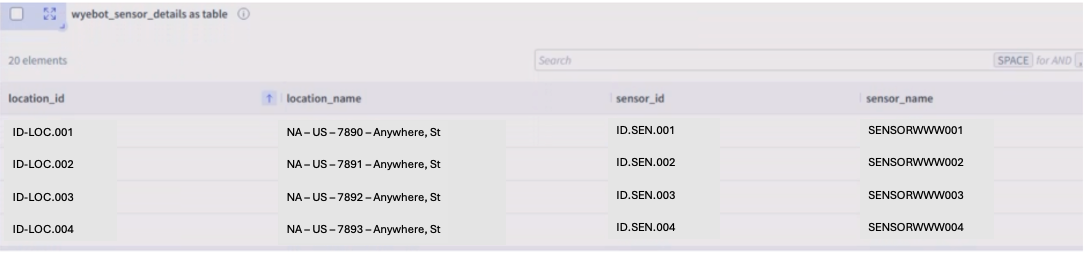
Wyebot
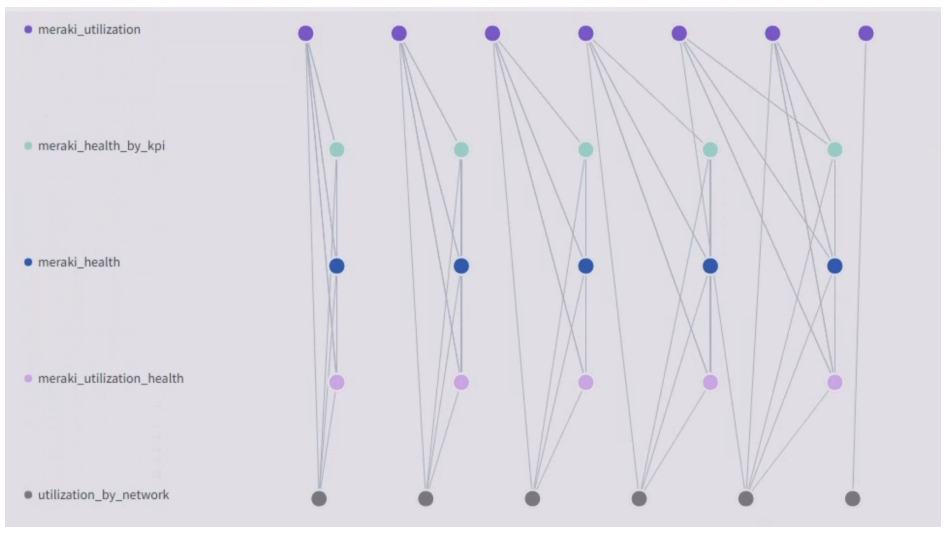
Correlations
Wireless correlation is the same as with the WAN analytics.
Health Report
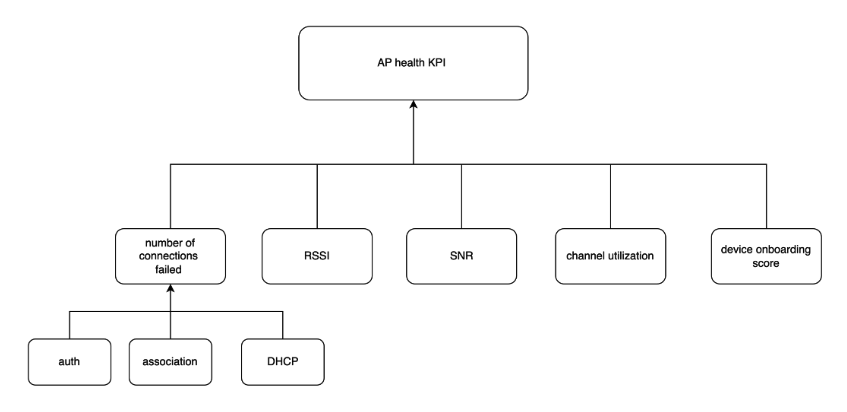
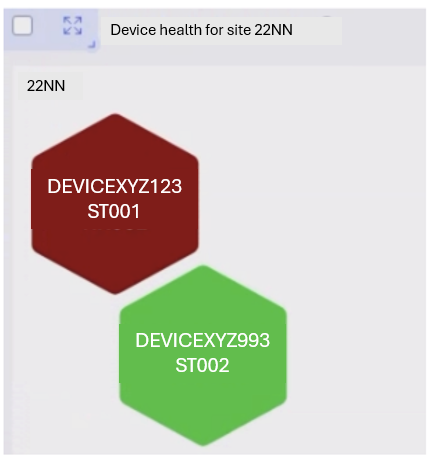
The health report for a site is built based on multiple kpi violations. The report considers all devices associated with a site such as routers, switches, and so on. The violations help in “bubbling up” site health depending on the device and number of impacted devices.
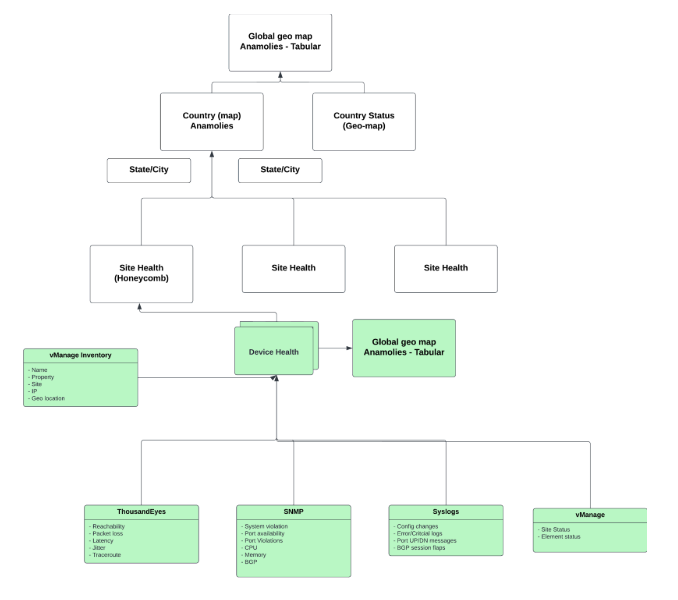
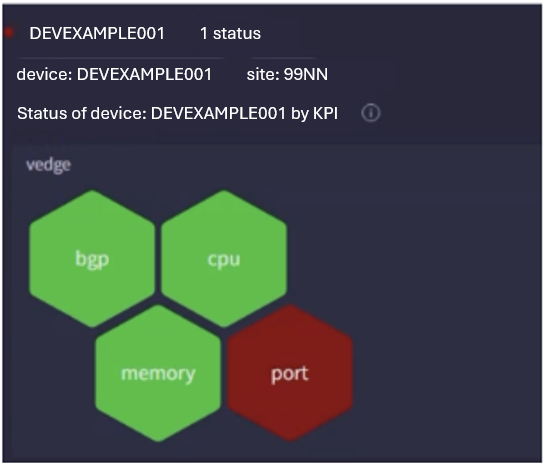
Each device can then be drilled down to reveal respective metrics and contributing KPIs for violations for behavior understanding.
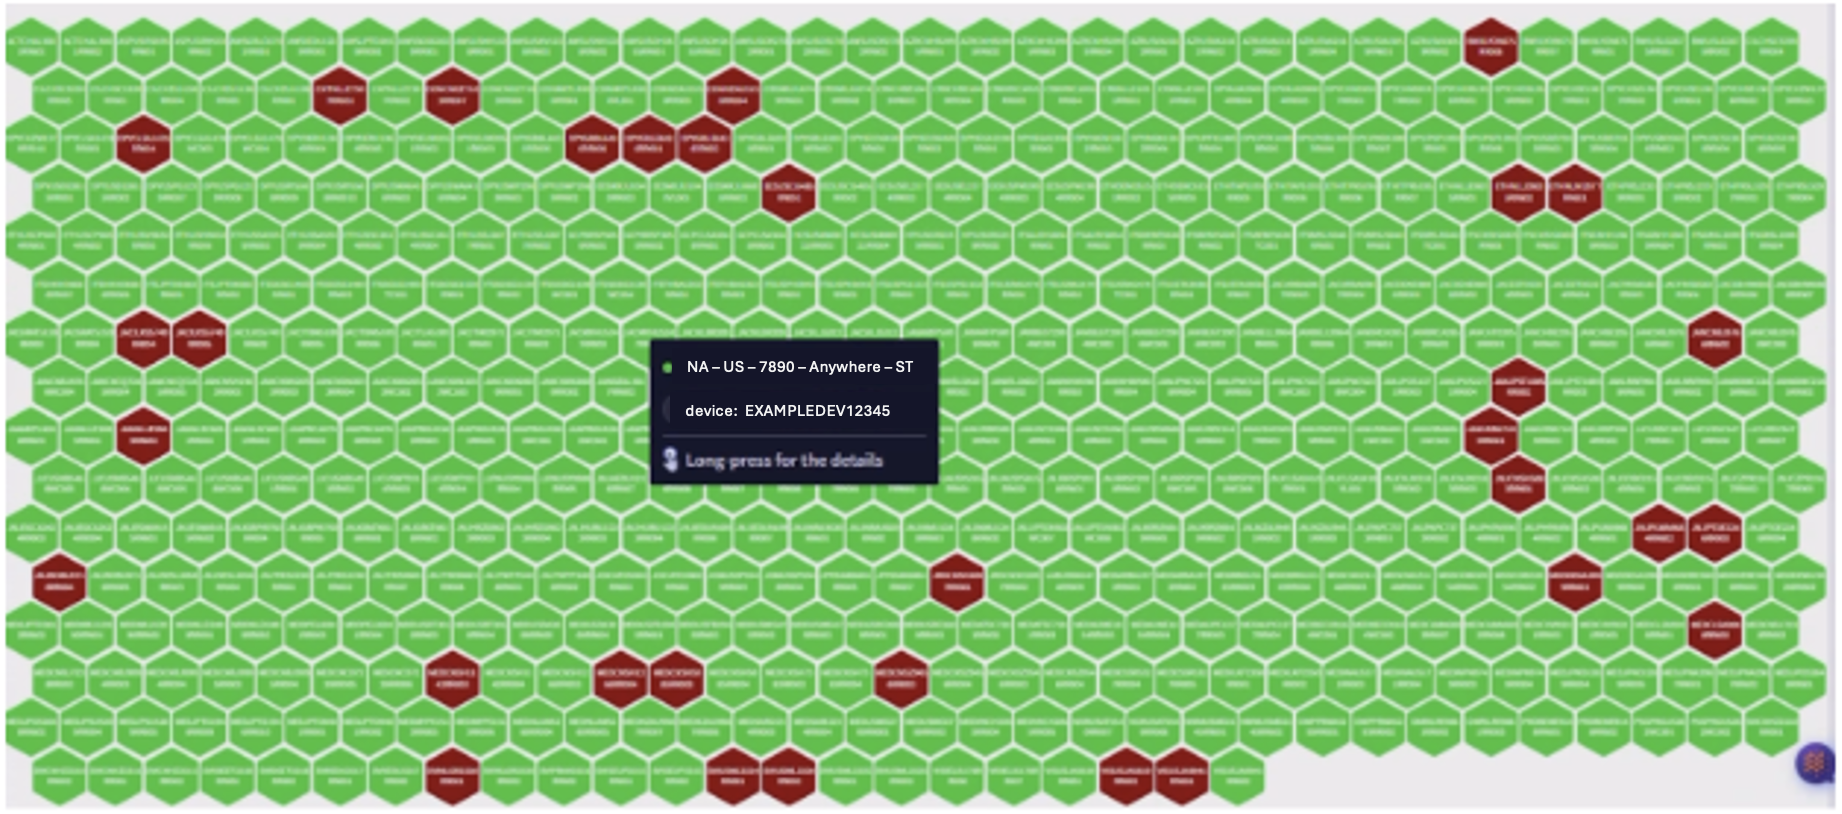
Geographical maps are created to represent the devices or sites and to identify and show violations. Drill downs are created to allowing simpler user to query. For geographical maps to work, the latitude and longitude values need to be provided. These can come from inventory tables in vmanage or provided static files.
Site level views are created to easily navigate based on site ID instead of device name or region.
Long presses provide drill-down views on the same screen.
Report Generation and Exports
Users can generate automated reports on a monthly, weekly, or daily basis to generate network insights. These reports can be automated as emails as well, and the timeline is customizable. In addition, Selector can export data as either a PDF or in CSV format.

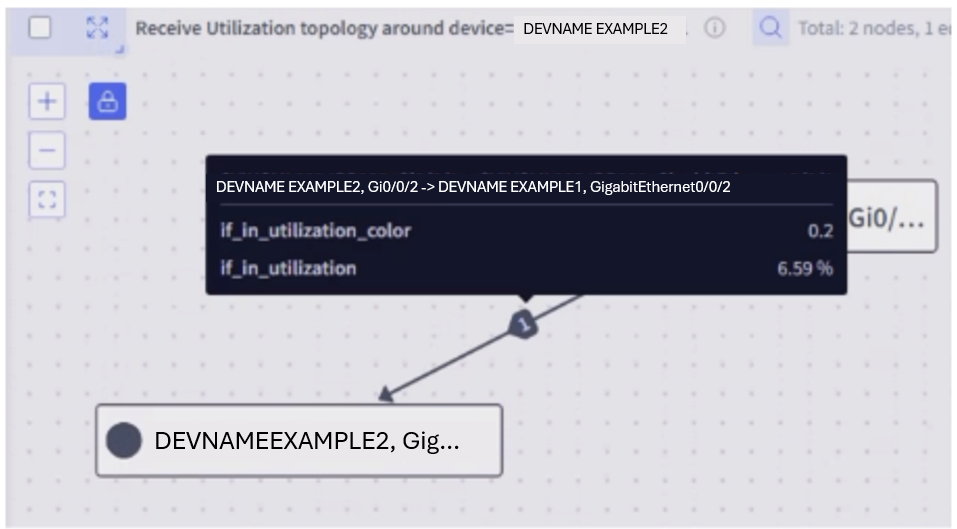
Topology Representation
The topology of a given site or across and between sites can be identified using. For example, LLDP and CDP data. These are obtained from SNMP and the topology is constructed based on identification of network nodes and edges.
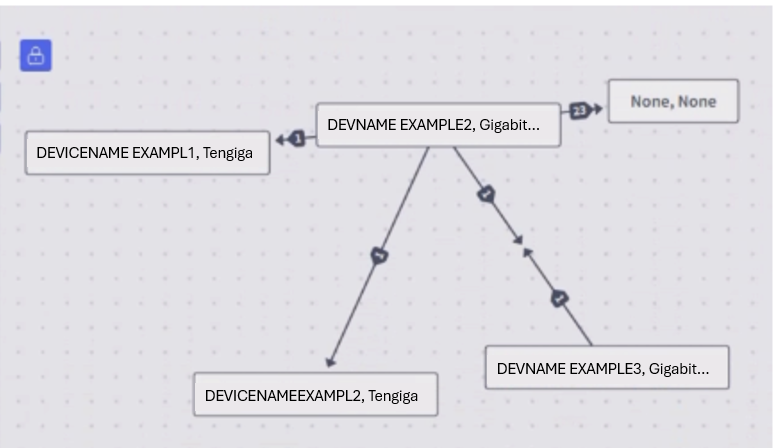
Selector can also overlay metrics and color code in addition to representation. Customized color code definitions are also possible.
2 - S2QL User Guide
Selector Software Query Language (S2QL) User Guide
Table of Contents
Main Query Structure and Keywords
Details On How to Fetch Data Relevant to Draw Insights
Supported Rendering Styles and Usage Examples
Introduction
This document provides a comprehensive guide to the Query Builder, a key tool on the Selector Platform designed for answering your questions about your network using efficient data retrieval and intuitive data visualization. This guide offers in-depth explanations of how S2QL works, its advanced techniques, as well as examples to help construct effective queries to get best insights from your data. Back to TOC
Main Query Structure and Keywords
The Query Builder employs a structured syntax and a set of keywords to precisely define how data is fetched and displayed. This guide examines how to select data and then shows how to render the data effectively for the insights in the most intuitive manner. There are 2 overall steps: fetching data and data rendering.
Fetching Data
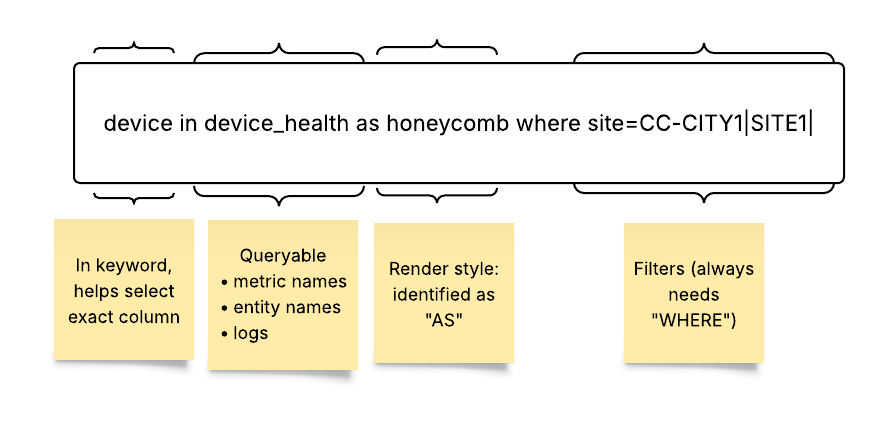
Start by selecting the data you want to look at Any search involves the following four most important components:
1. Data Source: where to search for data (called Queryables).
2. Filter conditions : what specific data you need for network insights (the where clause).
3. Specific data attribute : attributes of the data user is interested in (the in clause).
4. Time Range: the time range to use for the query.
The Selector platform collects and maintains data for long time periods (data retention timelines are configurable). This allows the platform to use ML to learn from past observations and to predict future behavior. The platform also supports network DVR operations to allow users to examine network conditions at a specific period in the past using the Time Range filter in the Query.
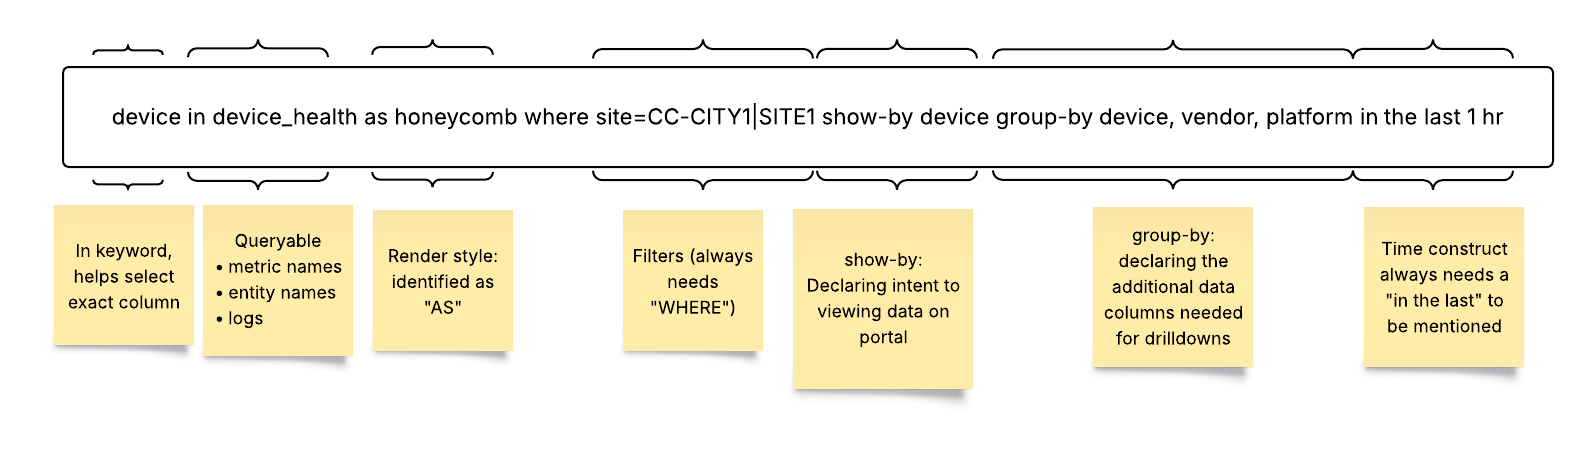
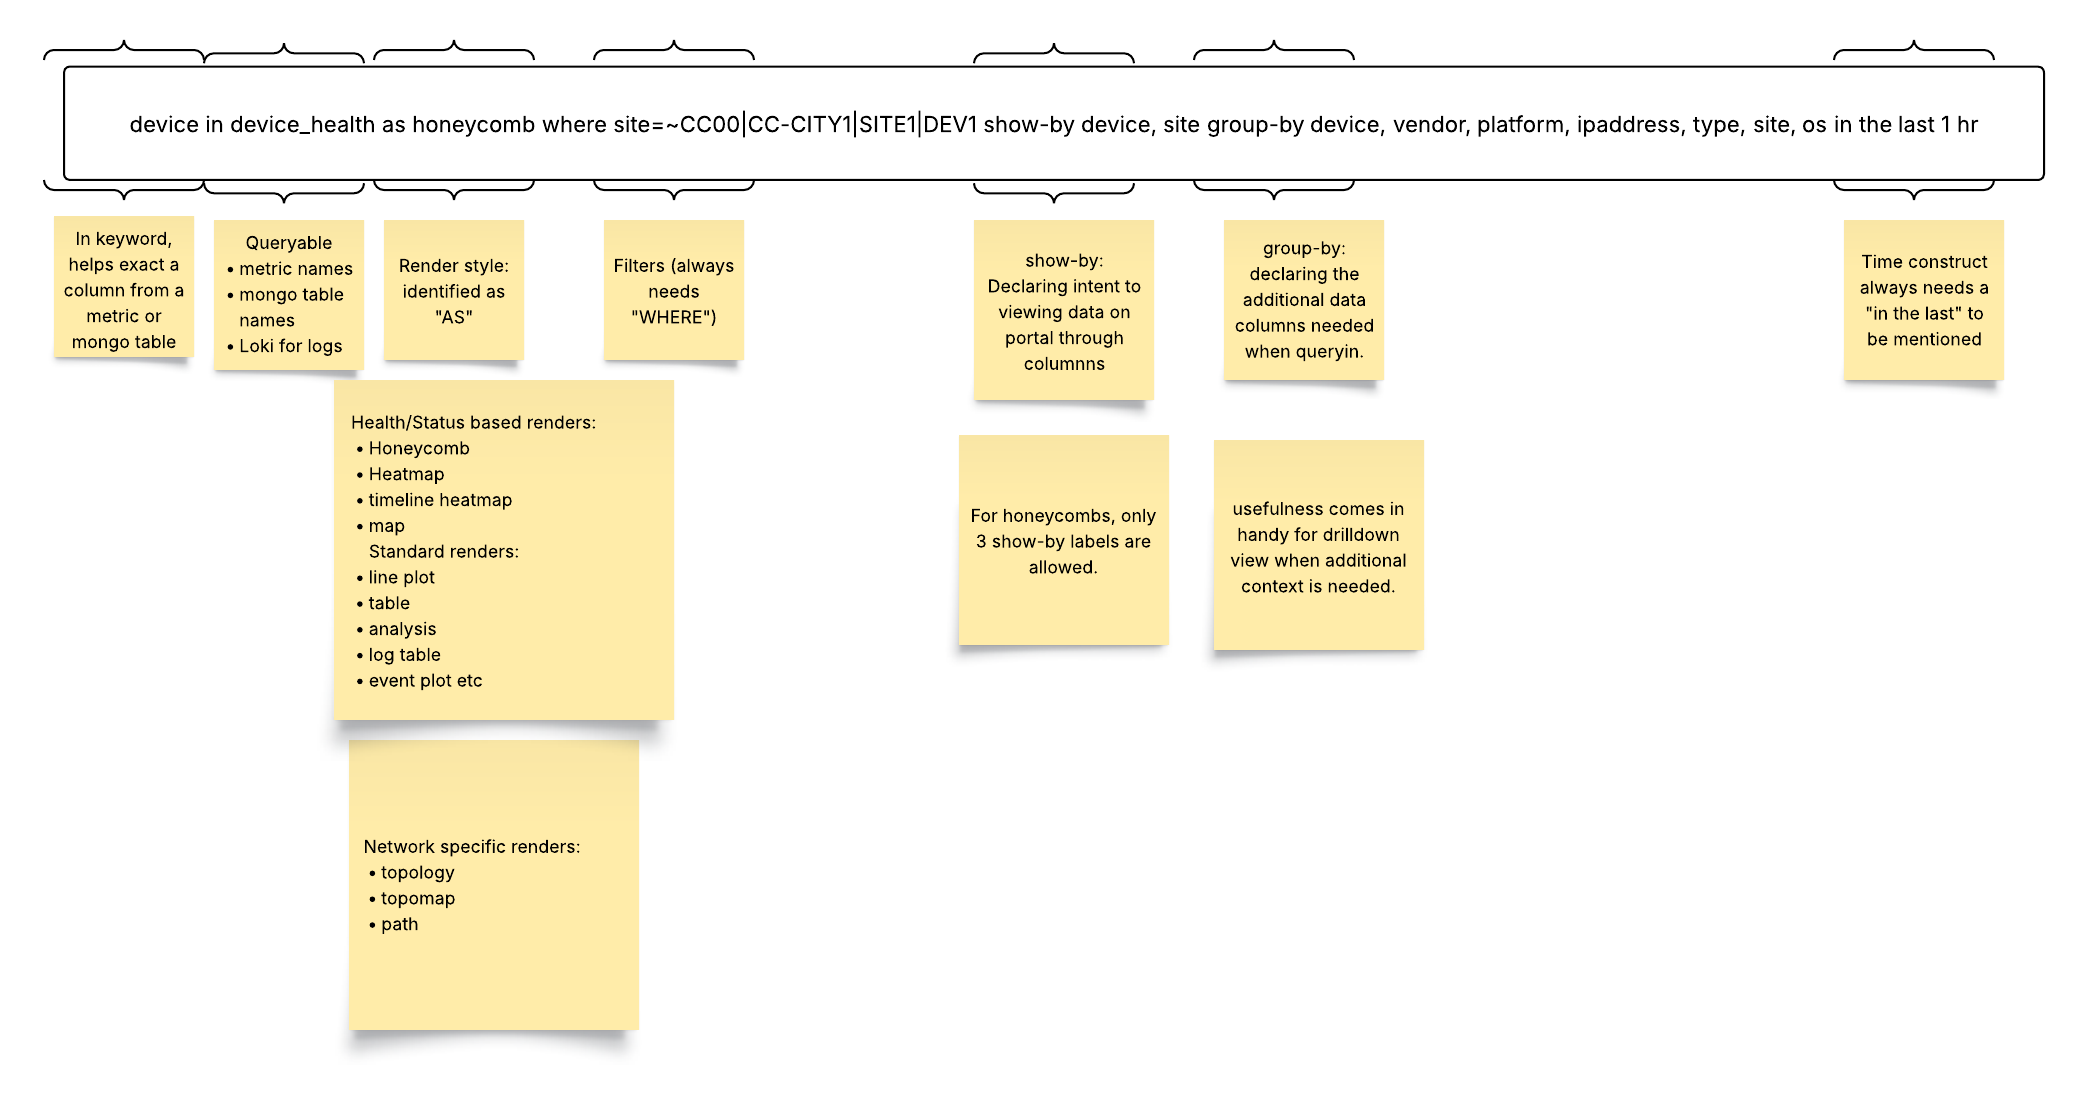
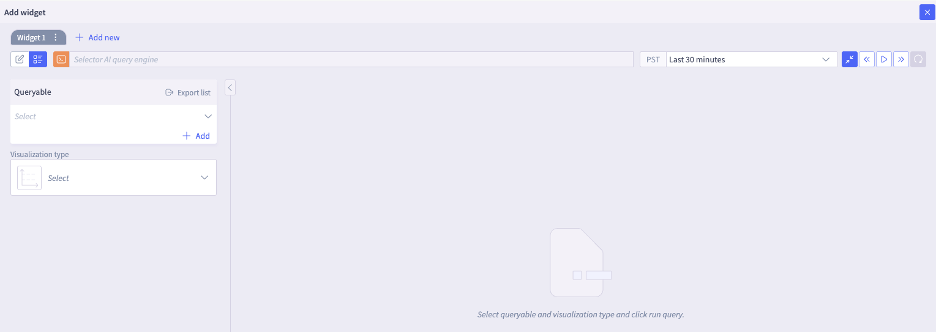
The following figure shows how the S2QL Queryable combines the where clause, the in clause, the time range, and some other organizing keywords (show-by, group-by) to create a widget to link to a dashboard on the Selector platform. All of these aspects of the S2QL are detailed in this guide. Note that the Queryable can be built using the UI or by typing.
Details On How to Fetch Data Relevant to Draw Insights
- Queryable (Data Source): A Queryable is one of the most important constructs of the Selector platform. ****The Queryable specifies the origin of the data being processed. This could be a metric from a time series database (stored in Prometheus), a table from inventory or events database (stored in MongoDB database), or enriched logs from Loki.
Syntax and Examples of filter condition:
Queryable: Flow_Count (Specifies a metric named Flow_Count - metrics are stored in Prometheus database)
Queryable: Application_Mapping (Specifies a table that stores entities and events. for example, Application_Mapping - stored in MongoDb database)
Queryable: syslogs (Specifies log data from Loki database)
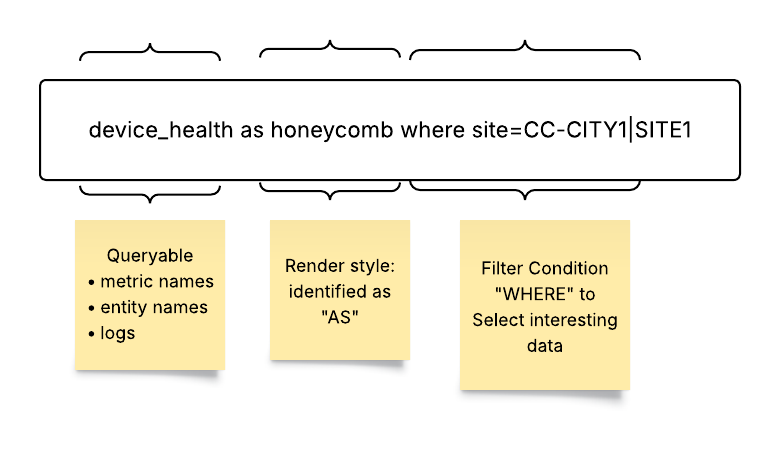
- Where (Filter condition) : The where keyword (UI filter group) applies filters to the query, narrowing down the data by matching specified conditions. The where clause utilizes key-value pairs, comparison operators, and logical operators to create precise filtering criteria.
Syntax and Examples of filter condition:
where: site = ‘SITE1’ (Filters data with the site value equal to SITE1)
where: flow_count > 25000 (Filters data with the flow_count value greater than 25000)
where: direction = ‘DC internal’ or direction = ‘DC outbound’ (Filters data where the direction value is either DC internal or DC outbound)
Note that the where clause supports comparison operators (`=`, `!=`, `>`, `<`, `>=`, `<=`), logical operators (`and`, `or`), as well as regular expressions.
- In (Data Attributes): A Queryable points to a data source where enriched data resides in multiple attributes (or columns). To answer a specific question and to derive business insights, a user might want to select only specific attributes of the Queryable. The in keyword selects specific columns. Using attributes allows more targeted data retrieval, helping users to focus on the relevant aspects of the data to answer user questions and to generate insights.
Syntax and Examples:
site, device_type in (Selects the site and device_type columns from the Queryable)
response_time in (Selects the response_time column from the Queryable)
Note that if the in keyword is omitted, then all columns from the Queryable are retrieved and presented in table format.
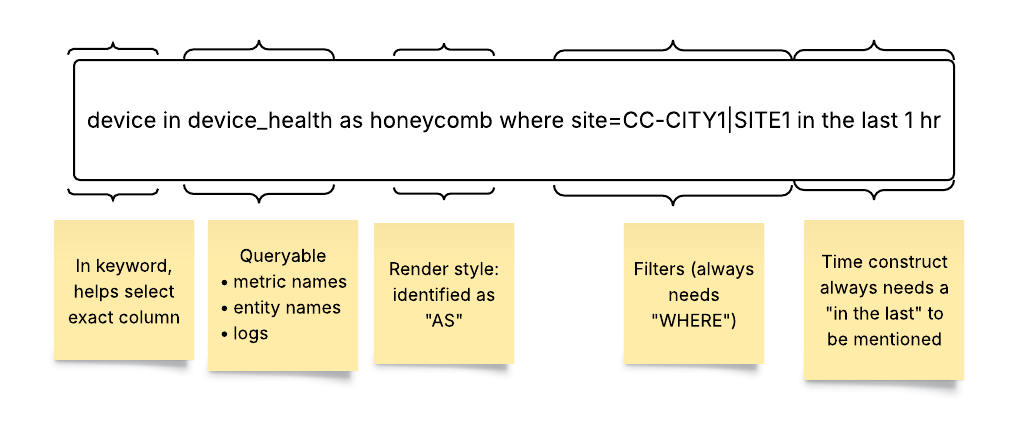
- Time (Time Range): The time keyword defines the time range for the query. The range allows for historical analysis, real-time monitoring, or future projections.
Syntax and Examples:
time: last 30 minutes (Queries data from the last 30 minutes)
time: last 7 days (Queries data from the last 7 days)
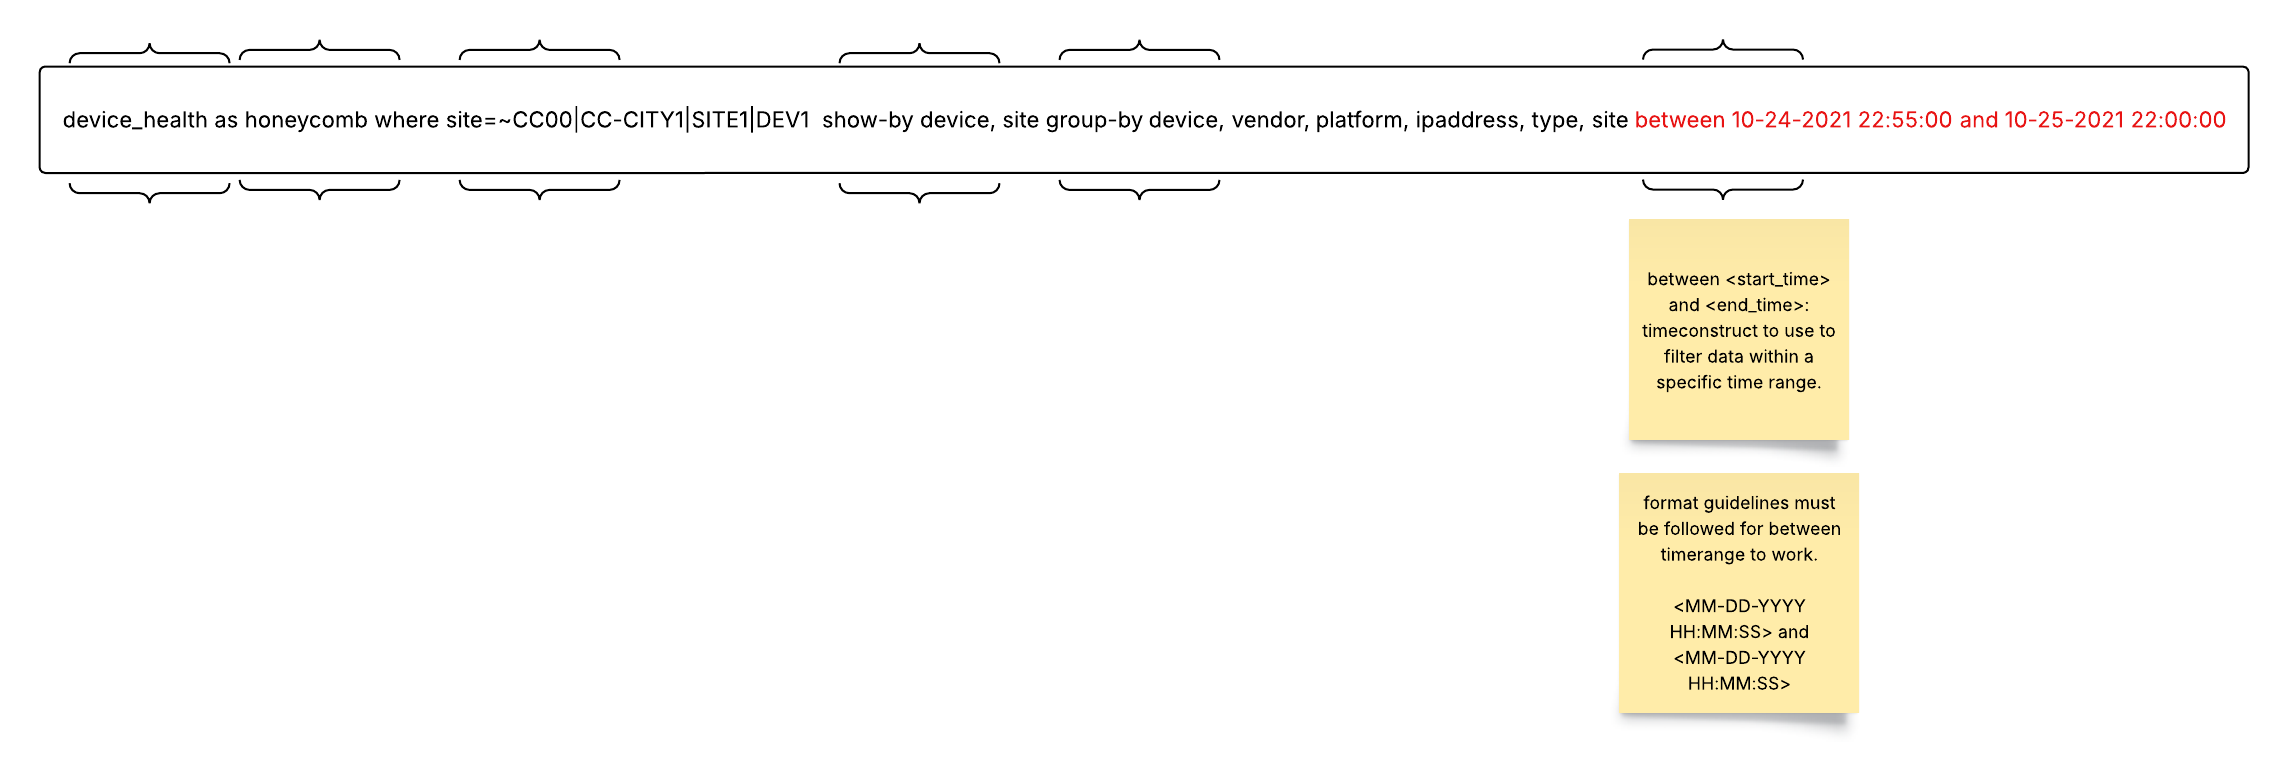
time: between 03/25/25 12:00 and 03/25/25 13:00 (Queries data between 12:00 and 13:00 on March 25, 2025)
time: next 7 days (Queries data for the next 7 days; used for projections)
If the time clause is not explicitly mentioned in the query, the query picks the “time range” selected in the “time picker.”
Note that the time keyword in the Querable overrides any time window set in the UI.
To set a <start_time> and <end_time> time range, you must follow the MM-DD-YYYY HH-MM-SS format guideline.
Data Rendering
After fetching the selected data, it is equally important to render it in the most intuitive user-friendly way. The Selector platform allows many data rendering options.
Drop down menus show the rendering styles available for each metric on Query Builder UI.
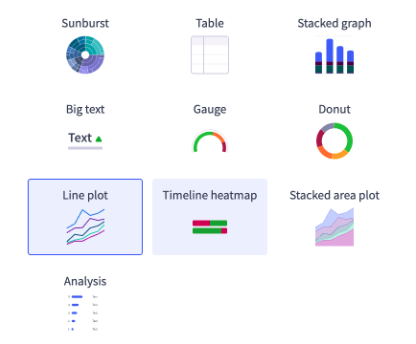
Drop down menus show the rendering styles available for each metric on Query Builder.

If you do not pick a rendering style, the S2QL picks what it thinks is the best way to render the data. All queries have a default rendering style. For example, an inventory database is always rendered as a simple table with rows and columns. You can render multiple Queryables on a line plot. For best results, limit the multiple queries to two or three at most.
Keywords for Selecting Render Types in Query Builder Bar:
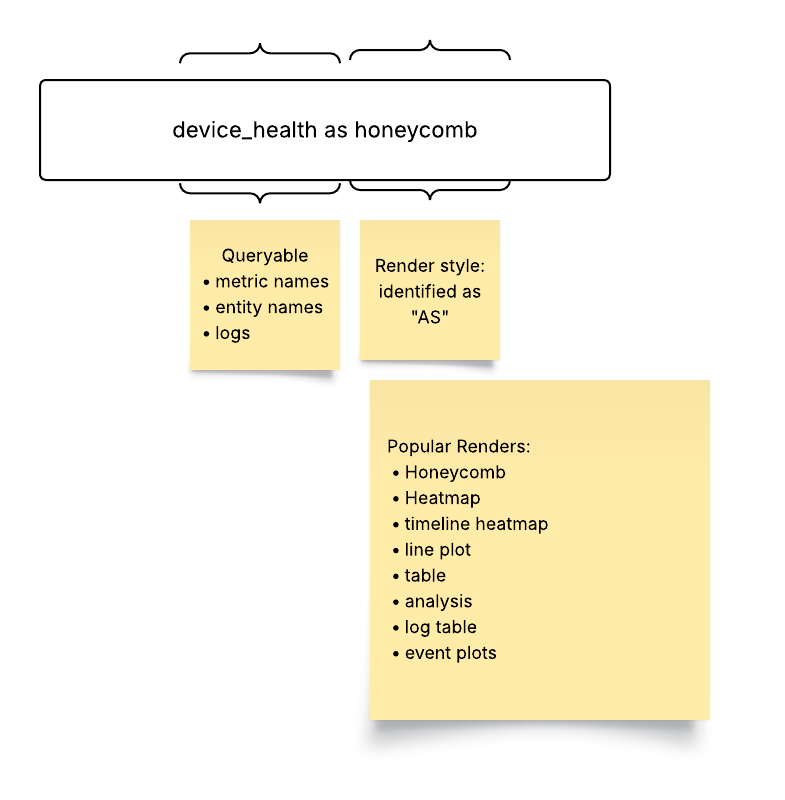
- As: The as keyword (called renders in the UI) determines the visual representation of the queried data. The Query Builder supports a variety of render styles, each suited for different types of data and analysis. A complete list of all rendering options available on the platform is at the end of this chapter.
Syntax and Examples:
as Line Plot (Renders the data as a line plot)
as Table (Renders the data as a table)
as Honeycomb (Renders the data as a honeycomb)
Note that other available render styles include Heat Map, Timeline Map, Event Plot, Topology View, DOPO Map, Path, HTML Text, Big Text, Donut, and Sunburst. Some styles are not available in all Queryable data forms.
- Show-By: The show-by keyword is used to arrange and organize the visual elements (tiles or honeycombs) in the portal. It is particularly relevant for Honeycomb and Sunburst render styles.
Syntax and Examples:
- show-by site, device (Arranges the tiles or honeycombs by site, and then by device)
Advanced Query Capabilities
- Order-By: The order-by keyword facilitates drill-down analysis by querying additional columns from the backend. While order-by doesn’t impact the initial visualization, it provides contextual information when users drill down into the data.
Syntax and Examples:
- order-by device_type, location (Groups the data by device type. and uses location for drill-down)
- Group-By: The group-by keyword facilitates drill-down analysis by querying additional columns from the backend. While group-by doesn’t impact the initial visualization, it provides contextual information when users drill down into the data.
Syntax and Examples:
- group-by device_type, location (Groups the data by device type and location for drill-down)
- Column Aliases: Column aliases allow assignment of user-friendly names to columns, enhancing the clarity and readability of the visualization.
Syntax and Examples:
device_health: Site Health (Assigns the alias Site Health to the device_health column)
Note that aliases have several important restrictions, as shown below:
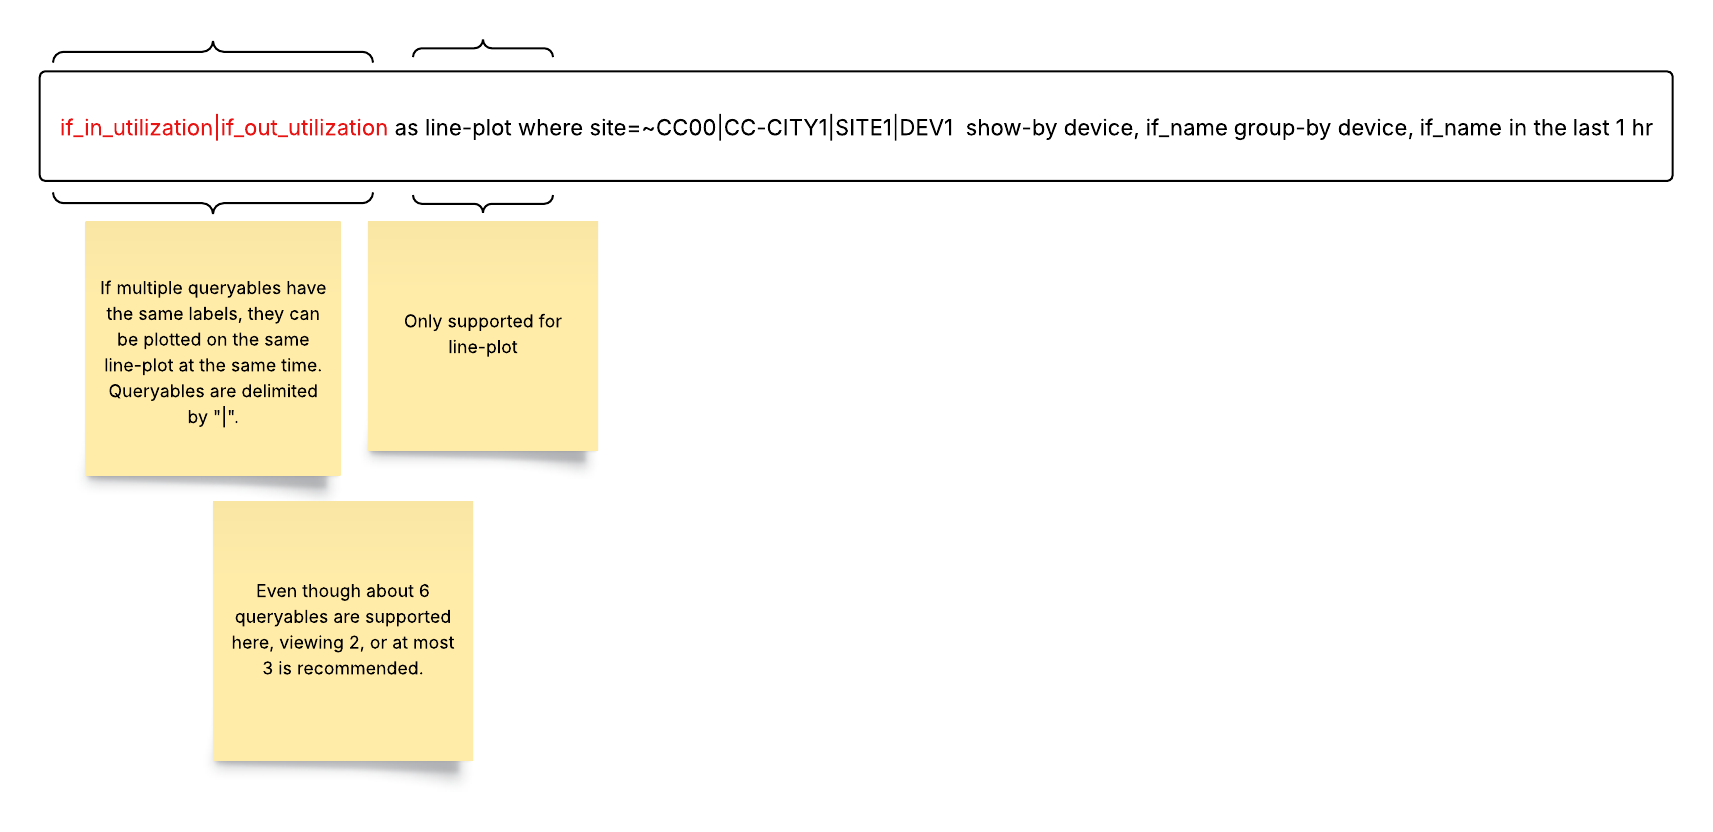
- Multi-Queryable: The Multi-Queryable feature enables the plotting of multiple metrics on a single line plot. It is exclusively supported for the Line Plot render style.
Syntax and Examples:
Queryable: Metric1 | Metric2 (Plots both Metric1 and Metric2 on the same line plot)
Note that the metrics must share the same set of labels or a similar family of labels for this feature to work correctly. These restrictions are shown below:
5. Aggregation Queries: This feature provides statistical insights into numerical values stored in a mongo table. Use cases include reporting based on availability, roll-up tables, and entity-related data like uptime availability. For example, if device availability is a numerical value in the inventory table, this function allows end users to see “average” device availability over a selected time window. Aggregation is not supported for metrics or logs
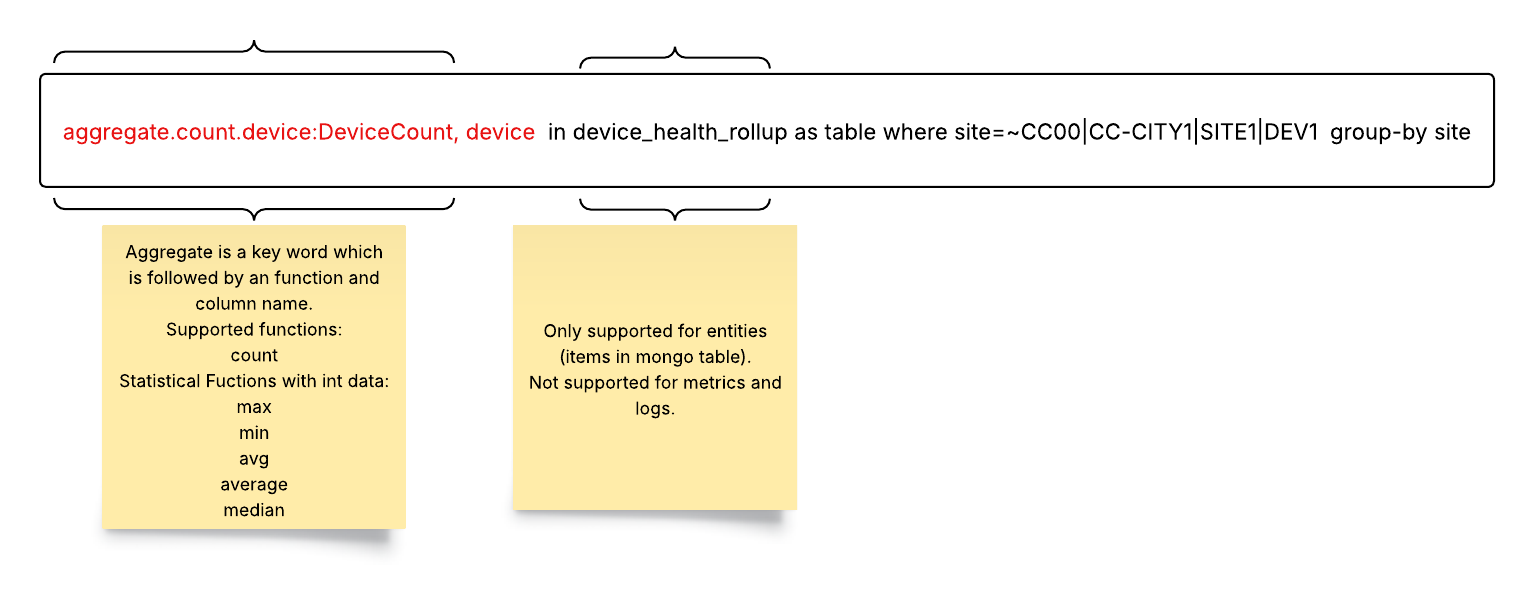
To use aggregate functions, start with the aggregate keyword.
Follow with the function (for example, count).
End with the column name (for example, device).
The following Aggregate Functions are supported:
count: this provides the count of unique instances that match a given filter condition
max: the maximum value of the set that matches a filter condition (default)
min: the minimum value of the set that matches a filter condition
median: the median value of the set that matches a filter condition
avg / average: the average value of the set that matches a filter condition
Using count with aggregate is a powerful combination. It provides the count of unique occurrences of instances (label) that match the filter/group by condition. Every unique instance and the corresponding number of occurrences for that filter condition is shown in the result.
Here is an example using aggregate.count in abc_table as a table group-by abc_number:
Query: aggregate.count in abc_table as table group-by abc_number

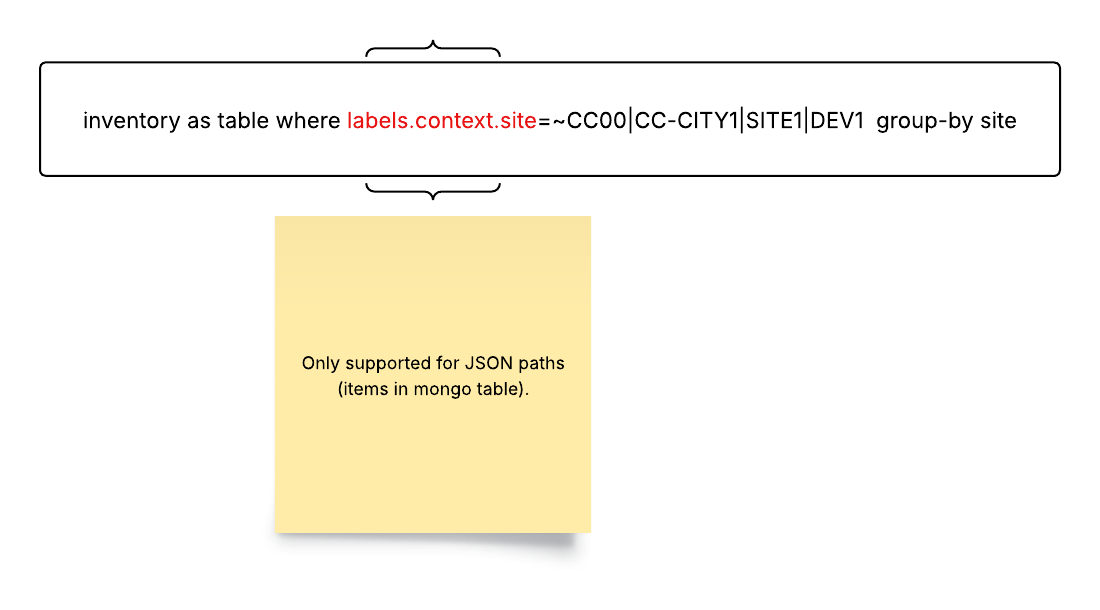
6. Nested Queries: Nested queries are used to filter information within a JSON structure. In the where clause, you can specify a nested filter within a JSON structure as shown below:
Best Practices for Queryables
Use Meaningful Aliases: Assign clear and descriptive aliases to columns for better understanding.
Leverage Filtering: Utilize the where clause to focus on specific data subsets.
Optimize Time Ranges: Choose appropriate time ranges for your analysis to avoid excessive data retrieval.
Explore Visualizations: Experiment with different render styles to find the most suitable representation for your data.
Validate Your Queries: Regularly test and validate your queries to ensure accuracy and efficiency.
Supported Rendering Styles and Usage Examples
Standard Data Rendering Styles
| Render Style | Description | Example Usage |
|---|---|---|
line-plot  | Data is generically rendered as a series of connected points | Numerical metrics packets transmitted traffic volume |
table  | Data is rendered as a simple array of rows and columns | tabular view of inventory |
log-table  | Data in log events is rendered in a simple table of rows and columns | Viewing frequency of syslogs and events over time grouped by severity. |
big-text  | Data is rendered as text with font proportional to the predominance of the information | Important highlights: Network availability Network uptime |
donut  | Data is rendered as a hollowed-out pie chart with color proportions equal to the predominance of the information | Piechart view : Device availability |
gauge 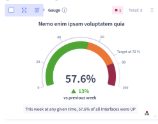 | Data is rendered as a type of speedometer arc | Speedometer view: Device availability |
stacked-area-plot  | Data is rendered as a series of lines stacked and coded to show the separation of values as areas | Average CPU usage by site. |
event-plot  | Events are generically rendered as a series of points connected by lines | Events: Events ordered by time |
stacked-event-plot  | Events are rendered as a series of lines stacked and coded to show the separation of values as areas | Events Events are ordered chronologically and grouped by frequency |
sunburst 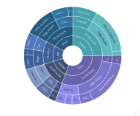 | Data is rendered as a radial treemap (multi-level pie chart) organized as a set of nested rings | Vendor distribution KPI breakdown of a device |
analysis  | Categorical and numerical distribution of the data that is being rendered | Distribution of alert events to find the most common alert |
Render Styles Ideal for Showing Health Status
| Render Style | Description | Example Usage |
|---|---|---|
map  | Data is rendered on a map. This is a special format. | Showing health of devices across the US based on latitudes and longitudes. |
threshold-violation-matrix 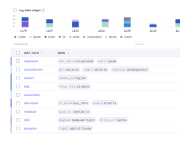 | Data is rendered as color-coded areas from “cold” to “hot” to emphasize violations | Packet drops, latency, and availability across different sites |
honeycomb 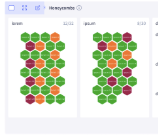 | Data is rendered in six-sided cells to emphasize violations. | Important high-lights: Device status Site status |
timeline-heatmap 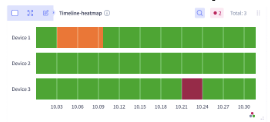 | Data is rendered along a time line as a color range from “cold” to “hot” | change of health of device over period of time |
Render Types Ideal for Network Visualization
| Render Style | Description | Example Usage |
|---|---|---|
topology 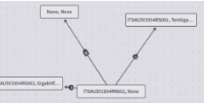 | Network date is rendered as a plot of connected devices, sites, or other equipment | BGP adjacency connections between ASNs |
topomap 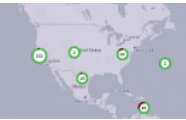 | Network data is rendered as a plot of connected devices, sites, or other equipment against a geographical map | BGP adjacency connections between ASNs shown on a world map based on latitudes and longitudes. |
path 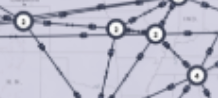 | Network data is rendered as a directional graph. This is a special format. | Displaying the intermediate hops in a segment routing path based on user defined source and destination sites. |
pathmap 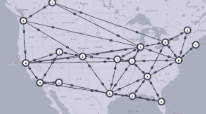 | Network data is rendered as a directional graph on a map. This is a special format. | Displaying the intermediate hops in a segment routing path on a world map based on defined latitudes and longitudes. |
3 - NL Queries and Aliases
Natural language (NL) queries allow more free-form requests for information from the Selector S2 platform. Instead of using the strict syntax used in the Selector Software Query Language (S2QL), NL use is more like typical human questioning.
So, instead of using a complex string such as:
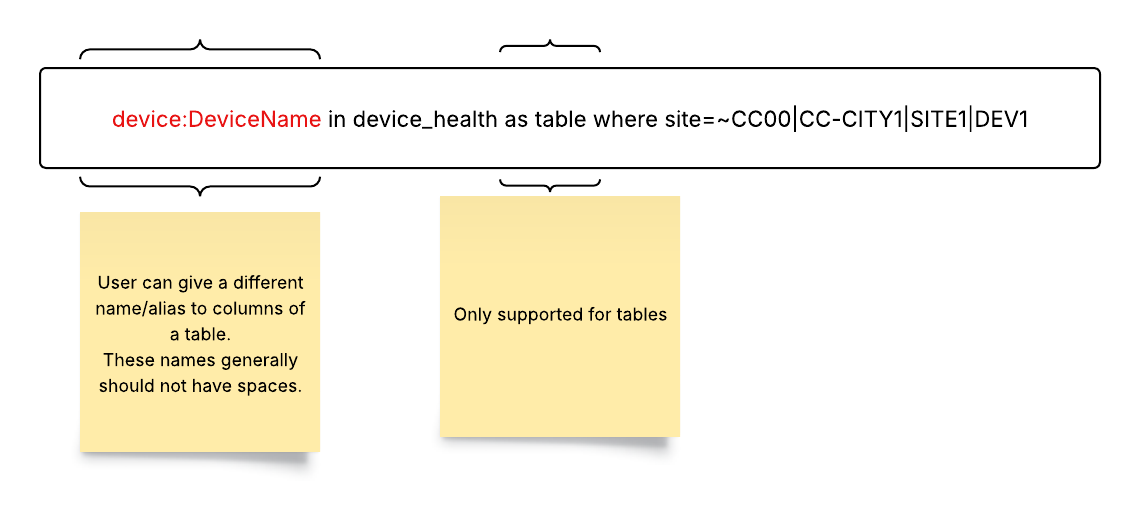
device:DeviceName in device_health as honeycomb where site=~CC00|CC-CITY1|SITE1|DEV1
An NL query in the GUI or with Slack would look like:
GUI NL Command: device status
Slack NL Command: /select device status
Both NL commands give the user a honeycomb grid of device status which can be drilled down into to visualize further details.
Use of Aliases
NL queries work by mapping NL queries to a series of aliases that stand for the S2QL equivalent. Aliases are best thought of as “query shortcuts.” This process lets the NL process see that the queries “Where are we driving?” and “What place are we going in the car?” are very similar, so the LLM can map them to the same alias for S2QL, such as “destination in automobile.”
Any sentence can be mapped to any alias. However, users must still be aware of the role that aliases play. Because the process tries to map NL to aliases, the better the context provided, the easier it is for the LLM to find the closest alias to the NL query.
For example, if the following aliases have been stored:
- bgp status
- bgp health
If the user asks, “How is BGP doing?” the system has a hard time finding the correct alias to choose. The problem is that “status” and “health” are very similar words, so the system struggles to separate them. Therefore, when aliases are created, it is important to make sure to distinguish aliases with context that adds NL similarity and not NL ambiguity. In this case, better aliases would be:
- bgp overall status
- bgp device health
Once more context is added, the NL query “How is BGP doing?” would correctly map to bgp overall status.
Named Entity Recognition and Structured Labels
Named Entity Recognition (NER) is the NL feature that allows specific queries (such as What is the status of device XTZ123?) to be generalized (What is the status of device yyy? where “yyy” can stand for any device.).
The challenge here is to have NER aware of all possible device label replacements. The process starts with the concept of entity scraping as the Selector Software runs.
Entity Scraping, Enumerations, and Label Autopopulation
Entities for NL processing are structured labels and their corresponding values that are extracted from incoming deployment data. They serve as identifiable data points that can be referenced in structured queries.
Enumerations or Enums are a complete list of all possible values for a given label, as gathered by the Selector software as it runs.
Label Autopopulation is a way used by the Selector Software to gather label values as the software runs, a process called automatic label population.
Together, these three aspects of NER work together to allow NL queries. Each of these concepts is described in this section.
Entities
Examples of entities would be things like:
- Region: USA
- Router ID: XYZ123
These entities help users interact with the system dynamically by allowing queries to reference known data points.
How Does Entity Scraping Work?
The NL query process continuously “scrapes” incoming data from various sources to identify and store entities. This process is performed by periodic pollers that extract relevant information from:
- Loki (log aggregation, etc)
- Prometheus (metrics monitoring, etc)
- MongoDB (database collections)
- Dashboard variables
These pollers can be enabled or disabled based on deployment configurations. In MongoDB, specific collections can also be targeted for entity extraction.
Entity scraping settings, including poller activation and MongoDB collection targeting, can be adjusted in the configuration section of the deployment.
Enumerations
Enumerations (Enums) provide a complete list of all known values for a given label. For example, when querying enums for s2_inst, the system returns all detected instances, such as:
customer1-s2mcustomer1-stagings2dev
Enumerations Improve the Querying Experience
When a user selects a filter value for a label (such as ticker), the NL process automatically retrieves all known values for that label. This provides a list of valid options for the selection, enhancing usability and reducing errors.
While users can select from the suggested values, they can also enter a custom value if needed.
Label Autopopulation
Entity storage in Selector NL processing enables automatic label population in various features. This functionality is leveraged in two situations:
- Maintenance Window (MW) creation (covered in this section)
- Alias resolution (covered in the next section)
Autopopulation in Maintenance Window Creation
When creating a Maintenance Window (MW), users can enable label autopopulation.
Note that:
- If enabled, when a user provides a description during MW creation, the Event Consolidator Service (ECS) queries the NL process for any detected entities.
- If a match is found in the s2_entities table, the MW is automatically assigned a label.
For example, if you create a Maintenance Window with the description
“Ticket opened for the machine 12345”
- If “12345” is a recognized router_id in s2_entities, the NL process automatically assigns a MW label router_id = 12345
This feature streamlines the MW creation process by ensuring labels are applied correctly without manual input.
Aliases and Alias Resolution
Aliases are a core feature of NL processing and enables you to create shortened, more human-readable, and easier-to-remember versions of complex S2QL queries. This simplifies query execution, making it more intuitive and user-friendly.
Example of a Basic Alias
- Alias: all kpi violations
- S2QL Equivalent:
s2ap_infra_health_by_kpi as honeycomb where s2ap_infra_health_by_kpi_violation > 0 show-by kpi_name, s2_inst group-by role, kpi_name, s2_inst
Once this alias is created and saved, you can invoke the query by simply typing “all kpi violations” instead of manually entering the full S2QL query.
When a user submits a query, the Collab Service first checks for alias resolution. If an alias match is found, it is automatically converted to its S2QL equivalent before execution.
Dynamic Alias Resolution
The Selector NL process supports dynamic alias resolution, allowing aliases to include template-like placeholders for entities. These placeholders enable flexible query execution based on user input.
Example of a Dynamic Alias
- Alias: show kpi violations for {{S2_INST1}}
- S2QL Equivalent:
s2ap_infra_health_by_kpi as honeycomb where s2_inst={{S2_INST1}} show-by kpi_name
In this example, the string {{S2_INST1}} acts as a dynamic placeholder that represents an entity value.
How It Works:
- The user types: show kpi violations for s2m
- The NL process detects the S2_INST1 placeholder and substitutes s2m in its place.
- The final S2QL query executed:
s2ap_infra_health_by_kpi as honeycomb where s2_inst=s2m show-by kpi_name
Accessing and Editing Aliases
Aliases are accessed on the UI through their settings:
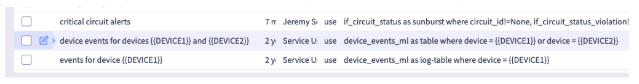
When selected, a list of aliases is displayed:
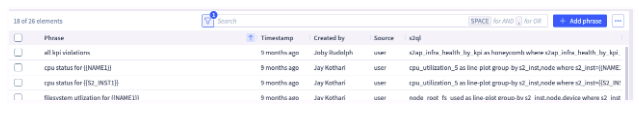
Each alias contains the phrase (alias), some metadata like timestamp and creator, and finally the s2ql.
You can perform CRUD operations from this page. All CRUD operations go through the same endpoint.
One important field to note is the source field. Sources can be these types:
- Users–an alias created by the user
- Widgets–an alias created from widgets by setting name of widget as an alias and the s2ql of widget as alias s2ql
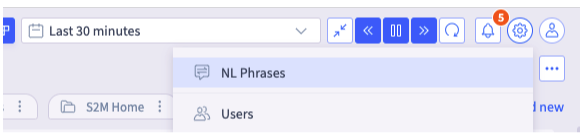
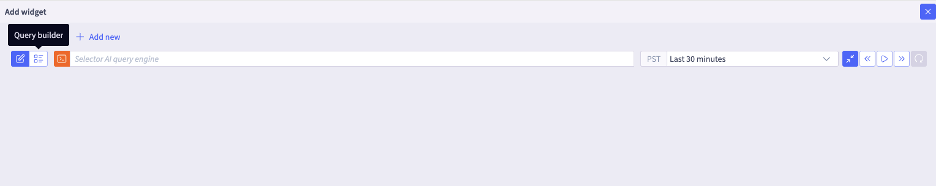
Users
S2AP has an integration function called the Natural Language Phrases List where you can edit, add, and test all aliases. This list can be found on the right-hand side of the query bar at the top:

Through the Actions button you can add an alias like this:
The first entry line is for the actual s2ql queryable. The second line gives the alias name to which the LLM maps.
Widgets
Selector uses widgets in dashboards to show all the necessary data for the customer and the deployment. Widgets form the core representation of what users want to query. For this reason, all widgets are added as aliases where the widget title is the alias name.
Because of this widget aliasing, it is important to establish a good naming convention for widgets to have a good representation of aliases. If a widget is deleted, added, or edited, this is shortly reflected on the Natural Language Phrases List.
Note that widget aliases cannot be edited on the Natural Language Phrases List editor. Therefore, if users want to change an alias of source widget, they must directly edit the main widget.
Intelligent Alias Matching
One of the key advantages of aliases is that they do not require an exact match. You can enter queries with:
- Minor misspellings
- Slight variations in wording
- Different phrasing (e.g., “violations for device” vs. “violations of device”)
NL processing intelligently matches the input to the most relevant alias and processes the query accordingly. This allows for a more flexible and user-friendly querying experience.
Limitations of Entity/Filter Matching
While alias matching is lenient, entities/filters require exact spellings (for example, router_id or s2_inst or region)
Since the NL process performs a direct substitution for these values, they must be spelled correctly and match exactly as stored in the system.
Alias Label Autopopulation
While aliases significantly streamline the query process, their manual construction can sometimes be complex or unintuitive. Users must follow specific rules when inserting template placeholders, and mistakes can result in nonfunctional aliases.
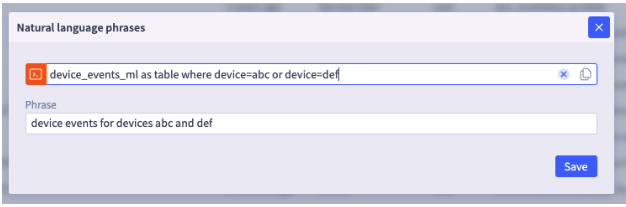
For example, if you want the alias:
“device events for devices abc and def*”*
To resolve to the following S2QL query:
device_events_ml as table where device=abc or device=def
You might struggle with how to define dynamic fields needed:
- Should you use
{{DEVICE}},{{DEVICE1}}, or{{DEVICE_1}}? - How should it handle multiple devices (such as
{{DEVICE2}})?
To address this, the NL process supports alias label autopopulation using entity recognition. Instead of requiring you to manually insert template fields, the NL process can automatically detect and normalize them as follows.
- Create an alias with a natural language query (such as “device events for devices abc and def”) but without template placeholders.
- Enter the corresponding S2QL query as usual.
- The NL process scans the S2QL query for potential filter values (such as
abcanddeffordevice). - The NL process searches for these values in the alias text and dynamically assigns template placeholders where applicable.
- The alias is normalized so that future queries can be processed dynamically without manual intervention.
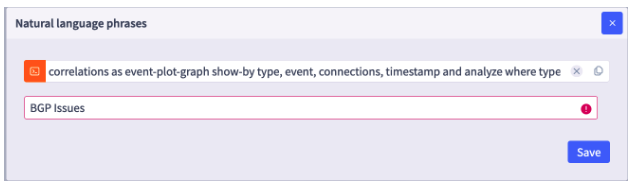
Here is an example:
After clicking save and creating the alias, the alias page appears as follows:
This autopopulation feature is especially useful for those inexperienced with alias creation and/or dealing with aliases that are overly complex. It can also be used to test out the validity of an alias–if the NL process is not able to resolve and normalize, then this entity does not exist in the s2_entities collection.
Best Practices for NL Queries
Here is a brief list of best practices when using NL queries and aliases.
When building NL queries:
Start an existing widget:
1. Use the "NL Phrase" button for the widget.

2. Type in an NL phrase that can be used to invoke the widget. Reference any entities in the s2ql in the NL phrase, and the NL phrase is automatically generalized, such as:

    “*Show me the status of router xxx interface yyy*”
Use the query builder:
1. Get the query built as the user prefers, including filters, sorting, groups, and so on.

2. "Add Phrase"

3. For any entity filters needing to be generalized, ensure that a reference to those entities in the NL phrase.
Use Copilot to build dashboards.
When building NL Aliases:
- Make NL queries at least 3 words long.
- The NL queries should be meaningful.
- Create entity-specific NL queries so that the system learns the broader label names (a generic query is generated from a specific query from created aliases).
- Avoid semantic overlap when possible (status of devices and health of devices).
- Avoid use of phrases like Show me…, What is the…? For example, instead of using show me the status of devices, just use status of devices. The extra words should not cause problems, but it is better to limit the alias to meaningful words.
4 - Queryables Overview
Overview
Queryables are S2AP entities that can be used with the S2 Query Language (S2QL). Queryables are generated from various sources the S2AP platform ingests and integrates through multiple pipelines in the platform. For supported integrations, see the Selector Public documentation.
Queryables can be rendered in various ways for the best visualization purpose. For more details and options for the various renderings see the Data Rendering Section in the S2QL user guide.
The Selector platform comes pre-populated with several queryables that can be used to build insightful and actionable dashboards.
Queryables follow established naming conventions:
- _health: This prefix presents metrics on the health of a resource
- _health_by_kpi: This prefix presents metrics on the health of a resource by KPI
- _status prefix: This prefix presents metrics on the status of a resource
- _rate prefix: This prefix presents metrics on the rate a resource is changing
- _utilization: This prefix presents metrics on the utilization of a resource
- _events: This prefix presents event tables
- _topology : This prefix presents topology tables
- _inventory: This prefix presents inventory tables
Listing Queryables in Your Deployment
You can list the queryables available for your S2AP deployment by doing the following:
- Go to the query builder on the S2AP UI.

- Click on the query builder edit button.
- Click on Export list to get a full CSV list of available queryables for the deployment.
Key Queryables
There are certain Key Queryables that generate tables or metrics. These key queryables are available in the Selector system for querying a device, an interface, overall site health, the inventory, and logs.
These key queryables have been organized into two tables for Metric and Table results to make it easier to find specific queries and outputs.
Note: The queryables described in these tables are not an exhaustive list of all queryables that the platform supports out of the box. Depending on the deployment integrations and configurations, there can be additional ones. Generate the full queryables list from your deployment for all supported types.
4.1 - Metric Queryables
Selector Queryable Metrics
These are queryables that return metrics.
Metric Queryables
| Metric Queryable | Queryable Category | Description | Key usage | Typical Render Views |
|---|---|---|---|---|
| availability | Device Reachability | Tracks the availability when devices are pinged using ICMP | Verify device reachability: operators use this to monitor device ICMP reachability | Honeycomb, line-plot |
| bgp_device_health | BGP Status | Aggregate metric that indicates the health status of devices participating in BGP routing | BGP Monitoring: Used to monitor the status of BGP devices to identify and troubleshoot issues | Honeycomb, line-plot |
| bgp_flap_rate | BGP Status | Aggregate metric that indicates the BGP flap rate in a time period | BGP Monitoring: Used to monitor the BGP link/interface flap rate to identify and troubleshoot BGP issues. | Honeycomb, line-plot |
| bgp_peer_downtime | BGP Status | Aggregate metric that tracks the BGP peer down time to monitor the health status of BGP | BGP Monitoring: Used to monitor the status of BGP devices to identify and troubleshoot issues | Honeycomb, line-plot |
| bgp_peer_state | BGP Status | Metric that indicates the health status of a BGP peer | BGP Monitoring: Used to monitor the status of BGP devices to identify and troubleshoot issues. | Honeycomb, line-plot |
| bgp_peer_status_by_kpi | BGP Status | Aggregate metric that indicates the overall health status of BGP by KPI | BGP Monitoring: Used to monitor the status of BGP devices by KPI to identify and troubleshoot issues. | Honeycomb, line-plot |
| circuit_health | Circuit Health | Tracks the health of Layer 2 circuits | Circuit Monitoring: Monitors circuit health | Honeycomb, line-plot |
| cpu_usage | Device Health | Tracks the CPU usage of devices. | Detailed Device Health monitoring: Allows operators to monitor device CPU usage to prevent device health degradation. | Honeycomb, line-plot |
| device_availability | Device Reachability | Tracks the availability when devices are pinged using ICMP | Verify device reachability: operators use this to monitor device ICMP reachability | Honeycomb, line-plot |
| device_harddown_health | Device Health | Indicates if a device is “hard down” i.e. completely unreachable. This is a critical device liveness, health check via SNMP , ICMP. indicator, | Overall device Health monitoring: Operators monitor devices, and when a device is confirmed to be unreachable via SNMP and ICMP, a high severity alert is typically triggered | Honeycomb, line -plot |
| device_health | Device Health | Aggregate health metric showing overall health status of devices. It aggregates various health signals (such as SNMP, ICMP, CPU, memory etc.) to provide a single health status (e.g., Green/Healthy, Red/Unhealthy) | Overall device Health monitoring: primary metric to monitor overall operational state of the device network fleet | Honeycomb, line-plot |
| device_health_by_kpi | Device Health | Aggregate metric that shows device health status based on specific Key Performance Indicators (KPIs) such as CPU, port, memory, power etc. The value of this metric is derived based on the health of the individual KPIs, and 0 indicates healthy (green), 1 indicates unhealthy (red) | Device Health monitoring: Allows operators to identify the specific KPI (CPU, Health, Memory, Interface, Disk, BGP etc.) causing a device health degradation. | Honeycomb, line -plot |
| device_health_rollup | Device Health | Honeycomb, line-plot | ||
| device_inventory_presence | Device Inventory | Count of number of devices present grouping devices together by model, product | Device Inventory Monitoring: Operators use it to monitor device inventory such as count of devices | Honeycomb, line-plot |
| device_ping_availability | Device Reachability | Tracks availability status of devices based on Pingmesh (ICMP ping) results. It tracks the reachability of devices from various probes. Values include: - -1: Unreachable - 0: No Loss (Healthy) - 1: Total Loss | Verify Network reachability: Operators monitor devices, and when a device is confirmed to be unreachable ICMP, a high severity alert is typically triggered | Honeycomb, line-plot |
| device_ping_health | Device Reachability | Derived metric that is derived from ping availability metrics and feeds into device health and KPI | Verify device reachability: operators use this to monitor device ICMP reachability health | Honeycomb, line-plot |
| device_power_status | Device Health | Metric that tracks the status of device power | Device Health Monitoring | Honeycomb, line-plot |
| device_reset_health | Device Health | Metric that tracks if a device got reset ie device crash or device rebooted | Device Health Monitoring: Allows operators to monitor if a device got reset (crash or restart) | Honeycomb, line-plot |
| device_snmp_availability | Device Reachability | Tracks the availability of devices for SNMP | Verify device reachability: operators use this to monitor device SNMP reachability | Honeycomb, line-plot |
| device_temperature_f_health | Device Health | Metric that tracks the device temperature in farenheit | Device Health Monitoring | Honeycomb, line-plot |
| disk_device_health | Device Health | Tracks the disk health of devices. | Detailed Device Health monitoring: Allows operators to monitor disk health to prevent device health degradation. | Honeycomb, line-plot |
| ec2_instance_health | EC2 instance health | Metric that tracks EC2 instance health | EC2 Monitoring: Operators monitor the health of their EC2 instances running in AWS public cloud. | Honeycomb, line-plot |
| ec2_instance_health_by_kpi | EC2 instance health | Metric that tracks EC2 instance health by KPI | EC2 Monitoring: Operators monitor the health of their EC2 instances running in AWS public cloud. | Honeycomb, line-plot |
| if_admin_oper_status | Interface Health | Aggregate metric that shows agregate of the admin status and operational status of a port (up/down). | Interface Health monitoring: Used to monitor the operational status of network interfaces by various KPIs | Honeycomb, line-plot |
| if_flap | Interface Health | Shows the count of Interface flaps | Interface Health monitoring: Used to monitor interface flaps | Honeycomb, line-plot |
| if_host_status | Interface Health | Shows the status of the host that the interface belongs to? | Interface Health monitoring: Used to monitor interface flaps | Honeycomb, line-plot |
| if_in_errors | Interface Health | Shows the count of interface inbound errors | Interface Health monitoring: Used to monitor interface errors | Honeycomb, line-plot |
| if_in_utilization | Interface Health | Shows interface inbound traffic utilization/throughput | Interface Health monitoring: Used to monitor interface utilization | Honeycomb, line-plot |
| if_out_errors | Interface Health | Shows the count of interface outbound errors | Interface Health monitoring: Used to monitor interface errors | Honeycomb, line-plot |
| if_out_utilization | Interface Health | Shows interface outbound traffic utilization/throughput | Interface Health monitoring: Used to monitor interface utilization | Honeycomb, line-plot |
| if_status | Interface Health | Metric that indicates the status of an interface - good (interface up) , bad (interface down/some issue). Values: 0 (Good), 1 (Bad). | Interface Health monitoring: Used to monitor the operational status of network interfaces | Honeycomb, line-plot |
| if_status_by_kpi | Interface Health | Interface health status based on specific Key Performance Indicators (KPIs). Shows health of kpis for an interface | Interface Health monitoring: Used to monitor the operational status of network interfaces by various KPIs | Honeycomb, line-plot |
| ipsla_device_health | IPSLA | Metric that monitors of IP SLA device health analysing traffic metrics like jitter, latency, packet loss etc. | IP SLA monitoring: Operators monitor IP SLA traffic metrics like latency, jitter, packet loss to track the state of their devices, and network. | Honeycomb, line-plot |
| jitter | Device Reachability | Tracks the jitter when devices are pinged | Verify device reachability: operators use this to monitor device reachability health. When there is high jitter, the device connectivity has issues. | Honeycomb, line-plot |
| l3vpn_vrf_device_status | L3vpn device status | Metric that tracks the L3VPN device status | L3VPN monitoring: Operators monitor the L3VPN VRF status of devices | Honeycomb, line-plot |
| l3vpn_vrf_status | Metric that trcks the L3VPN status | L3VPN monitoring: Operators monitor the L3VPN VRF status of devices | Honeycomb, line-plot | |
| latency | Device Reachability | Tracks the latency when devices are pinged | Verify device reachability: operators use this to monitor device reachability health. When there is high latency the device connectivity has issues. | Honeycomb, line-plot |
| link_monitor_device_health_by_kpi | Link Health | Metric that tracks the state of a link based on KPIs to understand the health of the device. | Link Monitoring: Operators monitor the state of links by KPIs to detect issues in their device health proactively | Honeycomb, line-plot |
| link_monitor_state | Link Health | Metric that tracks the state of a link | Link Monitoring: Operators monitor the state of links to detect issues in their network, data centers proactively | Honeycomb, line-plot |
| lldp_session_status_by_kpi | LLDP | Metric that tracks the status of LLDP sessions by KPIs | LLDP Monitoring: Operators monitor LLDP session status by KPIs undestand the state of their network and devices | Honeycomb, line-plot |
| log_counts | Logs | Metric that counts the total volume of raw logs | Log Monitoring | Honeycomb, line-plot |
| memory_usage | Device Health | Tracks the memory usage of devices. | Detailed Device Health monitoring: Allows operators to monitor device memory usage to prevent device health degradation. | Honeycomb, line-plot |
| ospf_device_health | OSPF status | Aggregate metric that indicates the health status of devices participating in OSPF | OSPF Monitoring: Used to monitor the status of OSPF devices to identify and troubleshoot issues. | Honeycomb, line-plot |
| ospf_if_status | OSPF status | Aggregate metric that indicates the health status of interfaces of devices participating in OSPF | OSPF Monitoring: Used to monitor the status of OSPF device interfaces to identify and troubleshoot issues. | Honeycomb, line-plot |
| ospf_nbr_state | OSPF status | Metric that indicates the health status of an OSPF neighbor | OSPF Monitoring: Used to monitor the status of OSPF devices to identify and troubleshoot issues. | Honeycomb, line-plot |
| ospf_status_by_kpi | OSPF status | Aggregate metric that indicates the health status of devices participating in OSPF by KPI | OSPF Monitoring: Used to monitor the status of OSPF devices by KPI to identify and troubleshoot issues. | Honeycomb, line-plot |
| packet_loss_pct | Device Reachability | Tracks the packet loss when devices are pinged | Verify device reachability: operators use this to monitor device reachability health. When there is 100% packet loss, the device is unreachable | Honeycomb, line-plot |
| port_device_health | Port Health | Metric that monitors the health of a port to catch device health issues proactively | Device Port Monitoring: Operators monitor port health of devices to catch issus proactively | Honeycomb, line-plot |
| power_supply_state | Power Supply state | Metric that monitors the state of the power supply | Power Supply Monitoring: Operators monitor the health of power supplies to get proactive notification on issues so that they can prevent broader outages (server, devices, networks etc. ) | Honeycomb, line-plot |
| rollup_if_utilization | Interface Health | Rollup metric that shows interface utilization | Interface Health monitoring: Used to monitor interface utilization , used in capacity reports | Honeycomb, line-plot |
| sd_wan_device_health | Sdwan Health | Metric that tracks the health of Sdwan devices | Sdwan monitoring: Operators can monitor the health of Sdwan devices | Honeycomb, line-plot |
| site_bgp_status | Site BGP Status | Aggregate metric that indicates the BGP status of a site, based on the aggregate of all BGP devices in that site | BGP Monitoring: BGP Monitoring at site level to identify and troubleshoot issues. | Honeycomb, line-plot |
| site_harddown_health | Site Health | Aggregate metric that indicates if a site is “hard down” i.e. all devices in the site are completely unreachable. This is a critical device liveness, health check via SNMP , ICMP | Overall Site Health monitoring: Operators monitor health of the overall site, based on the aggregate of health of all devices in that site. When an entire site is unreachable (because all devices are unreachable via SNMP and ICMP), a high severity alert is typically triggered. | Honeycomb, line-plot |
| site_health | Site Health | Aggregate health metric showing overall health status of site. It aggregates various health signals to provide a single status for site health (e.g., Green/Healthy, Red/Unhealthy) | Overall Site Health monitoring: Operators monitor health of the overall site, based on the aggregate of health of all devices in that site When an entire site is unreachable (because all devices are unreachable via SNMP and ICMP), a high severity alert is typically triggered. | Honeycomb, line-plot |
| site_health_by_kpi | Site Health | Aggregate health metric showing overall health status of site KPIs. It aggregates various KPI signals to provide a single status for site KPI health (e.g., Green/Healthy, Red/Unhealthy) Shows health of KPIs for a site | Overall Site Health monitoring: Operators monitor health of the overall site KPIs, based on the aggregate of health of all KPIs for that site. | Honeycomb, line-plot |
| sys_uptime | System Health | Metric that tracks system uptime - time since the device has been up. | Device monitoring | Honeycomb, line-plot |
| tunnel_status_by_device | Tunnel Status | Metric that tracks IPSec tunnel up/down status for a device. Tunnel up is red, Tunnel down is green | Tunnel Status: | Honeycomb, line-plot |
| wilc_ap_failed_count | Wireless Monitoring | Metric that tracks the failed Access Point (AP) count | Wireless Monitoring: Operators use this to monitor their wireles devices (AP, Wireless lan controller) . Single pane, unified view across wireless and wired with Selector | Honeycomb, line-plot |
| wlc_ap_connect_count | Wireless Monitoring | Metric that tracks the cconnected Access Point (AP) count | Wireless Monitoring: Operators use this to monitor their wireles devices (AP, Wireless lan controller) . Single pane, unified view across wireless and wired with Selector | Honeycomb, line-plot |
| wlc_max_clients_count | Wireless Monitoring | Metric that tracks the count of max clients connected to an Access Point (AP) | Wireless Monitoring: Operators use this to monitor their wireles devices (AP, Wireless lan controller) . Single pane, unified view across wireless and wired with Selector | Honeycomb, line-plot |
4.2 - Table Queryables
Selector Queryables Table
These are queryables that return tables.
Table Queryables
| Table Queryable | Queryable Category | Description | Key usage | Typical Render Views |
|---|---|---|---|---|
| audit_logs | Audit logs | Table of Audit logs | Auditing and compliance Monitoring: Trackers users, and their key actions on S2AP and timestamps. | Table |
| configs_diff | Config change monitoring | Tracks if a device config has changed from a previous snapshot. Ex. Ip address changed of a device | Configuration change monitoring: Operators can monitor configuration changes to be able to pin point causes of issues. | Honeycomb, line-plot |
| correlation_events | Correlated Insights | Table that stores correlated events metadata, the records in this table are correlated and anchored by specific labels to improve event grouping. | Correlated Insights: Used to monitor correlated events to get a comprehensive view of root cause of issues | Table |
| correlations_summary | Correlated Insights | Table that stores the summary of correlated events used in the correlations graph and dashboards | Table | |
| device_event_patterns | Device Events | Table that stores structured log event patterns from networking devices. Event patterns are categorized as .. to facilitate trend analysis and automated correlation. | Log Pattern Analysis: Used for analysing network event patterns from logs | Table |
| device_events_ml | Device Events | Table that stores structured log event stream from networking devices that have been processed and modeled using Machine Learning. Unlike raw logs, these events are categorized (e.g., Interface Flap, BGP Peer Down) to facilitate trend analysis and automated correlation. | Log Pattern Analysis: Used for analysing network event patterns from logs | Table |
| device_events_pattern_groups | Device Events | Table that stores structured log event patterns and groups from networking devices. Event pattern groups are categorized to facilitate trend analysis and automated correlation. | Log Pattern Analysis: Used for analysing network event patterns from logs | Table |
| device_logs | Device Logs | Table that stores the raw logs ingested from the network devices. This contains the original log messages, timestamps, and severity levels without the ML modeling layer. | Raw logs analysis and troubleshooting | Honeycomb, line-plot |
| devicediscovery | Device Discovery | Table that contains the raw device discovery inventory | Table | |
| interface_database_inventory | Interface Inventory | Metastore Inventory table containing detailed information about network interfaces. It provides metadata such as interface names, descriptions, speeds, types, and connected remote devices. | Contextualize interface metrics with interface config metadata | Table |
| ipsec_logs | Table | |||
| ipsec_reason_events_ml | IPSec state | Table that stores IPsec events information | Table | |
| isp_inventory | ISP Inventory Table | Table that stores key isp information for devices | ISP inventory: | Table |
| layer2_topology | Layer 2 Topology | Table containing Layer 2 topology data. | Layer 2 Topology Inventory | Table, Topology map |
| lldp_table | LLDP | Table that holds LLDP inventory (Link Layer Discovery Protocol) | LLDP Monitoring: Operators use LLDP to discover device topologies, and build a topology map | Table |
| s2_device_inventory | Device Inventory | Metastore inventory table containing detailed metadata about all network devices. It serves as the source of truth for device attributes like Vendor, Model, Operating System, Site, Location, and Roles. | Contextualize metrics and logs with device metadata | Table |
| s2_if_metatags | Interface Metadata | Interface metadata? | Table | |
| s2_query_trace | Query Metadata | This table stores query details such as S2QL or Natural Language queries, usage metrics, user who executed the query and the time to return a response. | Query monitoring: Operators use this to track details around the queries being executed by users, their usage and the performance of those queries | Table |
| s2_snow_incidents | Service Now Incidents | Table that stores the SNOW incidents data | SNOW Incident monitoring | Table |
| s2_snow_incidents_analysis | Service Now Incidents | Table that has Service Now Incidents data for incident analysis dashboards | SNOW Incident monitoring | Table |
| s2_snow_inventory | Service Now Incidents | Table that stores the SNOW incidents data | SNOW Incident monitoring | Table |
| snmptrap_default_event | SNMP Traps | Landing table for initial ingestion of SNMP traps | SNMP Trap monitoring | Table |
| synthetics_topology | Synthetics | Table that has the synthetics probe inventory. | Table | |
| sys_logs | Device Logs | Table that stores the raw system log stream ingested from the network devices. This stream contains the original log messages, timestamps, and severity levels without the ML modeling layer. | Raw logs analysis and troubleshooting | Honeycomb, line-plot |
| topology_bgp | Topology State | Table that stores BGP topology data | Topology State: Operators use this to get BGP Topology information | Table, Topology Map |
| topology_isis | Topology State | Table that stores ISIS topology data | Topology State: Operators use this to get ISIS Topology information. | Table, Topology Map |
| topology_l3vpn | Topology State | Table that stores L3VPN topology data | Topology State: Operators use this to get L3VPN Topology information. | Table, Topology Map |
| topology_ldp | Topology State | Table that stores LDP topology data | Topology State: Operators use this to get LDP Topology information. | Table, Topology Map |
| topology_ospf | Topology State | Table that stores OSPF topology data | Topology State: Operators use this to get OSPF Topology information. | Table, Topology Map |