System Analytics
WAN Analytics
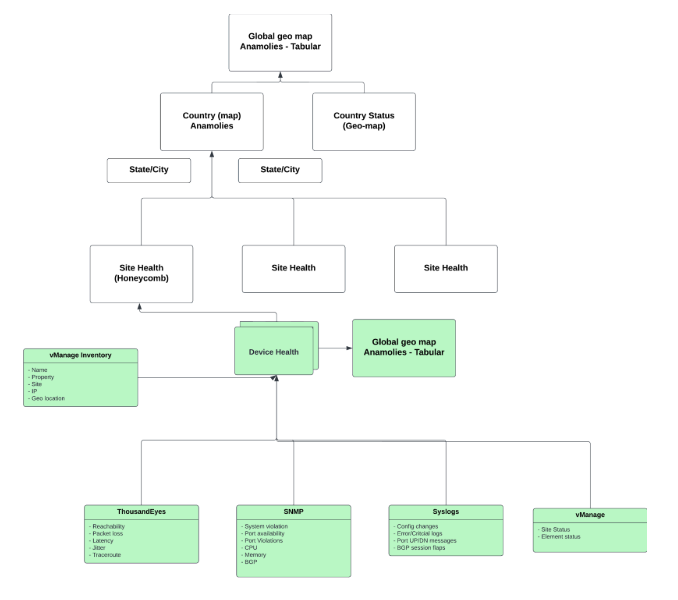
The network may face performance degradations for a variety of reasons. The issue could be intermittent or there could be an outage. While it’s important to monitor the WAN metrics to predict performance degradations, it is also important to identify the issues based on multiple data sources. Errors such as port errors/discards are seen over SNMP, but other events such as system reboots are conveyed by syslogs. Consolidating all the data sources to identify the health of a device is crucial.
Selector can gather events and information from various “virtual edge” sources, whether over the Internet, from wireless portions such as LTE, or tunneled portions using MPLS.
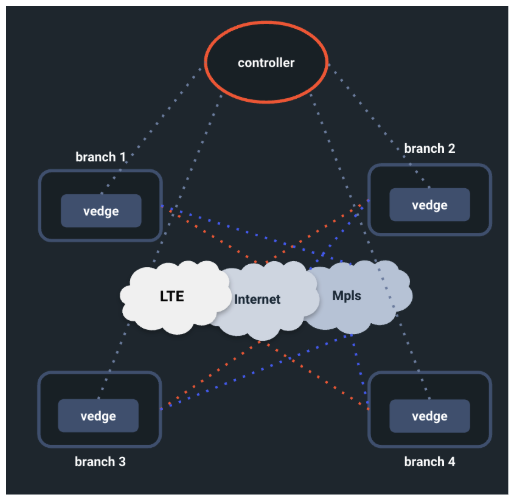
The Selector POC considers the following data sources for WAN analytics:
| Data Source | Type of Ingest |
|---|---|
| Vmanage | API (Rest Poller) |
| Syslogs | Direct syslogs over udp/514 |
| Snmp | SNMP engine (60s poll interval) |
| Thousand eyes | API (Rest Poller) |
As part of the solution, the platform uses the following integrations:
- SNMP—This integration is based on SNMP OIDs. The polling frequency is tunable and currently set to 60 seconds by default. Adding a new OID is as simple as navigating to the integrations page and adding a new group to poll.
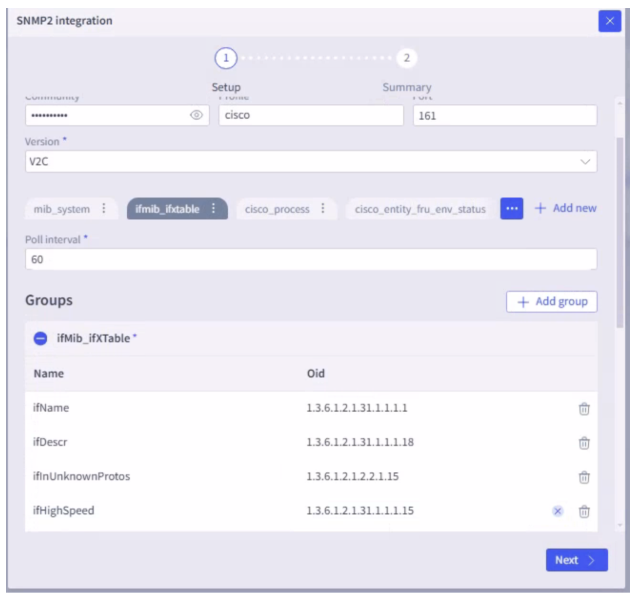
Various data points are collected, such as system, interface, CPU, memory, BGP, and so on.
- REST poller—The Selector platform has a rest poller integration for data sources that need to interact using rest APIs. The platform can perform GET and POST commands to process the raw data.
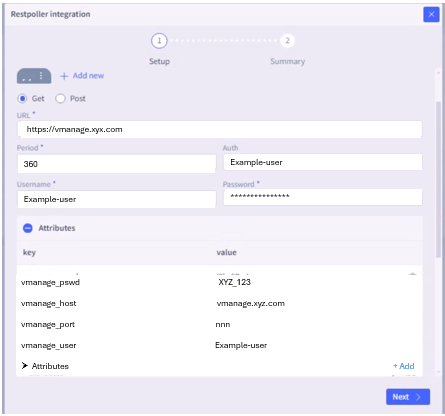
Other integrations are used to ingest vmanage and thousand eyes KPIs.
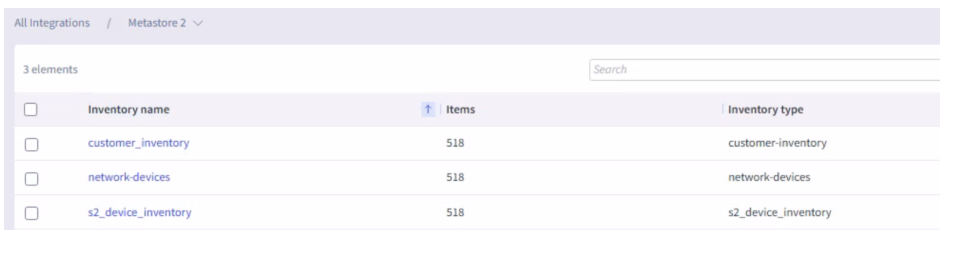
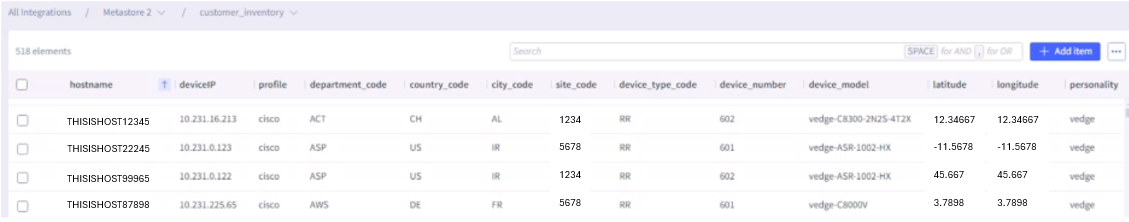
Inventory—Selector can have a configuration management database (CMDB) that is used to build an inventory of all the devices. The metastore2 integration helps to ingest static files provided with device name and latitude and longitude information used to display devices over a geographical map. Inventoried devices are polled by the SNMP engine to capture various metrics such as interface name, utilization, and so on. The table contains both WAN and wireless devices. If there are new fields that need to be ingested, the schema is modifiable. The Selector platform can collect configuration data through SSH or 3rd party integrations such as GIT, and track configuration changes, but the platform does not participate in configuration changes to the devices directly. Selector can also work with 3rd party configuration and automation platforms for configuration automations. Selector’s device-discovery capabilities enable customers to scan the network environment, identify devices, and populate Selector’s integrated CMDB.
Detected devices are matched to a device profile to enable the automated instrumentation and monitoring of those devices.CMDB inventory status fields indicate the state of each device, which can be factored into alerting and notification workflows.
As an open data platform, Selector readily integrates with data sources and downstream services and can integrate with CMDB or ERP platforms as required.
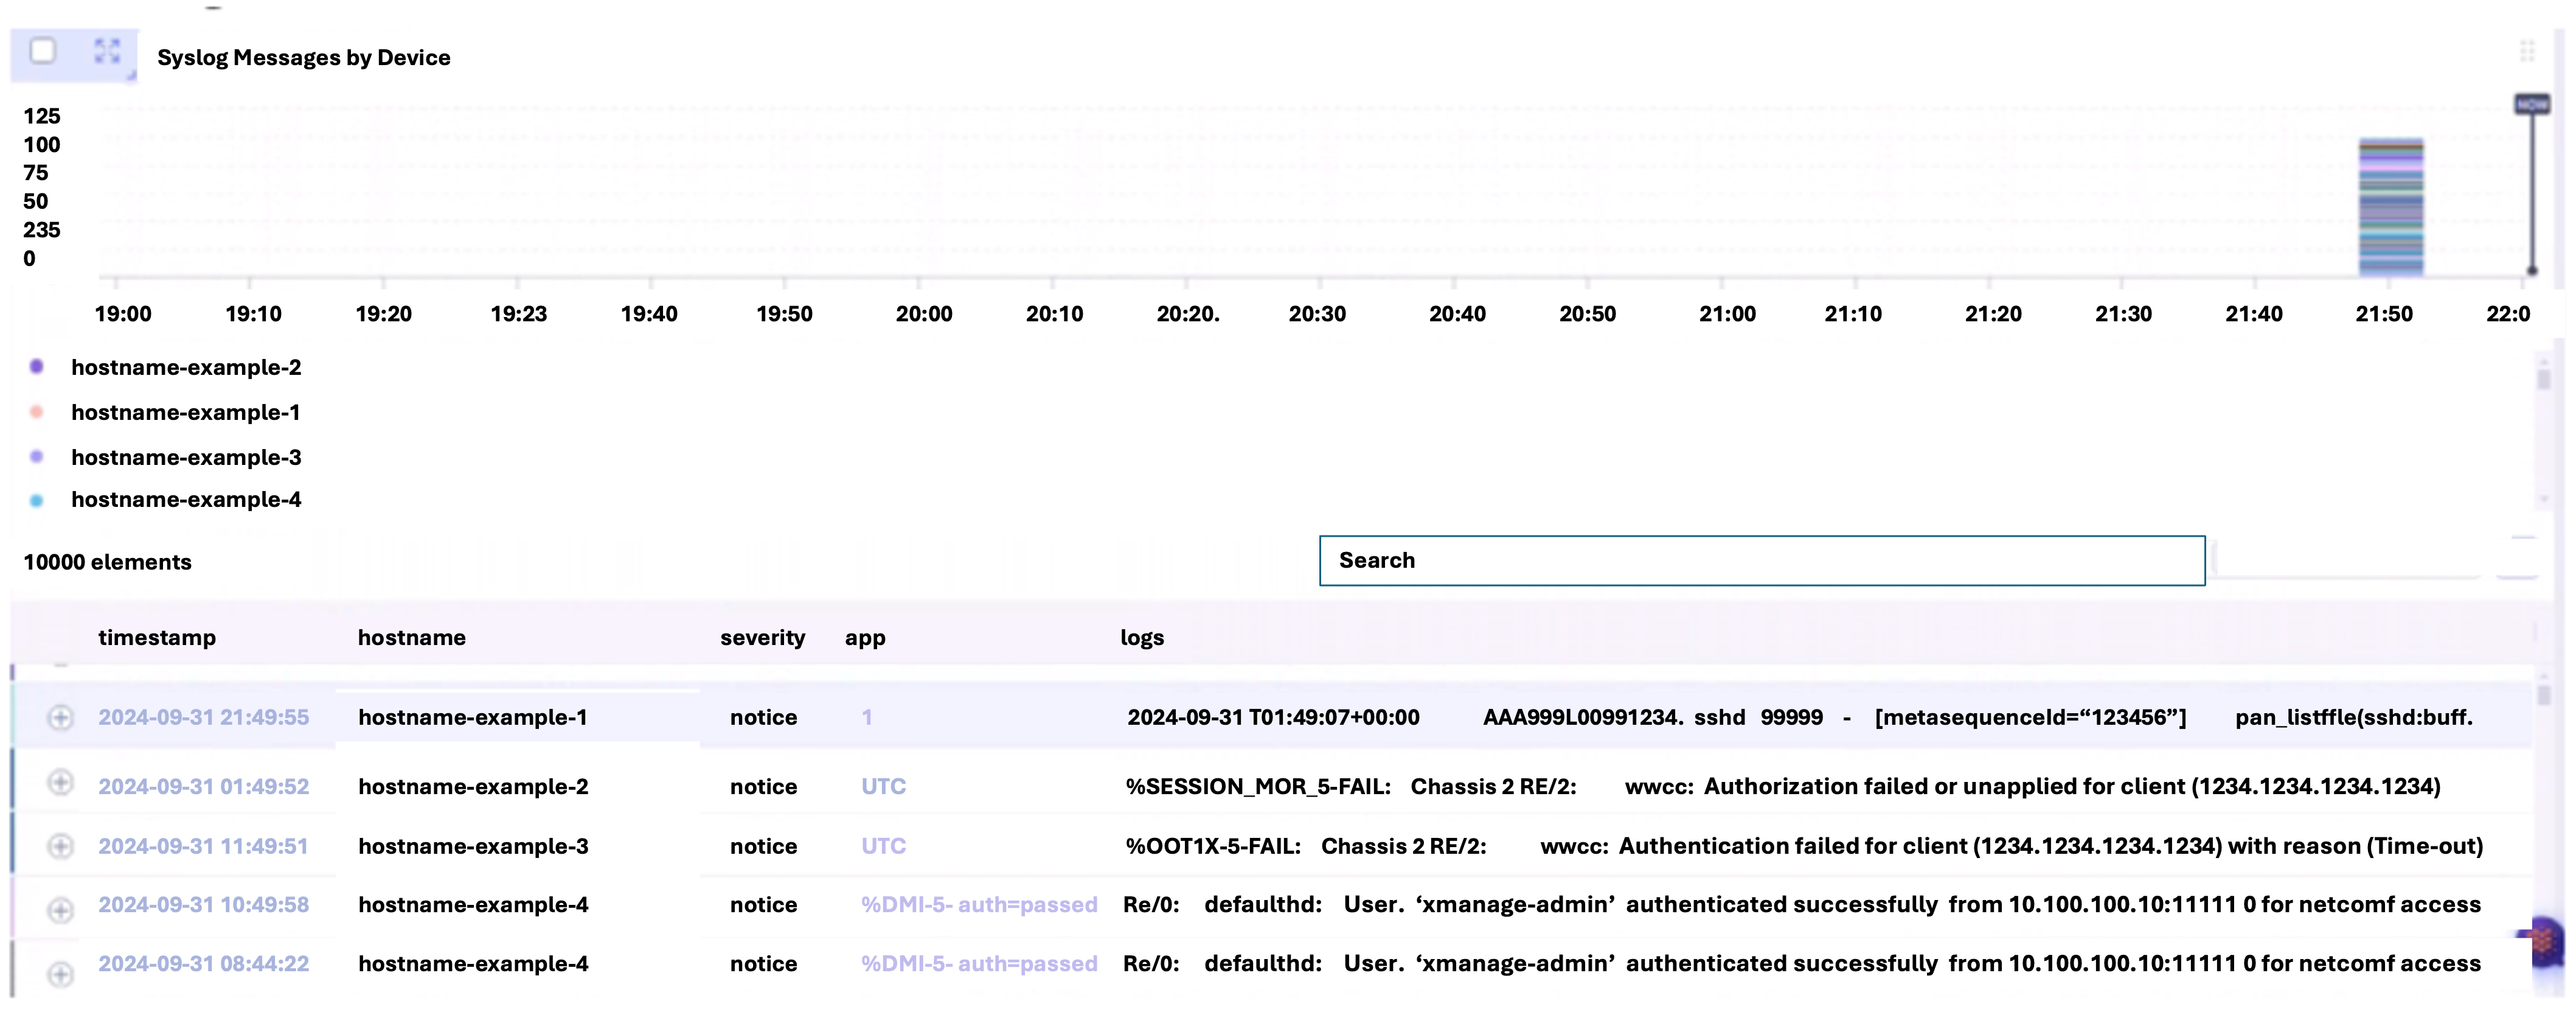
- Syslogs—Selector is capable of ingesting syslogs, as mentioned in the previous section. The syslogs can be mined for patterns and further used in correlations. The logs that are redirected to the platform on UPD port 514 are ingested. Raw logs are converted to events through a process of labeling. Both raw logs and labeled logs can be viewed. Selector further leverages a combination of AI and ML to analyze log messages, identifying patterns and anomalies related to the rate, severity and content of the logs. This capability automatically identifies anomalies and the context of those anomalies, enabling correlation, root cause analysis, and ticket consolidation.
Raw Logs View
Device_event_ml Table
Labeled logs are continuously trained and a model is created for inference. Any newly generated logs matching the respective labeled pattern are automatically identified as an event which further powers the correlations from the data sources.
Additionally, if there are data sources needing to use a python-sdk, the Selector platform can handle as well. For netflow, the Selector platform has a netflow collector to process these packets.
Wireless Analytics
The Selector platform can ingest data from multiple sources. When part of a POC, the wireless analytics are derived from ingesting metrics from various data sources. Correlated events can be identified to gain insights related to clients connecting to access points (APs). The performance of the APs can be derived leveraging all the data from WLC, controllers and switches (soon). End-to-end correlation within a given site are based on contextual data and joining across switches and routers at the site.
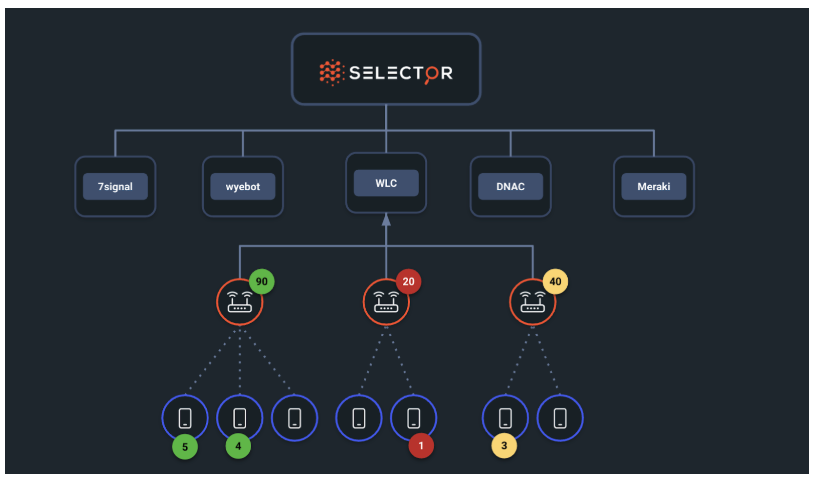
Selector considers the following data sources for wireless analytics:
| Data Source | Type of Ingest |
|---|---|
| Meraki | API |
| DNAC | API |
| Wyebot | API |
| WLC | SNMP, Syslog |
The Selector platform ingests these data sources as part of a wireless observability POC. The mechanisms are the same for WAN analytics.
In addition to ingestion, the process of generating device health, creating an aggregated health for the WLC, and correlating the events are the same for WAN analytics. From the Selector platform perspective, the key parameters are metrics and labels. These are used to display various dashboards and therefore the process remains the same.
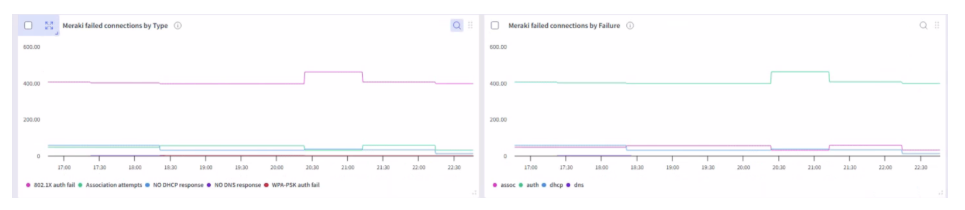
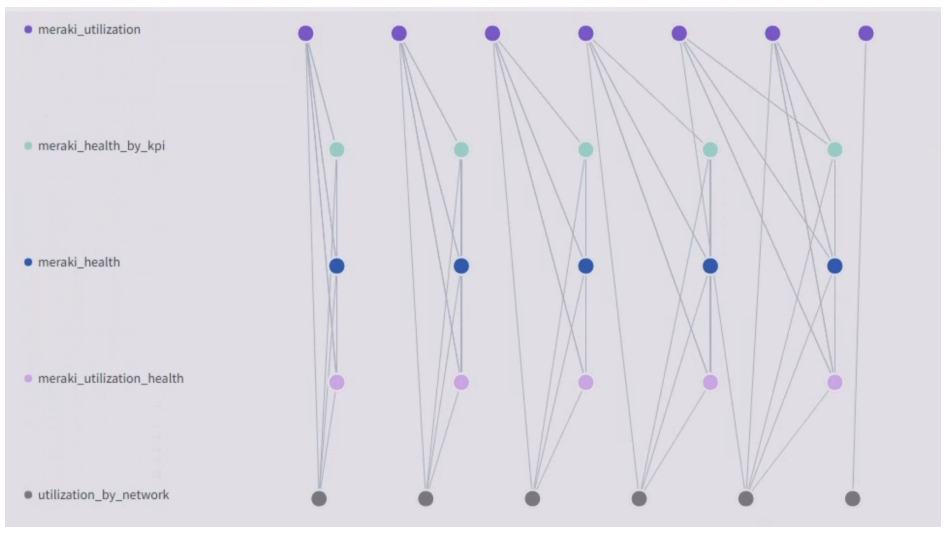
Representation of Meraki
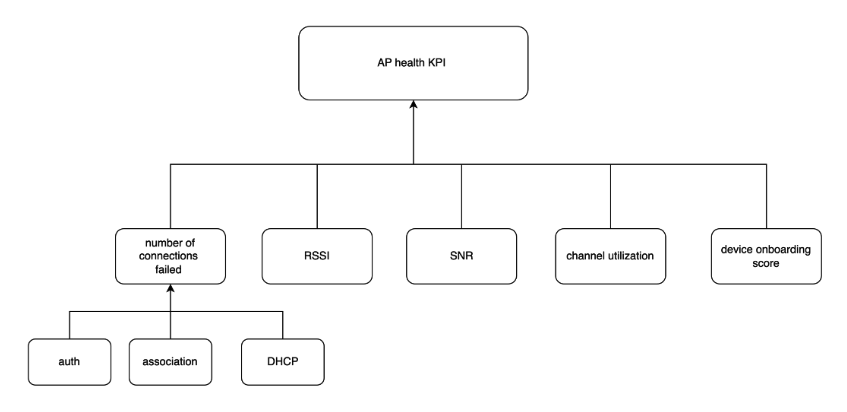
Honeycombs are created for different data points, such as SNR, RSSI, Onboarding, and so forth. Violations are computed based on defined thresholds. The Selector platform can also add derived metrics such as channel switch identification, interface flaps, flap rate, and so on. This tracking is extensible if needed.
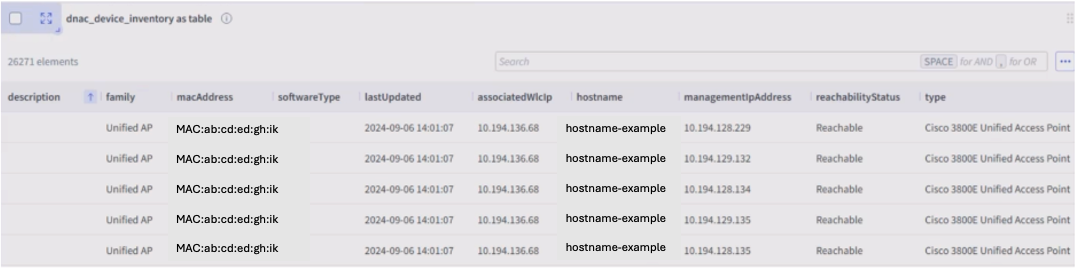
DNAC
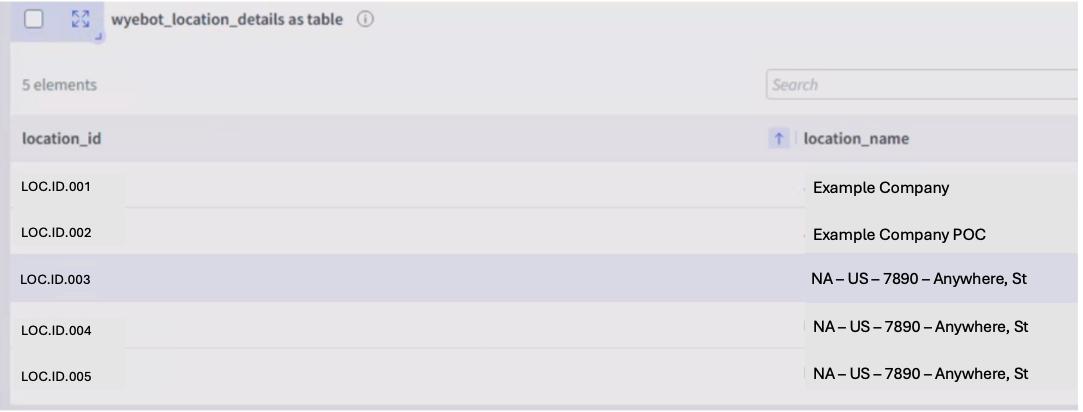
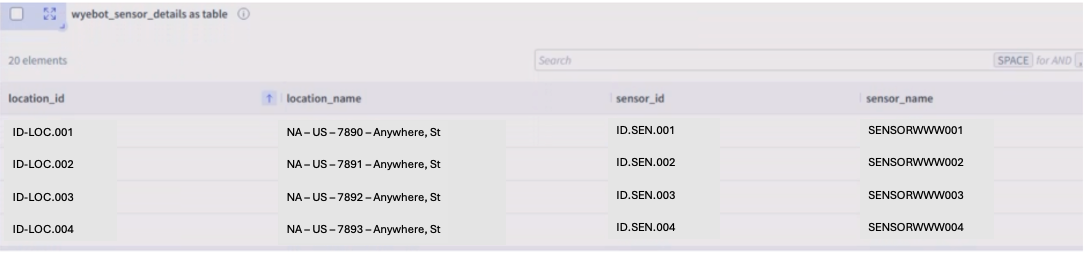
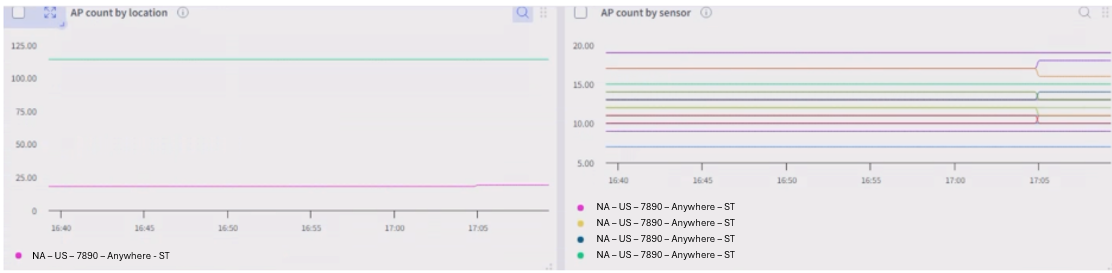
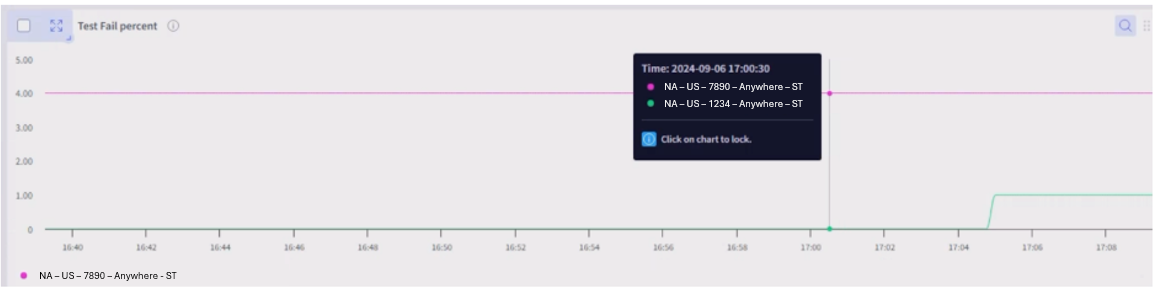
Wyebot
Correlations
Wireless correlation is the same as with the WAN analytics.
Health Report
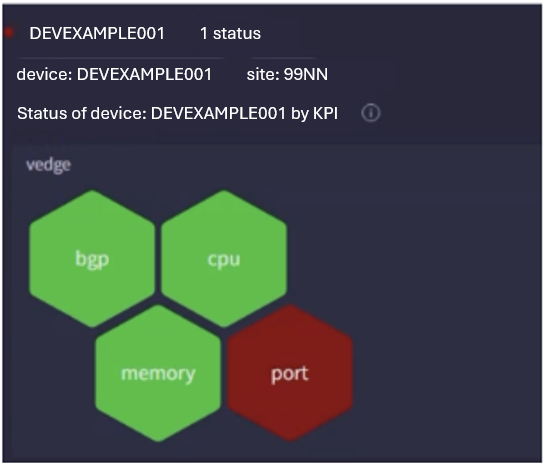
The health report for a site is built based on multiple kpi violations. The report considers all devices associated with a site such as routers, switches, and so on. The violations help in “bubbling up” site health depending on the device and number of impacted devices.
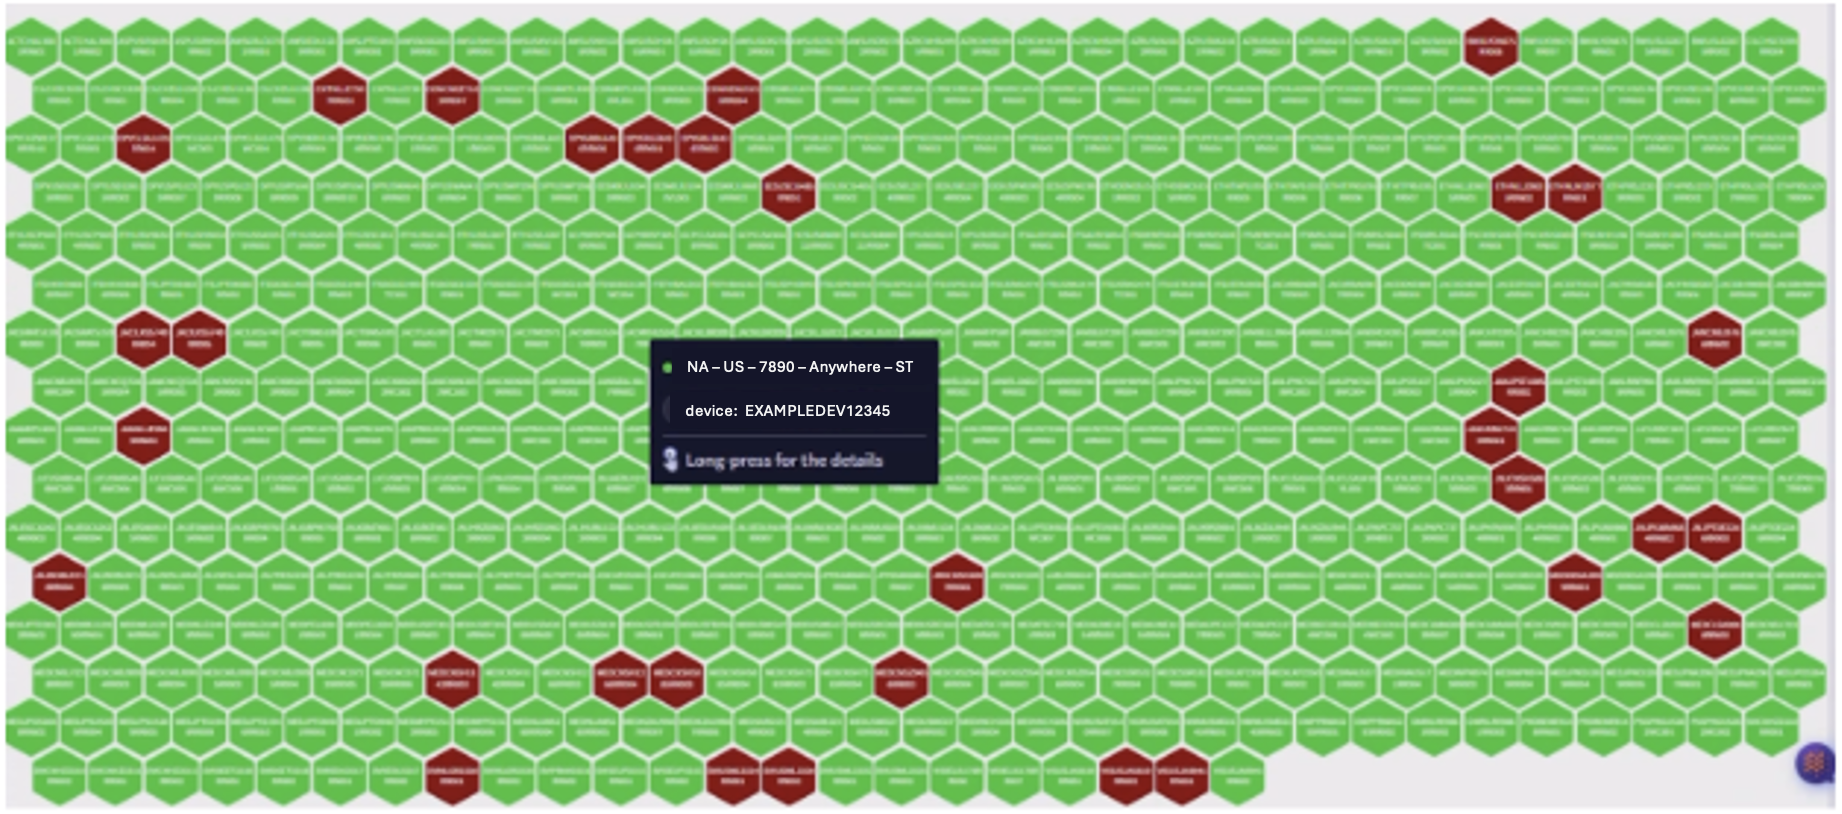
Each device can then be drilled down to reveal respective metrics and contributing KPIs for violations for behavior understanding.
Geographical maps are created to represent the devices or sites and to identify and show violations. Drill downs are created to allowing simpler user to query. For geographical maps to work, the latitude and longitude values need to be provided. These can come from inventory tables in vmanage or provided static files.
Site level views are created to easily navigate based on site ID instead of device name or region.
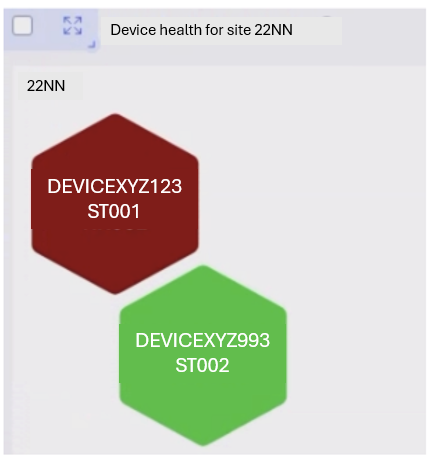
Long presses provide drill-down views on the same screen.
Report Generation and Exports
Users can generate automated reports on a monthly, weekly, or daily basis to generate network insights. These reports can be automated as emails as well, and the timeline is customizable. In addition, Selector can export data as either a PDF or in CSV format.

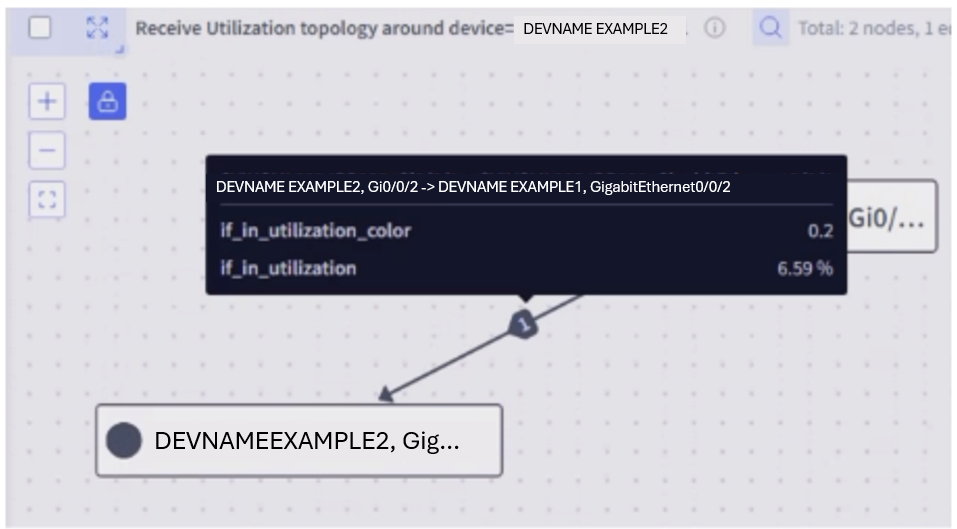
Topology Representation
The topology of a given site or across and between sites can be identified using. For example, LLDP and CDP data. These are obtained from SNMP and the topology is constructed based on identification of network nodes and edges.
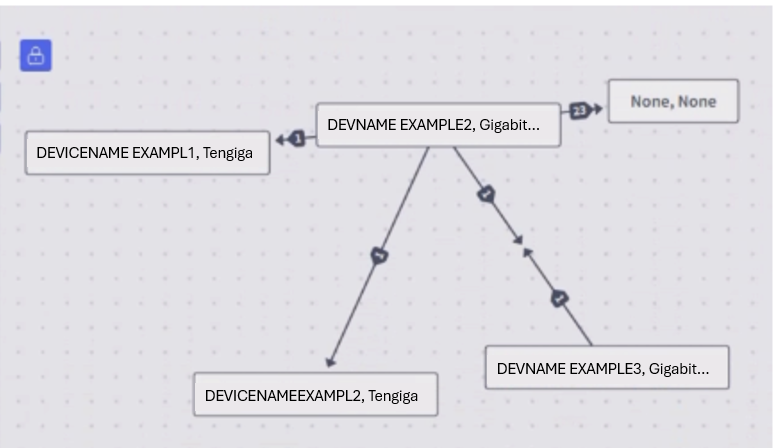
Selector can also overlay metrics and color code in addition to representation. Customized color code definitions are also possible.