This is the multi-page printable view of this section. Click here to print.
Getting Started
1 - Introduction to Selector
Overview
Selector is an AIOps and event intelligence platform that enables operations teams to quickly detect and remediate incidents before customer-facing impact. It is a unified monitoring, observability, and event-intelligent AI for IT Operations (AIOps) platform. It provides a single pane of glass view and key functionality that was historically addressed by multiple tools. Selector’s innovative platform enables operations leaders to address tool sprawl, cut costs, enhance operational efficiency, and focus efforts on improving the customer experience.
Once network and infrastructure data are collected, Selector applies AI and ML to drive powerful features such as event correlation, root-cause analysis, and smart alerting. With Selector, operators gain comprehensive visibility across their network environments and dramatically lower the operational burden in detecting and remediating problems.
Selector supports purpose-built capabilities to enable operations teams to better detect, identify, and resolve operational issues.
A declarative Extract-Transform-Load (ETL) process enables rapid integration with various data sources spanning network, infrastructure, application, and configuration data. This ability to ingest data from any push-or-pull data source (SNMP, Netflow, GRPC, etc.), through any type of transport, helps ensure comprehensive collection of telemetry from WAN devices, wireless devices, controllers, and applications. The data is further normalized to help perform correlations accordingly.
ML-driven autocorrelation and related root-cause analysis provide teams with consolidated, actionable alerts within their preferred collaboration platform. Customers can further automate various operations activities such as ticket creation, maintenance, and automated incident remediation.
The Selector platform has robust notification and ticketing capabilities, with connectors for ServiceNow, Jira, ServiceDesk Plus and many others. Selector is further able to integrate with proprietary platforms as well. Additionally, some customers leverage Selector directly as their ITSM.
A novel Natural Language Model (NLM) using conversational AI helps eliminate the inefficiencies and costs associated with the patchwork of disparate operational tools found in the modern enterprise. GenAI-driven natural language querying allows everyone to interrogate the IT environment, enabling faster identification and resolution of issues.
Selector’s Digital Twin feature dynamically models customer networks and infrastructures. The resulting model enables customers to explore hypothetical situations to predict failures, optimize resource allocation, and inform strategic planning.
The Selector platform is Kubernetes-native, making it easy to deploy on-premises or in a customer’s cloud. Selector also provides a SaaS service, making it easier for the customers to use.
2 - System Architecture
Overview
The Selector platform is constructed around four functional layers:
Data Collection Engine - Entry point for data in the system.
Data Hypervisor - The data plane where data gets normalized and enriched for further processing by upper layers.
Knowledge Service - Data is processed and ML analytics are performed.
Collaboration Service - Exposes the various interfaces for the user to interact with Selector Analytics.
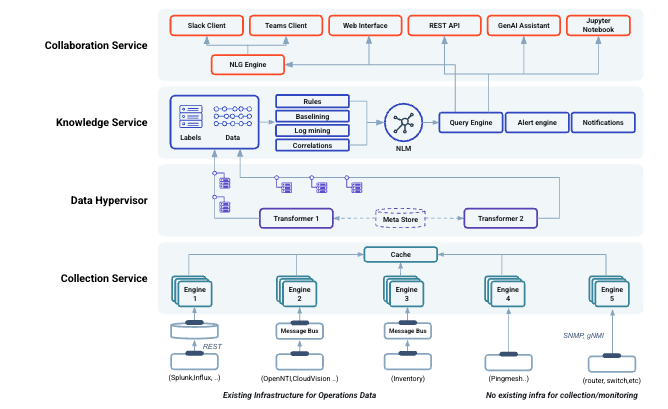
Data Collection Engine
Selector Analytics has access to a wide variety of data sources through a set of custom-built collection engines that leverage both push and pull technology.
We collect data from existing monitoring systems such as Solarwinds, Datadog, or Zabbix, as well as log collection systems like Splunk. For these cases, we have pre-integrated engines for each of these systems, making them plug and play. Selector Analytics can also collect data directly from monitored entities (e.g., network devices using SNMP collection, gNMI, syslog, Netconf/CLI, etc.).
All the collection engines are cloud-native and are designed to be able to scale out. The data collection layer is the entry point of the data for the system, and it plays a key role in bringing the wide variety of data that may be necessary for our mission: answering complex questions.
There is another collection capability that is fundamental for the proper infrastructure observability and correlation: inventory. Selector Analytics can connect to an existing inventory or CMDB tool, consume static inventory definitions from a file or dynamic definitions via an API, integrate with an existing Netbox instance or provide inventory as a service using our own Netbox instance. Any of these mechanisms allow us to populate the Selector Analytics Metastore with data that will be used for real-time telemetry and event enrichment. For synthetic testing, lightweight software agents are available to be deployed in servers, VMs, network devices, etc.
Data Hypervisor
Data is ingested from different types of sources, and each one has its own characteristics, schema, encapsulation mechanisms, etc.
Depending on the nature of the data, the type of storage and processing it will require will also be different, which leads to the need to have different mechanisms for that purpose. Standalone data sources lack context, which is necessary for proper analysis, so it must be enriched with the necessary metadata (usually in the form of labels) to make it useful. That context also allows data coming from different sources to become connected so that they can be cross-correlated (metrics, events, logs, configuration, operational state, flow data, etc.)
The hypervisor is in charge of decoupling the physical infrastructure from the applications and provides an abstract view through the concept of VMs, or containers. Our data hypervisor provides the equivalent functionality for data processing: decoupling the various and different types of data sources, normalizing the data and providing a source agnostic mechanism to extract, enrich, process and redirect the data to the right storage repositories, adequate to each type of data.
We use ML in the Data Hypervisor to automatically extract information from logs, events, and traps despite having unstructured or semi-structured content.
Traditional architectures need hundreds or thousands of regex rules to be created and maintained for that purpose. We use ML techniques to automatically infer and extract the relevant entities and cluster various events into meaningful types. The Data Hypervisor again plays a key role in the delivery of our mission, enabling the processing of any type of data and enriching the data with the contextual information necessary to answering complex questions.
Knowledge Service
The knowledge service uses data and algorithms to answer IT / operational questions. Our ML engine will automatically detect anomalies on any metric and/or apply heuristics-based rules when configured to do so. Alerts will be raised upon anomalies detected, which will be cross-correlated by our ML engine in the Knowledge Service and ranked with other alerts or events on the system. This process provides a cohesive view of the data received from different sources.
The Knowledge Service is the brain of the platform.
It not only provides the insights required to detect and correlate potential problems within the infrastructure, but also provides the interface to query any data on the system, regardless of the type (metric, events, logs, alerts, etc.). It plays a fundamental role in the Selector mission: provide the right answer to the questions, provide visibility of the problems, whether known or unknown.
At Selector Analytics, our goal is to answer questions, but do it in a way that is operationally affordable. The days of programming hundreds or thousands of rules on a system to analyze logs, set thresholds, raise alarms and correlate events are gone. Networks and IT infrastructure have grown in size and complexity to a level where it is humanly impossible to deal with them using rules. Knowledge is necessary to answer questions, and machine learning techniques are used to extract that knowledge from the data, transform it, analyze it, correlate it with other analyzed data and make that knowledge available through the natural language interface.
Collaboration Service
If having the right answer to a question is important, it is also important to make it easy for users to ask their questions, and get the required answers in the right time, and in the right place.
The goal of the collaboration layer is to provide a human-centered set of interfaces to facilitate collaboration. With seamless integration in Slack and Microsoft Teams, network operation engineers can interact with the Selector Analytics from their collaboration tool of choice, without the need to switch to other interfaces.
It is possible to articulate the questions that need answers using natural human language, and get the right answers, in real-time, right there. It is also possible to get notifications and alerts directly in Slack or Microsoft Teams, and troubleshoot them from the same channel by issuing the necessary follow up questions (in natural language) to the Selector Analytics chatbot
Static dashboards are yesterday’s way of finding data. Our dashboards can be dynamically rendered as a result of the questions asked in Slack, for example, and all the operations teams can have joint access to the information to troubleshoot and address a network or IT incident.
Operations teams need the relevant information to be rendered in order to analyze a problem, for the specific context, and in the place that it is necessary. The days of having to learn complex structured query languages to find the information you need, across multiple tools, are gone. Operations engineers need to be able to articulate questions using natural human language and get the responses they need.
The Selector Analytics Platform mission is to find the right answers to the operational questions in the right time, the right place and the right way – and collaboration service plays a key role.
3 - End-User Features
Overview
The Selector platform is more than just a model of features and a series software packages. The use of AI and ML allows Selector to implement several related and helpful end-user features.
Sample Network Operations Use cases
Event Correlation and Root Cause Analysis for Smart Alerting
Forecasting and Predietive Analysis
Copilot and Natural Language Queries
The Role of Kubernetes in Auto-Scaling
Selector has a number of attractive features. These features are listed here and detailed below:
-Storage for On-Premises Solution
Time-Series Anomaly Detection
Selector performs time-series analysis using proprietary AI and ML strategies to identify deviations from the expected values; that is, anomalies. A combination of dynamic and static thresholds provides the flexibility to handle various use cases. The resulting events are enriched with context, such as location, interface name, model, and so on, which further help with contextual correlation.
Selector offers powerful anomaly detection, outlier detection, and correlation capabilities that support the rapid detection of emerging incidents and points staff towards the probable root cause of those incidents. Composite alerting enables customers to leverage a combination of alerting conditions to further filter and tune the types of alerts and notifications sent to staff.
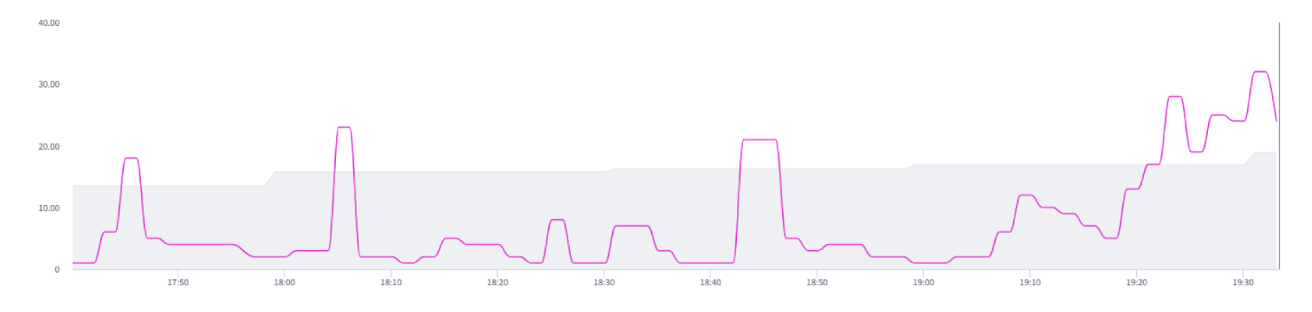
Auto-Baselining for Time-Series Anomaly Detection
- Selector’s “Auto-Baseliner” ML service computes and adjusts periodically a baseline and corresponding threshold for all time-series-based metrics
- This dynamic threshold helps determine the overall “health” of the metric and allows for intelligent detection of anomalies
- Any incoming data for the metric is measured against this dynamic threshold and manifest in color to represent health (red or green) in relevant visualizations
- Auto-baselines with dynamic thresholds coupled with the Alerting and Notification feature unleashes the power of AI in Selector to detect, alert, and notify users on anomalies in time series metrics
Outlier Detection
- An outlier is a data point that lies far beyond the other values in a sample from a general population
- An outlier is also an observation that lies an abnormal distance from other values in a random sample from a population
- Outliers allow for proactive detection of potential problems or anomalies in the network
- The feature is implemented using Z-score-based ML
Sample Network Outlier Use Cases
- Alert to investigate potentially anomalous conditions developing for performance or health or capacity of key network devices (such as optical transceivers) and data transfer
- Identify SecOps concerns brought on by significant point-in-time deviation of key networking metrics
Hazardous Conditions (Hazcons)
- Hazcons are “bigger picture” conditions represented as a key network metric threshold violation which signal an imminent threat to the system or regional network operation
- Hazcons typically warrant immediate attention to prevent potential disruption or downtime or an SLA violation
- Alert Rules and Notifications must be defined
- Relevant dashboards showing the key metrics related to the Hazcon allow drilldown for Root Cause Analytics
Examples
- BGP Hazcon: >50% of sessions down
- Port Hazcon: >30% of ports or interfaces down
- Traffic Hazcon: >40% traffic change detected
Sample Network Use Cases
- Ensuring SLA guarantees
- Proactive network operations to fix issues before they become a problem
- Detect SecOps-related issues such as network traffic growth beyond normal expectations
Rate-of-Change Analytics
- Measure how frequently the state of a network entity, represented by a relevant metric such as an interface or port or optical transceiver changes over a set time interval
- Provide insights into potentially analamous behavior based on the frequency of changes observed during that time period
Sample Network Operations Use Cases
- Ensuring SLAs: a sharp increase in the rate of change of OSPF neighbor states might likely occur with network SLA performance guarantee degradation
- Health: a sharp rise in the number of interface flaps might indicate a health issue
- Instability Detection: a sharp rise in BGP session flaps might indicate growing instability and routing issues, leading to performance degradation or eventual outage
Log Analytics
Selector’s log miner collects and analyzes log data in real-time with no manual effort. Unlike other tools where commercial search features and regex patterns are utilized, Selector’s log miner leverages ML techniques to cluster logs together, eliminating the need for regexes. You can also extract entities from the logs to enrich and add context using NER (Named Entity Recognition). These features help translate raw logs into events, which can be further used in correlations.
The ML process acting on the raw logs includes the usual AI steps of training (through normalization and clustering and NER) and operational inference, which helps to render raw and cryptic signals into more natural and helpful information in the mined logs.
Event Correlation and Root Cause Analysis for Smart Alerting
Selector Software (S2) includes AI-driven root cause analysis (RCA) to correlate operational violations and automate the detect and repair procedure as much as possible.
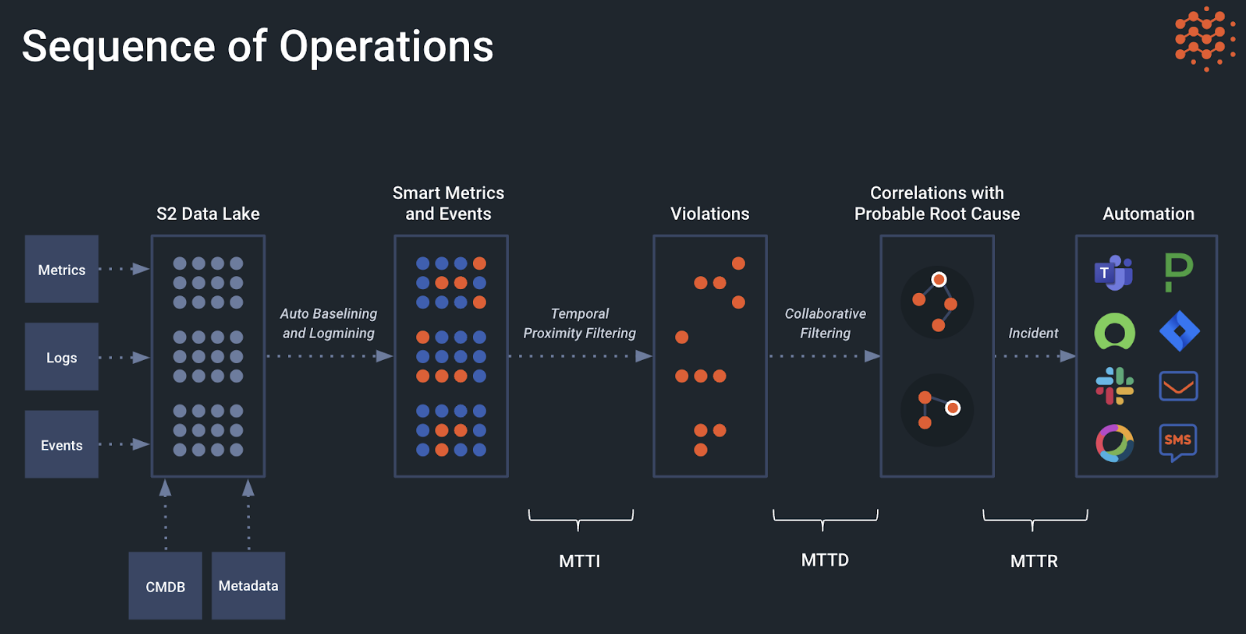
Incident investigating and troubleshooting with legacy tools relies heavily on manual effort to visually identify and confirm anomalies across multiple tools. With Selector’s automated correlation using recommender models, it’s always running in the background to correlate information across time series, logs, and other data ingested in real-time. Information in this deep “data lake” is evaluated and correlated using smart metrics and events to tell a story about the root cause, when it happened, and the reason behind it. This baselining and log mining is then used in smart alerting and ticket creation resulting in improvement to the mean time to identify (MTTI), mean time to detect (MTTD), and mean time to repair (MTTR) sequence. The correlation itself is both temporal and contextual, and hence, the relationship between the events shows a more basic cause and effect. In addition to these, alert deduplication is also performed, helping with alert fatigue.
The relationship between source events and the web they create can be hard to understand without Selector’s AI and ML techniques.
Alert Notifications help users focus on the root cause and filter out distracting events.
Forecasting and Predictive Analytics
Selector’s robust capacity management and modeling capabilities enables customers, through the automated detection of traffic anomalies, support capacity planning and related operations activities. Selector further supports various forecasting and numerical analysis techniques through which to determine how discrete KPIs will behave in the future.
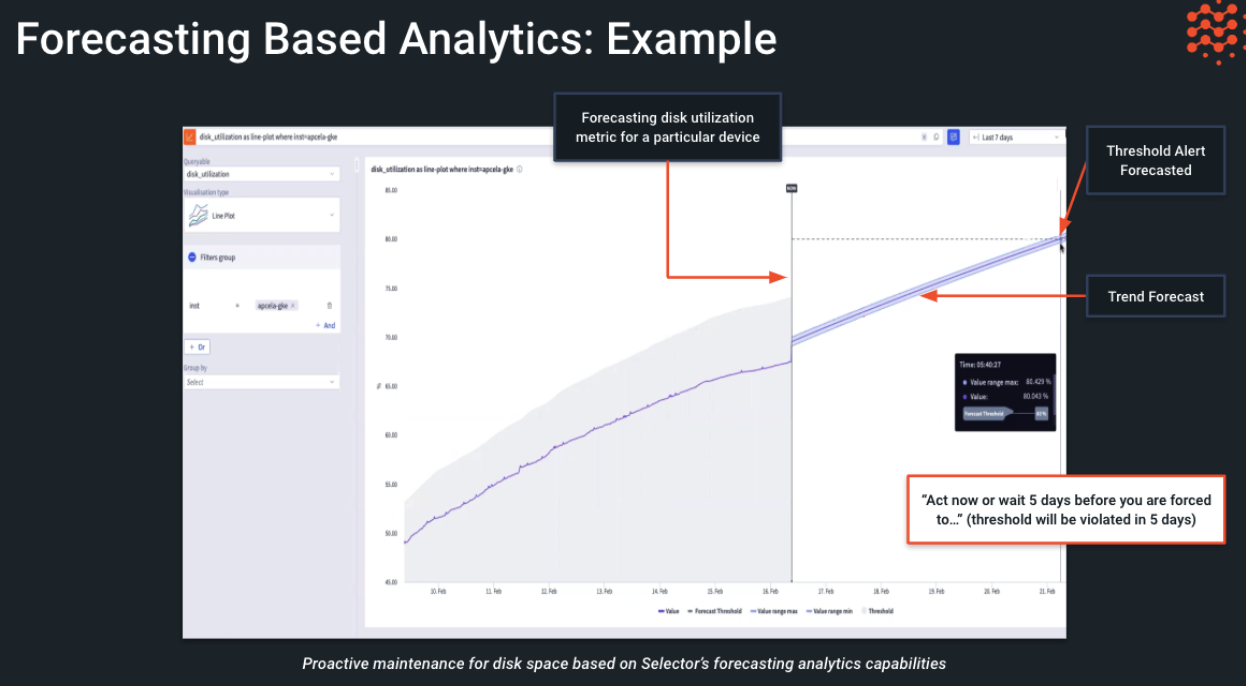
Forecasting-Based Analytics
- Establish trends and forecasts to learn when a metric might hit a predefined threshold
- An ideal choice for capacity or some health metrics such as disk, bandwidth, CPU, memory, temperature, and so on
- Proactively generate alerts based on a forecast made for the relevant metric
- Use robust linear and non-linear trend detection LM techniques
- Use the same dashboard-builder UI as other features
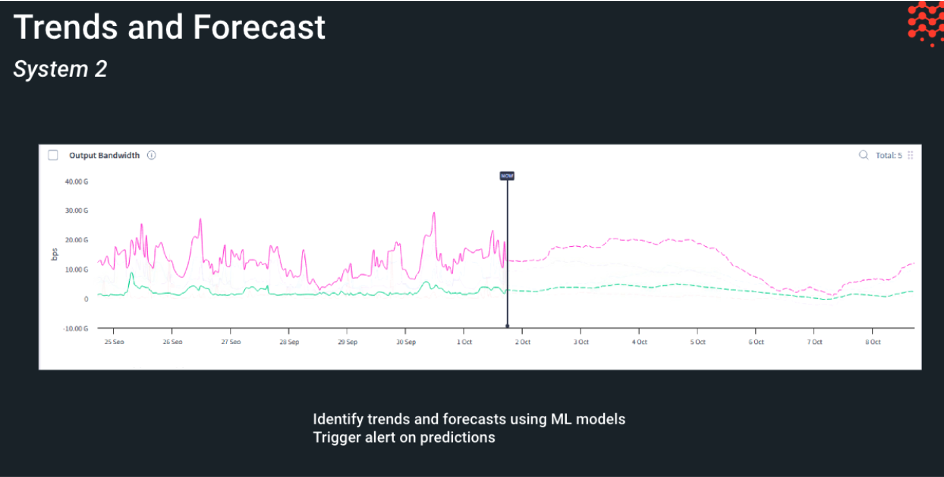
Leveraging previously defined capabilities, the Selector platform also performs predictive analytics in a few ways, such as:
- Time-series forecasting: for metrics where forecasting is needed, the Selector platform provides the capability to zoom out in the widget to predict values for the future. Additionally, there is continuous AI work to create an alert based on a predicted value. These could be applicable for memory utilization, interface utilization, and so on.
Event Trends
- Entities trending high identifies entities that alert frequently based on labels.
Trends are tracked in a variety of ways, summarized and detailed below
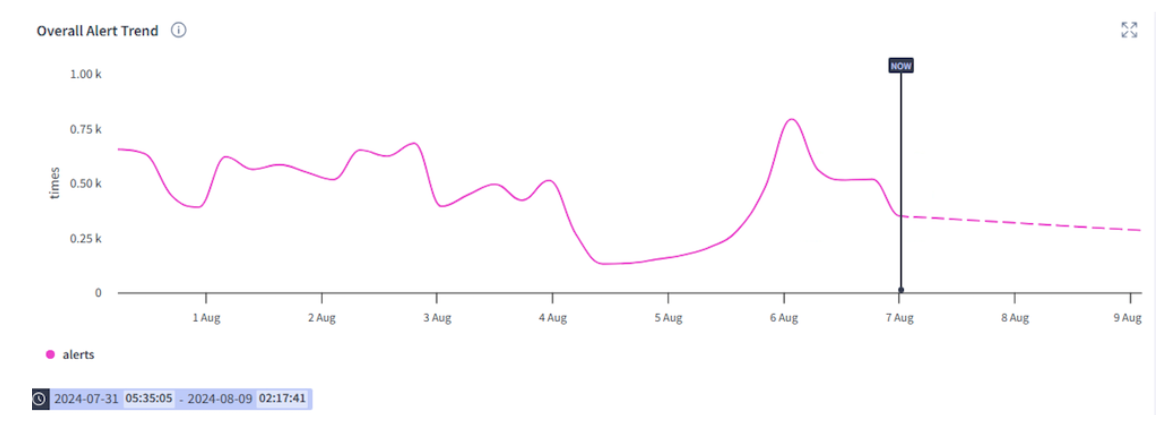
- Overall event trend
- Event specific trends
- Event predictions
- Sequential mining
Overall event trend observes the overall trend of a particular alert
Event-specific trends: Identify trends of top events and forecast the occurrence accordingly
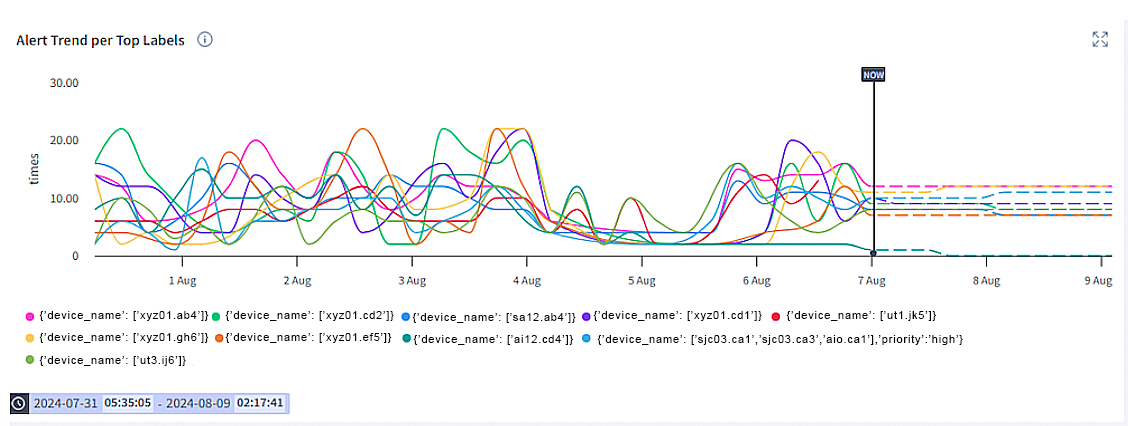
Selector also performs event predictions based on the number of occurrences of a given event with a given set of labels (a shared factor). These metrics can then be used to forecast the occurrence of the same event occurring in the future.
Event Predictions
- This feature predict events across different networks or sites that are disjoint based on historic event occurrences and deriving hidden connections between networks. Events occurring on (device1, site1) could have an impact on (device2, site2)
- Based on events occurring together historically, Selector can derive connections between them and use this as the base for predictions
Sequential Mining
- This feature performs sequential mining on events occurring in a particular sequence. This would be particularly useful to identify patterns where the sequence of occurrences is important
Selector combines all the above to provide topology-aware correlation analysis
Selector provides the capability to visualize devices and their associated topology. This is visualized to two main ways:
Geographical Representation of Devices Based on Health
Selector can show a geographical and topological representation of all devices in a site based on device health.
Represent the Topology of the Network or Segment
Selector can represent the topology of the entire network or a segment. The topology can be derived in multiple ways including LLDP/CDP, IGP state, or even directly through flat files. There also could be requirements around representing a service layer topology for which Selector can leverage tunnel endpoints or service level information to represent the topology accordingly, as the implementation is generic to accommodate and extend to any type of topology (physical, L2, L3). These can be color-coded based on various metrics, such as interface utilization. Capabilities such as hovering over to provide metric values or clicking for a query chain drill-down to a device or a link level are also available.
Copilot and Natural Language Queries
Selector supports an integrated Natural Language Model (NLM) and Copilot to enable users to conversationally query the system. This enables plain language interaction to learn more about evolving incidents and to otherwise interrogate the telemetry being collected by the system. Copilot can be configured to perform a variety of different tasks, with many customers choosing to leverage it for its ability to summarize the various insights being returned by the platform in a clear and concise manner.
Interactions can be done in Slack, Teams, and other Chatops interfaces.
Natural language queries flow down from the user interface through the collaboration service LLM and the S2 query language to knowledge service, which has direct access to recorded events and metrics through a database query language. The database and S2 response is sent through an LLM for summarization, and present to the user as a series of summaries, visualizations, and recommendations.
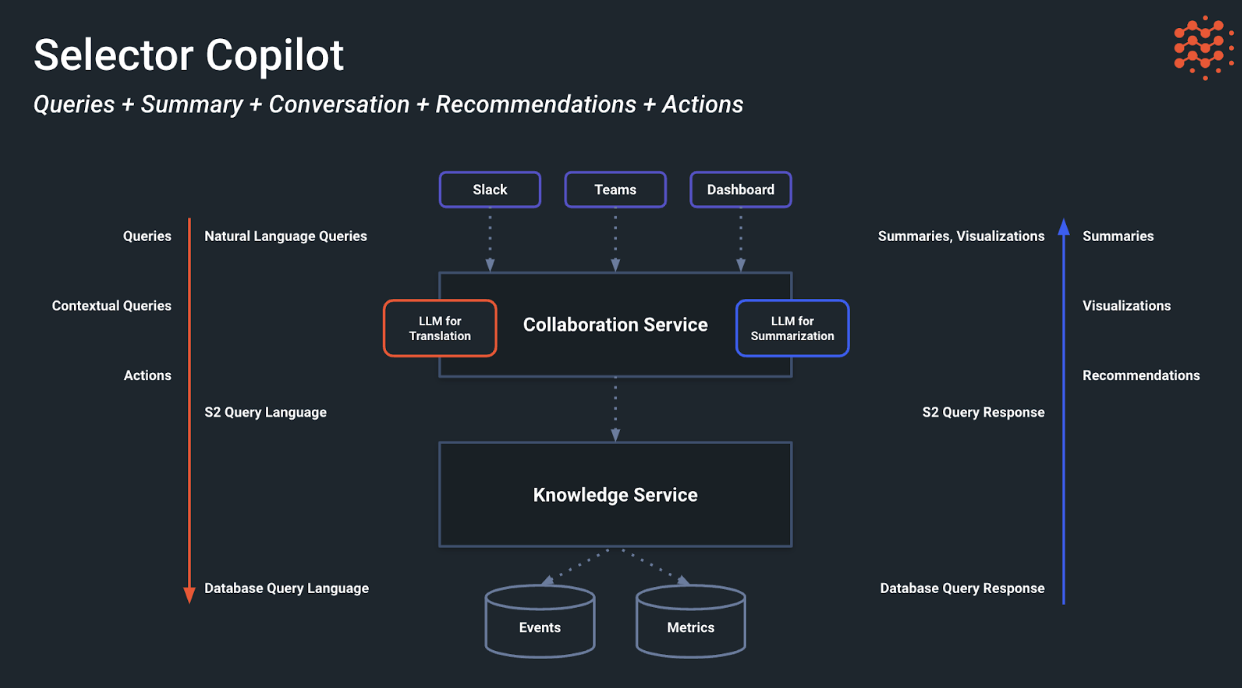
The Selector platform takes natural language input and responds either with widget outputs (if used in the query bar) or provides summarized responses (if the chatbots are used).
Additionally, all interactions can be done using Slack or Microsoft Teams. Additional materials can be provided to see deep-dive material on Selector Copilot and the industry’s first Network Language Model.
The Role of Kubernetes in Auto-scaling
Selector is based on Kubernetes microservices and consists of four functional layers. From bottom to top, as detailed above, these are:
- Ingest data from source (the data collection service)
- Transformation through metadata (the data hypervisor)
- Rules and alerts with ML (the knowledge service)
- Presentation in a user-friendly format (the collaboration service)
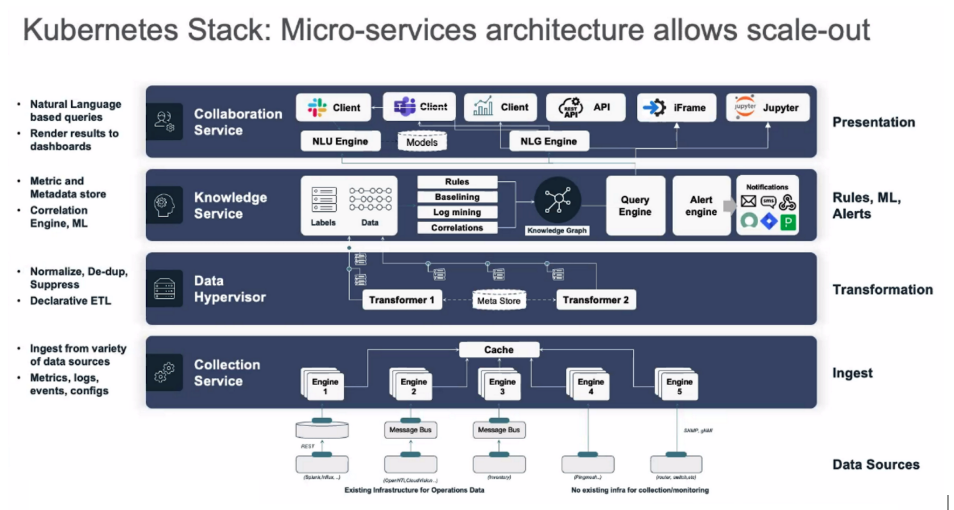
Kubernetes is the factor that allows Selector to auto-scale when events are climbing and scale back when fewer resources are needed.
Key Selector Features
Low Code/No Code
The Selector platform is offered as a service. The service includes Selector data scientists and solutions engineers who create, test, and deploy applications that provide automated workflows for network management and service management that the customer wants.
Selector can train customer teams, if desired, on how to develop and customize the Selector platform.
Notifications
The Selector platform supports a wide variety of notification formats and templates, and each can be customized to customer requirements. Examples include SMS, MS Teams, Cisco Webex, Slack, Email, Service Now, Jira, PagerDuty, and more.
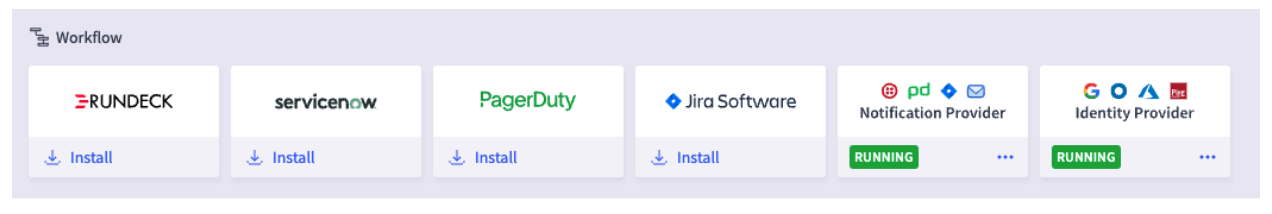
If the customer requires a customized notification endpoint and needed template, the Selector solutions team writes a specification file for it.
Flexible UI/UX
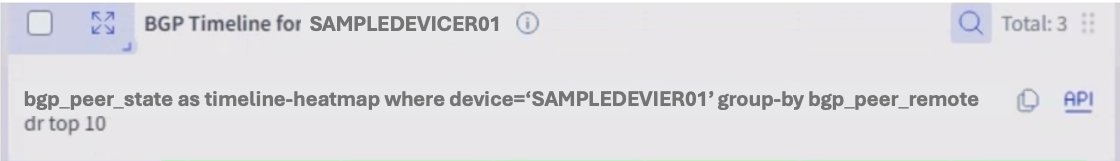
The Selector Structured Query Language (S2QL) is designed to provide users with a powerful and flexible means of retrieving, manipulating, and presenting data.
The Selector UI provides a common framework for presenting various data using S2QL. The presentation of the data can be customized for customer formats. The log-based dashboard, sunburst, and map-based dashboard are standard and do NOT require customization. Other UI views are built to customer requirements or customer teams can be trained to build their own.
Here are some examples of the types of data that Selector’s S2QL can present to users.
Logs can be presented with details or as a graphical sunburst.
A map-based dashboard can show a heatmap of normal operation and anomalies.
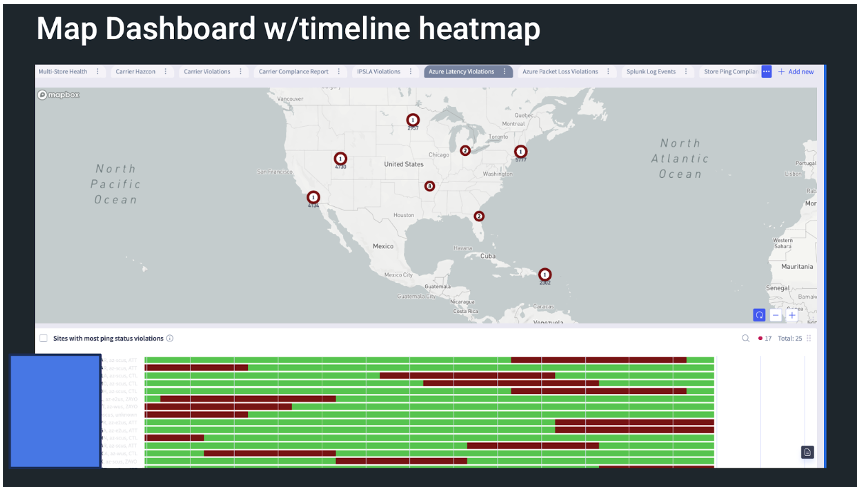
Various widgets can show operational violations in several ways.
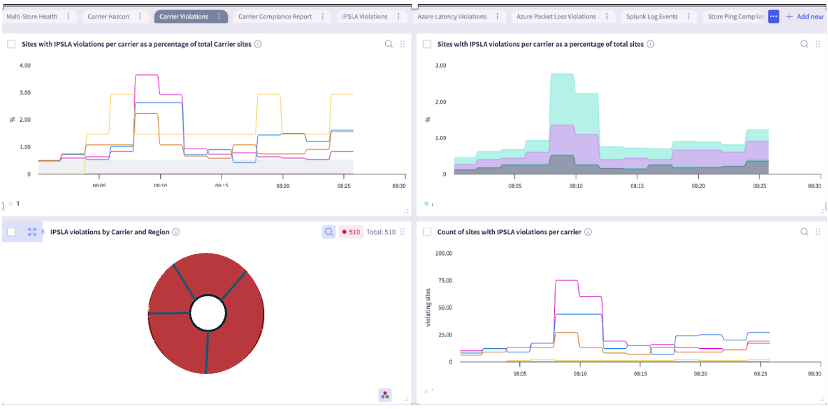
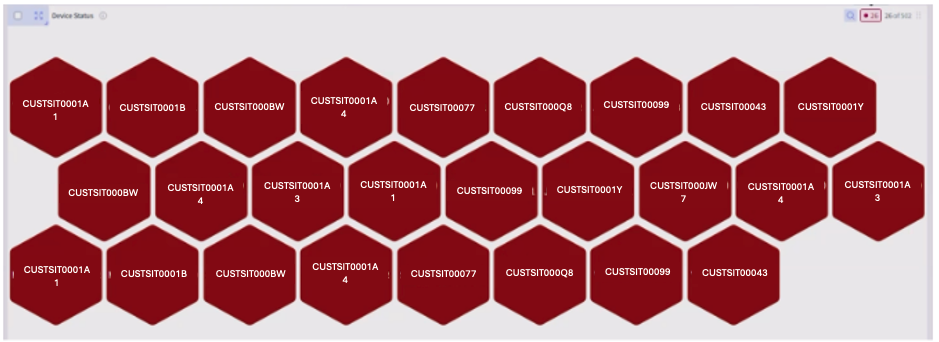
Honeycomb widgets are effective to convey a quick overview of the entire network.
The Selector analytics platform incorporates machine learning and AI in multiple places:
- Auto-baselining of thresholds for metrics
- Clustering of syslogs and named entity recognition
- Event predictions
- Correlations and topology-aware correlations
- LLMs for summarization and Chatops
Multi-Language
English is the supported language in the Selector platform. Selector is open to exploring multi-lingual support as part of a commercial engagement.
Storage for On-Premises Solutions
The total available storage and storage retention are based on individual customer requirements. For on-premises solutions, the customer hosts the VMs and Disks that the Selector platform uses. Selector uses LongHorn to replicate the data stores across the cluster.
For Selector’s on-premises solution, we guide our customers on best practices for backups, system redundancy, and disaster recovery tailored to their specific setup.
Selector has an internal monitoring solution (using Selector) for on-premise and cloud deployments to monitor the resources being used.
4 - System Implementation
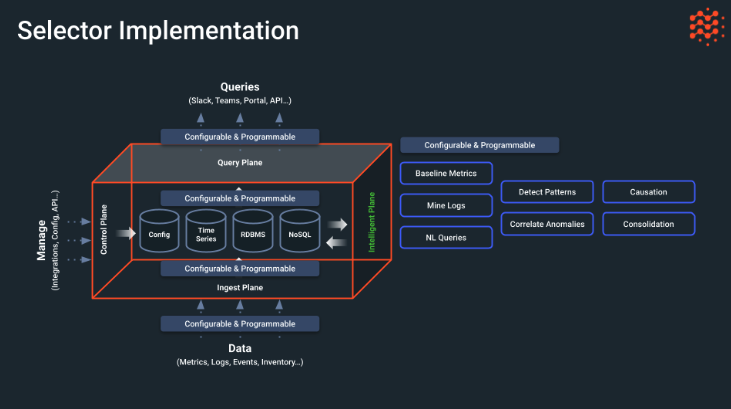
Selector implementation can be visualized as a number of planes representing aspects of software interactions. There are four main planes to the Selector software “cube”:
- Ingest Plane—The data, such as configurations, inventories, logs, or metrics, that flows into Selector is configurable and programmable, both before ingestion and after. The data is kept in a series of data stores for configurations, time series events, a relational database, and in NoSQL format. The other planes all interact with this central information store.
- Control Plane—The Selector software is managed and controlled by a configuration interface. It can also be managed by way of APIs or some other integration technique. The aim here is to be flexible.
- Query Plane—Users can interact with Selector by means of natural language queries instead of arcane commands with cryptic variables. These interactions are also configurable and programmable and can be accessed through portals such as Slack, Teams, and API, or other portal type.
- Intelligent Plane—A special feature of Selector is the inclusion of AI and ML in its operation. Selector uses AI and ML to detect patterns, determine causes, consolidate alerts and alarms to cut down on unhelpful storms, and correlate anomalies when they occur. Here is where the natural language query is interpreted, baseline metrics established, and logs are mined for every hint of useful information.
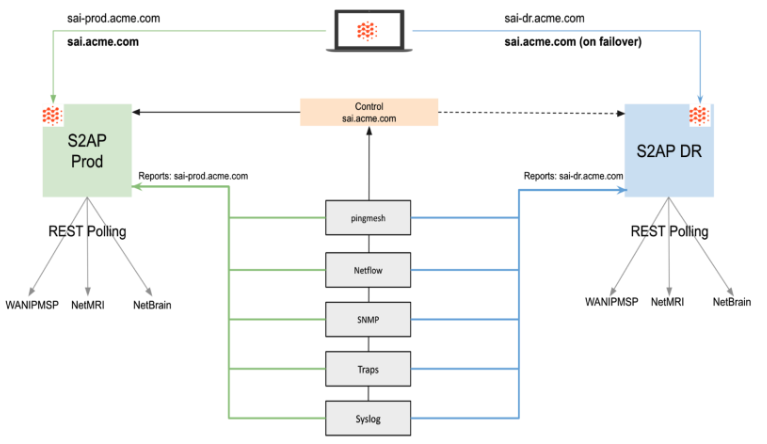
Selector offers a redundant architecture that distributes the Selector application and related data across multiple regions for protection against site-specific failures. Advantages of this model include rapid deployment, minimal application changes, reduced client-to-platform latency, and potential increased read capacity.
The solution is configured as follows:
- Ideally configured in two disparate regions.
- Overlay DNS is used for the active Selector deployment.
- Data Collectors simultaneously publish collected data to each of the two Selector deployments.
- Deployment configuration is also synced between the two associated Selector deployments, ensuring relational data such as user records, dashboards, alerting rules, and so on are present on both deployments.
The architecture has a central control that can connect to either the primary S2AP production environment or the standby S2AP disaster recovery (DR) site. All features are redundant in both areas.
Data Ingestion
Selector integrates with and is otherwise able to ingest telemetry (metrics, logs, events/alerts) from Splunk, cloudwatch, Azure Monitor and Thousand Eyes. Additionally, Selector can both receive alerts from Grafana AlertManagers, while also enabling Grafana to visualize telemetry from the Selector platform.
Selector supports over 300 integrations today and is adding new integrations on a nearly daily basis. Selector supports a native ability to work with Otel metrics and logs. Prometheus data can easily be submitted to the platform via remote-write, or alternatively we can scrape the Prometheus endpoints directly.
Robust anomaly detection and event correlation are applicable to these data sources and many more. Selector customers can either submit standard syslogs directly to the platform’s syslog endpoint. Alternatively, Selector can reach out to intermediate logging platforms such as Splunk and ElasticSearch and pull the logs via their API.
Selector can integrate with and pull topology from ITSM/CMDB tools such as ServiceNow, Netbox, Nautobot, BMC Remedy, and others. Webhooks can be both received and sent by the platform for exactly this purpose. The Selector platform can integrate directly with a broad variety of platforms such as Pagerduty, Opsgenie, Ansible, Puppet, Itential, Gluware and others to enable response workflows and automated remediation.
With Selector, metadata is identified and extracted from a variety of data sources. This metadata is then used to enrich telemetry and ultimately produces higher-fidelity correlations.
This feature is used by nearly all of Selector’s customers, and is one of our most significant differentiators.
Selector Log Miner can process syslog messages. Through a combination of normalization, clustering and name entity recognition (NER) Selector can automatically identify log patterns and robustly extract metadata (e.g., interface name, IP address, etc.)
Selector supports ML-driven baselining of time series to enable the Platform to understand what is normal for time of day (cyclicity) and what is normal for time of year (seasonality). Using the baseline, Selector can robustly identify anomalies within time-series data.
Accessing Data Using APIs
The Selector platform can ingest any data in any format, but users can also access the platform using APIs to better integrate with other tools. Every widget that Selector creates has an API end point created by wrapping the query inside.
The Selector APIs are aligned with the TM Forum industry standard Open APIs/interfaces and support encryption.
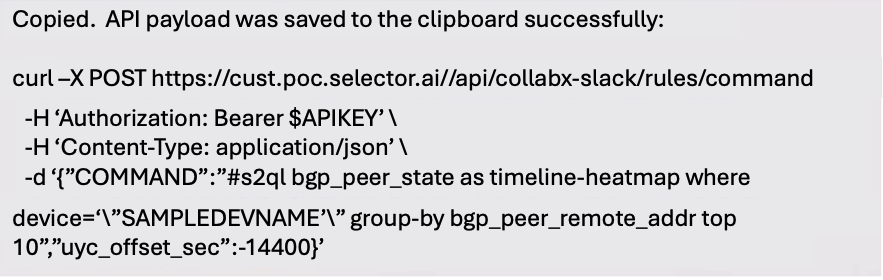
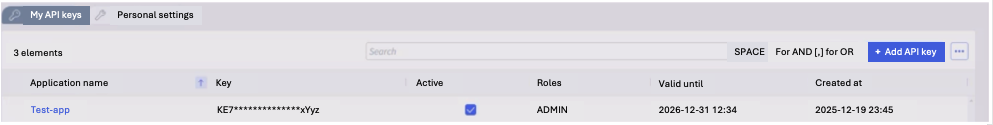
The API key can be downloaded and used as part of the API to retrieve data.
5 - System Operations
Selector Solution Operation
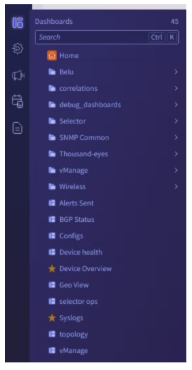
The Selector platform offers many ways to view and control system operations. The major methods are described in this section.
Device Monitoring
Multiple widgets are built to monitor a specific device. Selector dashboards are customizable and provide an easy way to navigate through the platform using multiple ways. Every data source has its own dashboard to view raw data and to derive additional metrics from it. There are also drill-downs associated with each. Note that these drilldowns and dashboards are highly customizable and if the customer desires a different representation, this is easy to do.
Static dashboards are yesterday’s way of finding data. Our dashboards can be dynamically rendered as a result of the questions asked in Slack, for example, and all the operations teams can have joint access to the information to troubleshoot and address a network or IT incident.
Operations teams need the relevant information to be rendered in order to analyze a problem, for the specific context, and in the place that it is necessary. The days of having to learn complex structured query languages to find the information you need, across multiple tools, are gone. Operations engineers need to be able to articulate questions using natural human language and get the responses they need.
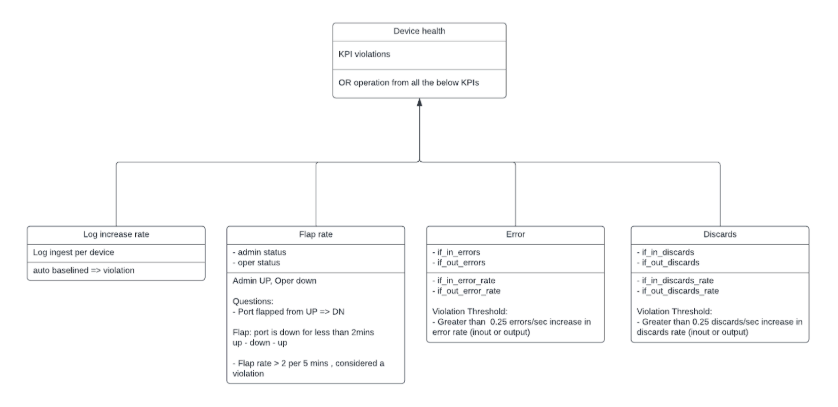
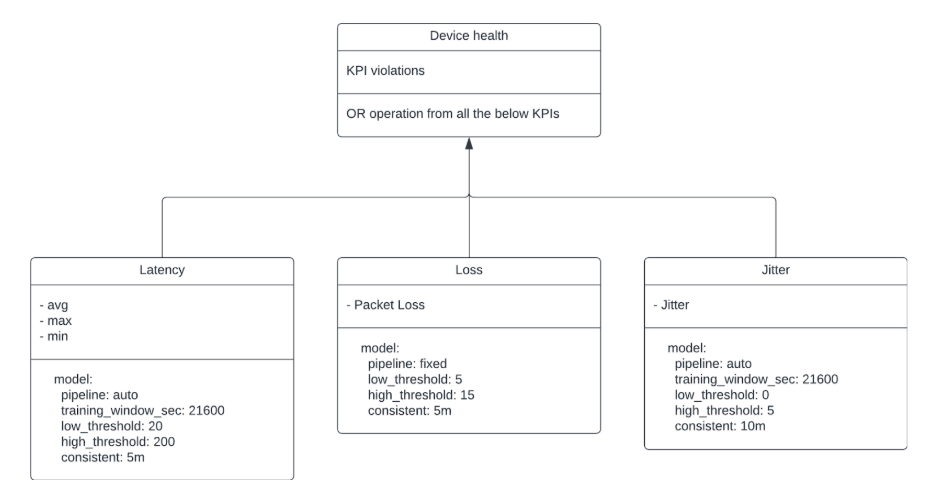
For a specific device, KPIs are derived currently from thousand eyes, vmanage, SNMP and respective device logs. Device health is determined by considering KPIs from all previous sources. Any violation color codes the device health so that the user can easily identify unhealthy devices. Necessary drilldowns are created from each data source to enable the user to view the exact raw detail and the derived metric or KPI.
You can easily view only violated devices when the honeycomb contains many devices.
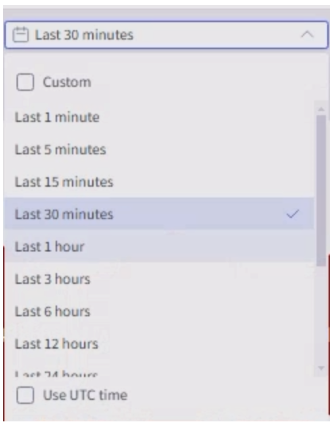
In addition, Selector reviews the timeline for a specific window to see how the health of devices has changed.
You can view specific device metrics by drilling down into a device, revealing more and more details.
You can also easily search for a given device from the dashboard honeycomb. The search bar is implemented as a screen scrape making it easy to search for multiple patterns.
Selector provides self-monitoring as part of the Selector product suite. This software collects system performance data related to the Selector deployment, collects metric, log and event data, and otherwise supports alerting and notification for the Selector support team, as well as customer staff.
Drilldowns also contain a dashboard called Original Analytics to help the user understand where the drill down came from. You can also navigate to other drilldowns easily with a simple click.
Identification of Anomalies
Anomalies surface when outliers are detected based on the variously derived metrics. Derived metrics are created for generating KPIs and can be helpful in aggregating information. Labels are also added as part of this activity.
The methodology Selector uses to identify anomalies is customizable. The same customization applies to training windows for baselining and static thresholds. If there are additional parameters that need to be added, they are easy to add.
Device health is determined by several methods:
- SNMP
- Thousand eyes model
- Vmanage
- Syslogs
Each is detailed below.
SNMP
Thousand Eyes Model
Not all routers have thousand-eyes agents. When drilling down to a device, the Selector platform might not notice thousand-eyes KPIs.
Vmanage
Only Vmanage inventory and events are considered. The Selector platform catches events associated with Vmanage and uses these events for correlations.
Syslogs
As described previously, Syslogs are mined to capture events and entities. These are used for further correlations. Additional insights are generated based on the number of logs and the number of events occurring for a specific device.
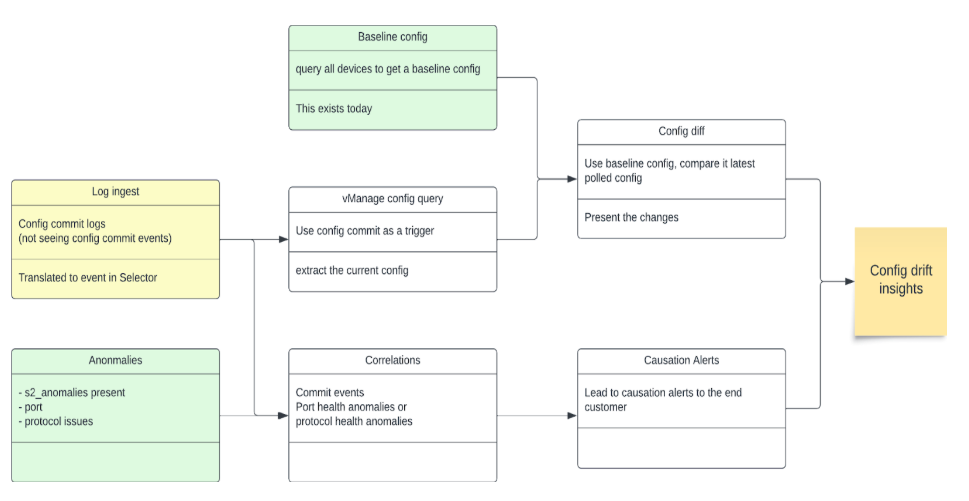
Configuration Drifts
The Selector platform also determines configuration drifts and use that data for correlations to identify specific configuration changes that lead to an event or degradation in performance.
Correlations
Using all data sources, device monitoring, and anomaly identification methods, the Selector platform performs both temporal and contextual correlation. Two models are used in most cases to achieve this post-temporal filtering:
- Recommender models identify the correlation of various events
- Association models identify causal relationships
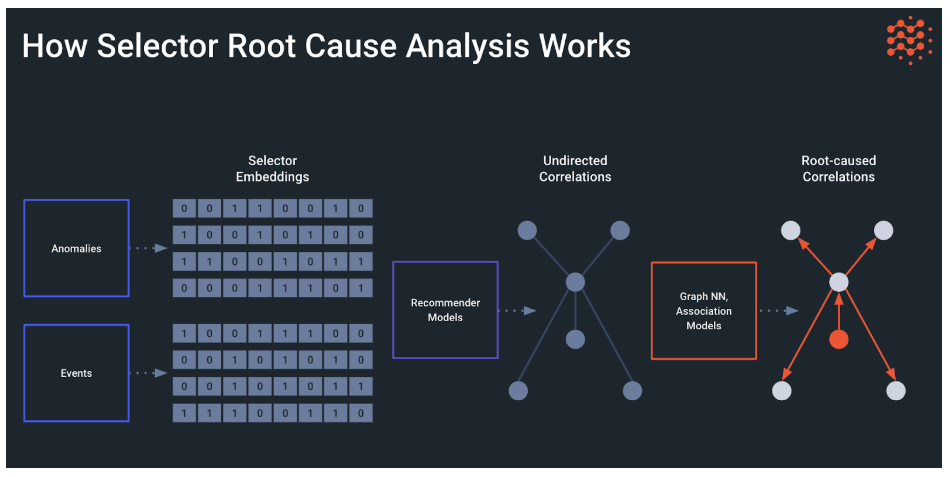
The two models used together helps to provide root cause analysis (RCA) and help in identifying the issue faster reducing MTTI, MTTD and MTTR.
The same concept applies for both WAN and wireless analytics.
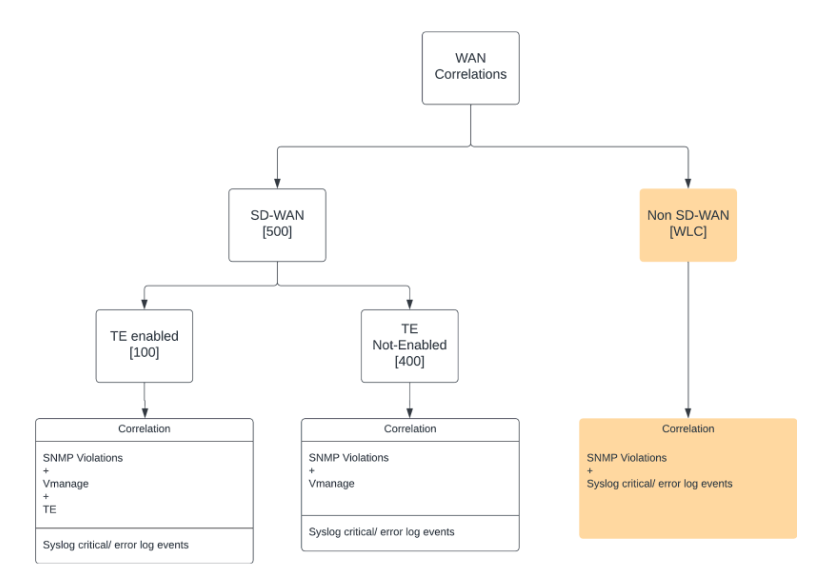
The Selector correlations dashboard has three tabs (wan, wlc, meraki). They are split for user readability because the undirected graph tends to get busy. There are various ways to filter the graphs based on labels and events
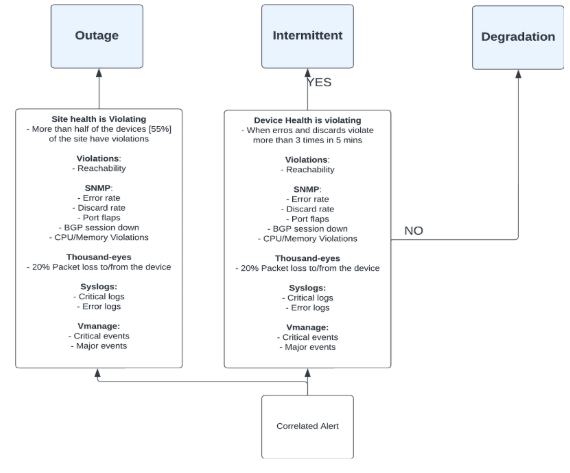
For example, the determination of a device whose health violates some condition is made by considering both thousand-eyes data and SNMP data. The same correlation summary is translated into an event.
Correlations are done on a per device basis. Selector can work with the customer to modify the correlations to include more consolidations, including connected sites and devices connected over SDWAN.
Instant Correlations
Instant correlations occur when the Selector platform looks not at 10-minute historic windows to perform correlations but looks at the current time to perform instant correlations based on various events. These events can also be filtered. This is most useful during debugging.
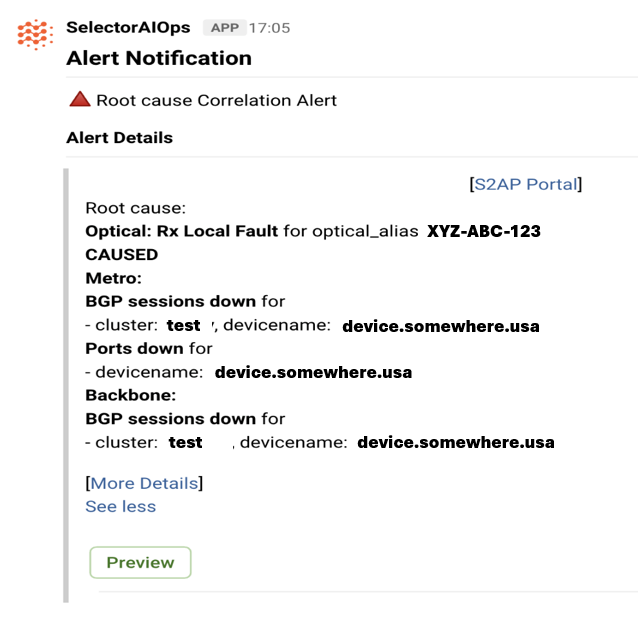
Alert Generation
Alert generation and event-intelligent alert generation are important pieces of the Selector platform. The alerts are not based on individual devices, but on overall associations that have been created. Once the correlated events are identified, alerts can be sent based on various integrations. During the POC, integrations to Email, Moogsoft and Itential can be done. In addition, Slack-related alerts can be demonstrated. If the customer has interest in integrating these alerts into other tools such as Microsoft Teams or others, this can be done easily because these integrations already exist in the Selector platform. The payload is also customizable.
Moogsoft Alert
The Selector platform can also record notifications along with raw and processed payloads that are sent to various tools.
During maintenance windows, the alerts are suppressed and ensure that no alerts are sent out to disrupt maintenance activities.