End-User Features
Overview
The Selector platform is more than just a model of features and a series software packages. The use of AI and ML allows Selector to implement several related and helpful end-user features.
Sample Network Operations Use cases
Event Correlation and Root Cause Analysis for Smart Alerting
Forecasting and Predietive Analysis
Copilot and Natural Language Queries
The Role of Kubernetes in Auto-Scaling
Selector has a number of attractive features. These features are listed here and detailed below:
-Storage for On-Premises Solution
Time-Series Anomaly Detection
Selector performs time-series analysis using proprietary AI and ML strategies to identify deviations from the expected values; that is, anomalies. A combination of dynamic and static thresholds provides the flexibility to handle various use cases. The resulting events are enriched with context, such as location, interface name, model, and so on, which further help with contextual correlation.
Selector offers powerful anomaly detection, outlier detection, and correlation capabilities that support the rapid detection of emerging incidents and points staff towards the probable root cause of those incidents. Composite alerting enables customers to leverage a combination of alerting conditions to further filter and tune the types of alerts and notifications sent to staff.
Auto-Baselining for Time-Series Anomaly Detection
- Selector’s “Auto-Baseliner” ML service computes and adjusts periodically a baseline and corresponding threshold for all time-series-based metrics
- This dynamic threshold helps determine the overall “health” of the metric and allows for intelligent detection of anomalies
- Any incoming data for the metric is measured against this dynamic threshold and manifest in color to represent health (red or green) in relevant visualizations
- Auto-baselines with dynamic thresholds coupled with the Alerting and Notification feature unleashes the power of AI in Selector to detect, alert, and notify users on anomalies in time series metrics
Outlier Detection
- An outlier is a data point that lies far beyond the other values in a sample from a general population
- An outlier is also an observation that lies an abnormal distance from other values in a random sample from a population
- Outliers allow for proactive detection of potential problems or anomalies in the network
- The feature is implemented using Z-score-based ML
Sample Network Outlier Use Cases
- Alert to investigate potentially anomalous conditions developing for performance or health or capacity of key network devices (such as optical transceivers) and data transfer
- Identify SecOps concerns brought on by significant point-in-time deviation of key networking metrics
Hazardous Conditions (Hazcons)
- Hazcons are “bigger picture” conditions represented as a key network metric threshold violation which signal an imminent threat to the system or regional network operation
- Hazcons typically warrant immediate attention to prevent potential disruption or downtime or an SLA violation
- Alert Rules and Notifications must be defined
- Relevant dashboards showing the key metrics related to the Hazcon allow drilldown for Root Cause Analytics
Examples
- BGP Hazcon: >50% of sessions down
- Port Hazcon: >30% of ports or interfaces down
- Traffic Hazcon: >40% traffic change detected
Sample Network Use Cases
- Ensuring SLA guarantees
- Proactive network operations to fix issues before they become a problem
- Detect SecOps-related issues such as network traffic growth beyond normal expectations
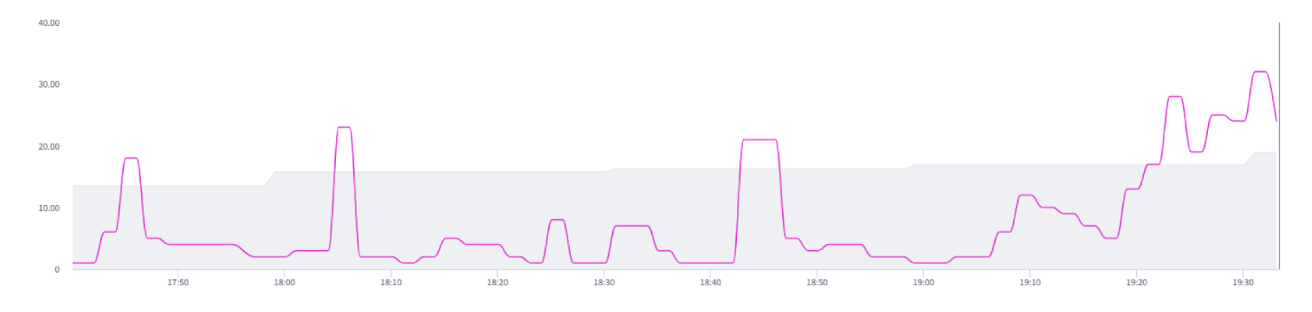
Rate-of-Change Analytics
- Measure how frequently the state of a network entity, represented by a relevant metric such as an interface or port or optical transceiver changes over a set time interval
- Provide insights into potentially analamous behavior based on the frequency of changes observed during that time period
Sample Network Operations Use Cases
- Ensuring SLAs: a sharp increase in the rate of change of OSPF neighbor states might likely occur with network SLA performance guarantee degradation
- Health: a sharp rise in the number of interface flaps might indicate a health issue
- Instability Detection: a sharp rise in BGP session flaps might indicate growing instability and routing issues, leading to performance degradation or eventual outage
Log Analytics
Selector’s log miner collects and analyzes log data in real-time with no manual effort. Unlike other tools where commercial search features and regex patterns are utilized, Selector’s log miner leverages ML techniques to cluster logs together, eliminating the need for regexes. You can also extract entities from the logs to enrich and add context using NER (Named Entity Recognition). These features help translate raw logs into events, which can be further used in correlations.
The ML process acting on the raw logs includes the usual AI steps of training (through normalization and clustering and NER) and operational inference, which helps to render raw and cryptic signals into more natural and helpful information in the mined logs.
Event Correlation and Root Cause Analysis for Smart Alerting
Selector Software (S2) includes AI-driven root cause analysis (RCA) to correlate operational violations and automate the detect and repair procedure as much as possible.
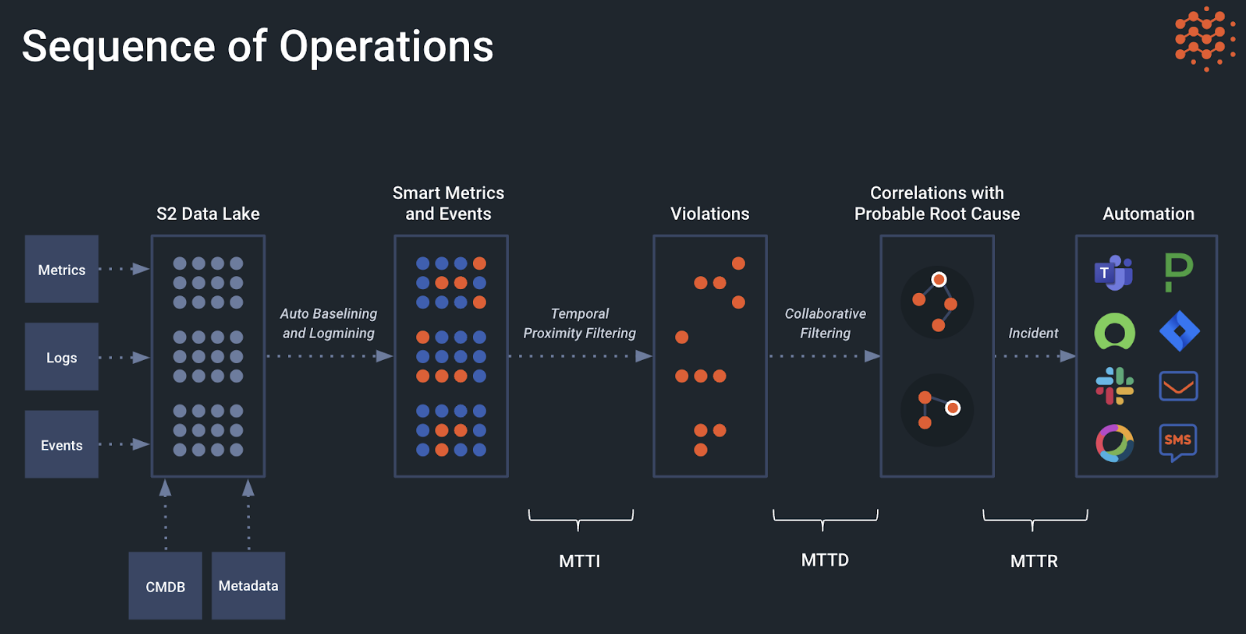
Incident investigating and troubleshooting with legacy tools relies heavily on manual effort to visually identify and confirm anomalies across multiple tools. With Selector’s automated correlation using recommender models, it’s always running in the background to correlate information across time series, logs, and other data ingested in real-time. Information in this deep “data lake” is evaluated and correlated using smart metrics and events to tell a story about the root cause, when it happened, and the reason behind it. This baselining and log mining is then used in smart alerting and ticket creation resulting in improvement to the mean time to identify (MTTI), mean time to detect (MTTD), and mean time to repair (MTTR) sequence. The correlation itself is both temporal and contextual, and hence, the relationship between the events shows a more basic cause and effect. In addition to these, alert deduplication is also performed, helping with alert fatigue.
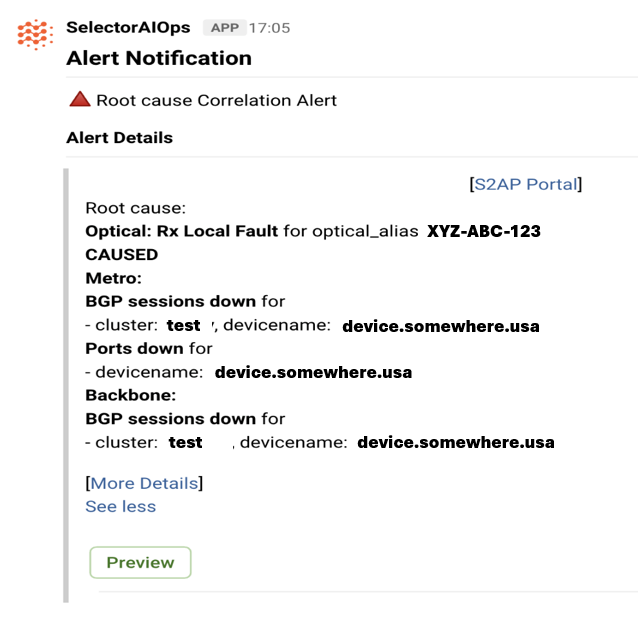
The relationship between source events and the web they create can be hard to understand without Selector’s AI and ML techniques.
Alert Notifications help users focus on the root cause and filter out distracting events.
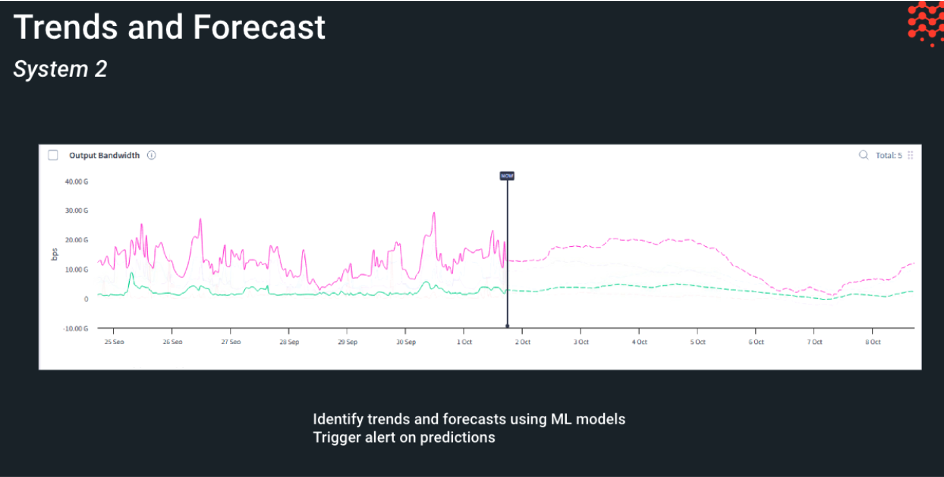
Forecasting and Predictive Analytics
Selector’s robust capacity management and modeling capabilities enables customers, through the automated detection of traffic anomalies, support capacity planning and related operations activities. Selector further supports various forecasting and numerical analysis techniques through which to determine how discrete KPIs will behave in the future.
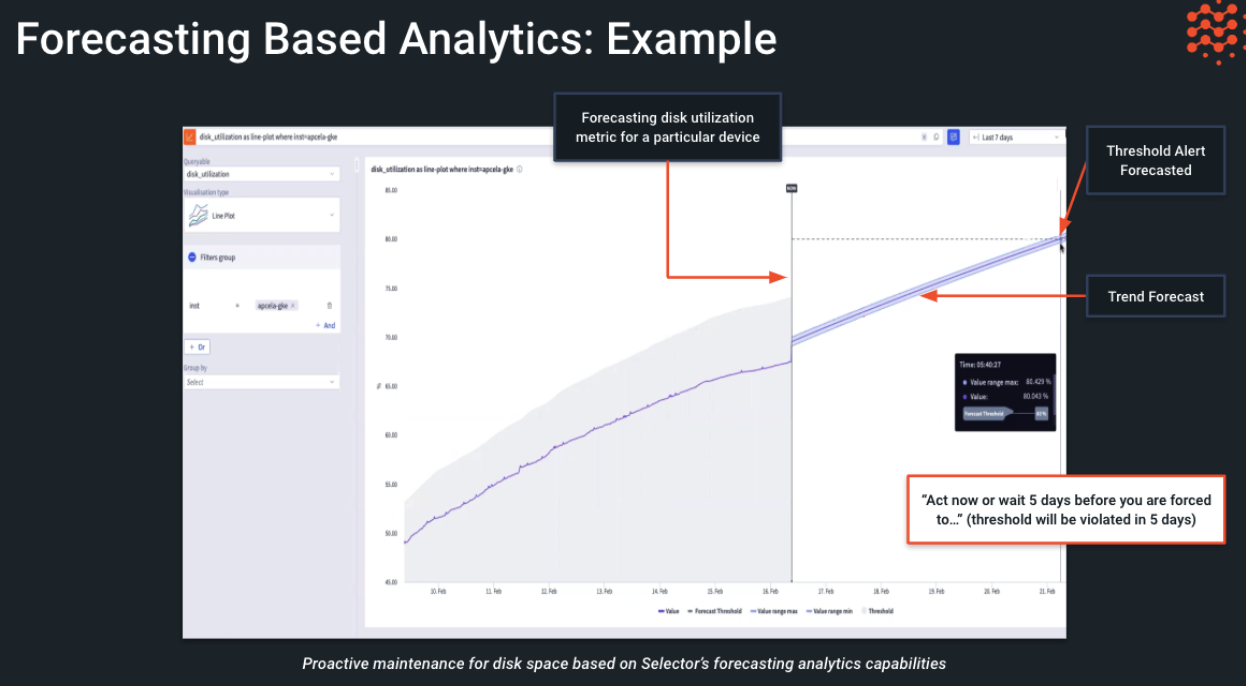
Forecasting-Based Analytics
- Establish trends and forecasts to learn when a metric might hit a predefined threshold
- An ideal choice for capacity or some health metrics such as disk, bandwidth, CPU, memory, temperature, and so on
- Proactively generate alerts based on a forecast made for the relevant metric
- Use robust linear and non-linear trend detection LM techniques
- Use the same dashboard-builder UI as other features
Leveraging previously defined capabilities, the Selector platform also performs predictive analytics in a few ways, such as:
- Time-series forecasting: for metrics where forecasting is needed, the Selector platform provides the capability to zoom out in the widget to predict values for the future. Additionally, there is continuous AI work to create an alert based on a predicted value. These could be applicable for memory utilization, interface utilization, and so on.
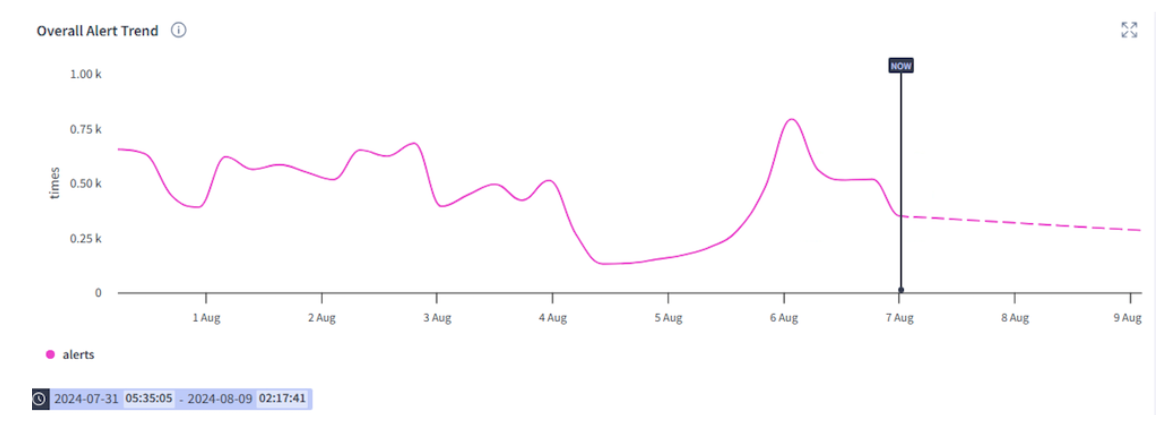
Event Trends
- Entities trending high identifies entities that alert frequently based on labels.
Trends are tracked in a variety of ways, summarized and detailed below
- Overall event trend
- Event specific trends
- Event predictions
- Sequential mining
Overall event trend observes the overall trend of a particular alert
Event-specific trends: Identify trends of top events and forecast the occurrence accordingly
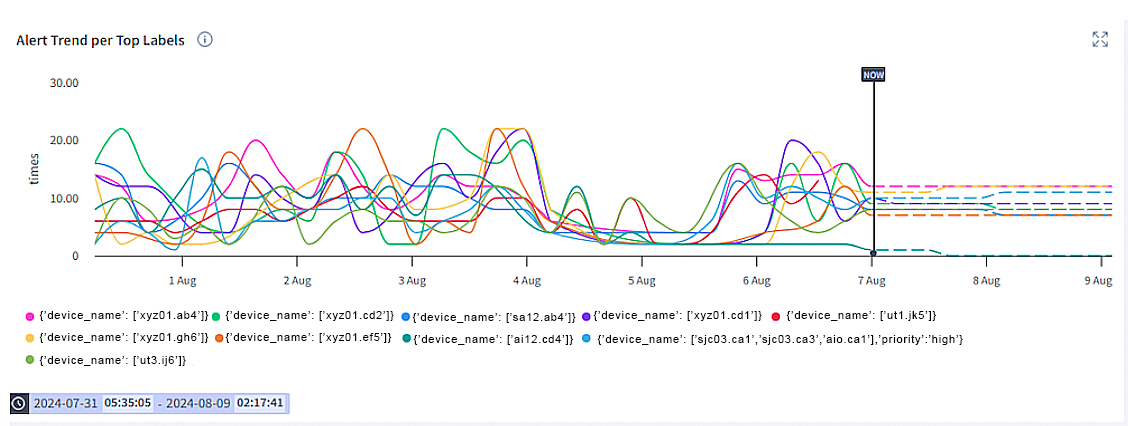
Selector also performs event predictions based on the number of occurrences of a given event with a given set of labels (a shared factor). These metrics can then be used to forecast the occurrence of the same event occurring in the future.
Event Predictions
- This feature predict events across different networks or sites that are disjoint based on historic event occurrences and deriving hidden connections between networks. Events occurring on (device1, site1) could have an impact on (device2, site2)
- Based on events occurring together historically, Selector can derive connections between them and use this as the base for predictions
Sequential Mining
- This feature performs sequential mining on events occurring in a particular sequence. This would be particularly useful to identify patterns where the sequence of occurrences is important
Selector combines all the above to provide topology-aware correlation analysis
Selector provides the capability to visualize devices and their associated topology. This is visualized to two main ways:
Geographical Representation of Devices Based on Health
Selector can show a geographical and topological representation of all devices in a site based on device health.
Represent the Topology of the Network or Segment
Selector can represent the topology of the entire network or a segment. The topology can be derived in multiple ways including LLDP/CDP, IGP state, or even directly through flat files. There also could be requirements around representing a service layer topology for which Selector can leverage tunnel endpoints or service level information to represent the topology accordingly, as the implementation is generic to accommodate and extend to any type of topology (physical, L2, L3). These can be color-coded based on various metrics, such as interface utilization. Capabilities such as hovering over to provide metric values or clicking for a query chain drill-down to a device or a link level are also available.
Copilot and Natural Language Queries
Selector supports an integrated Natural Language Model (NLM) and Copilot to enable users to conversationally query the system. This enables plain language interaction to learn more about evolving incidents and to otherwise interrogate the telemetry being collected by the system. Copilot can be configured to perform a variety of different tasks, with many customers choosing to leverage it for its ability to summarize the various insights being returned by the platform in a clear and concise manner.
Interactions can be done in Slack, Teams, and other Chatops interfaces.
Natural language queries flow down from the user interface through the collaboration service LLM and the S2 query language to knowledge service, which has direct access to recorded events and metrics through a database query language. The database and S2 response is sent through an LLM for summarization, and present to the user as a series of summaries, visualizations, and recommendations.
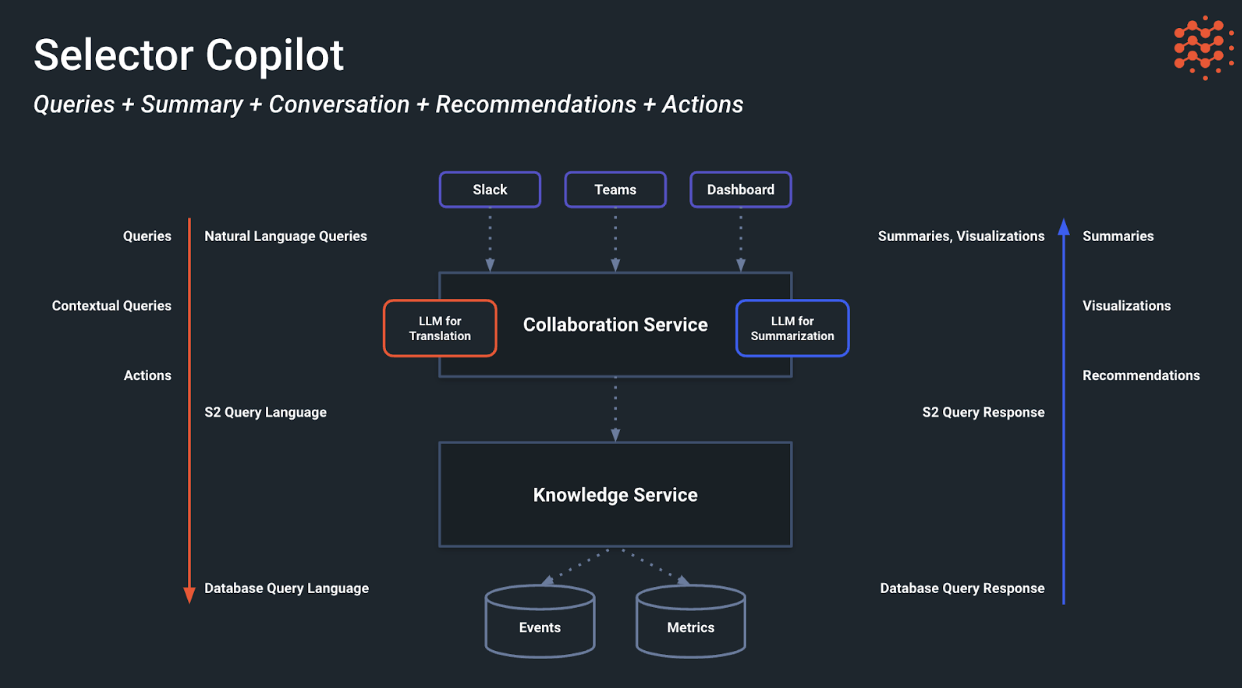
The Selector platform takes natural language input and responds either with widget outputs (if used in the query bar) or provides summarized responses (if the chatbots are used).
Additionally, all interactions can be done using Slack or Microsoft Teams. Additional materials can be provided to see deep-dive material on Selector Copilot and the industry’s first Network Language Model.
The Role of Kubernetes in Auto-scaling
Selector is based on Kubernetes microservices and consists of four functional layers. From bottom to top, as detailed above, these are:
- Ingest data from source (the data collection service)
- Transformation through metadata (the data hypervisor)
- Rules and alerts with ML (the knowledge service)
- Presentation in a user-friendly format (the collaboration service)
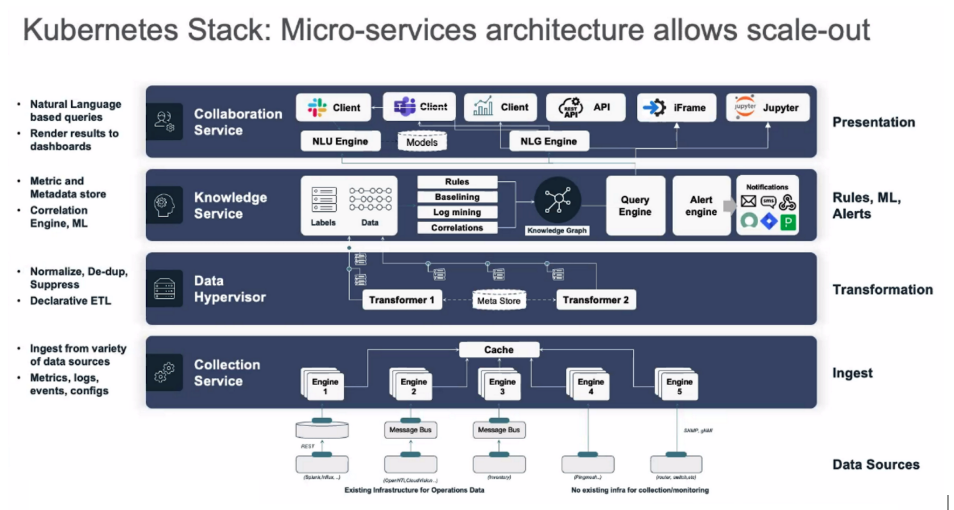
Kubernetes is the factor that allows Selector to auto-scale when events are climbing and scale back when fewer resources are needed.
Key Selector Features
Low Code/No Code
The Selector platform is offered as a service. The service includes Selector data scientists and solutions engineers who create, test, and deploy applications that provide automated workflows for network management and service management that the customer wants.
Selector can train customer teams, if desired, on how to develop and customize the Selector platform.
Notifications
The Selector platform supports a wide variety of notification formats and templates, and each can be customized to customer requirements. Examples include SMS, MS Teams, Cisco Webex, Slack, Email, Service Now, Jira, PagerDuty, and more.
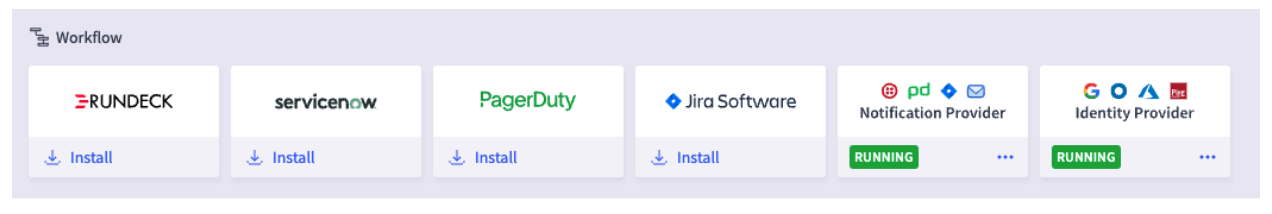
If the customer requires a customized notification endpoint and needed template, the Selector solutions team writes a specification file for it.
Flexible UI/UX
The Selector Structured Query Language (S2QL) is designed to provide users with a powerful and flexible means of retrieving, manipulating, and presenting data.
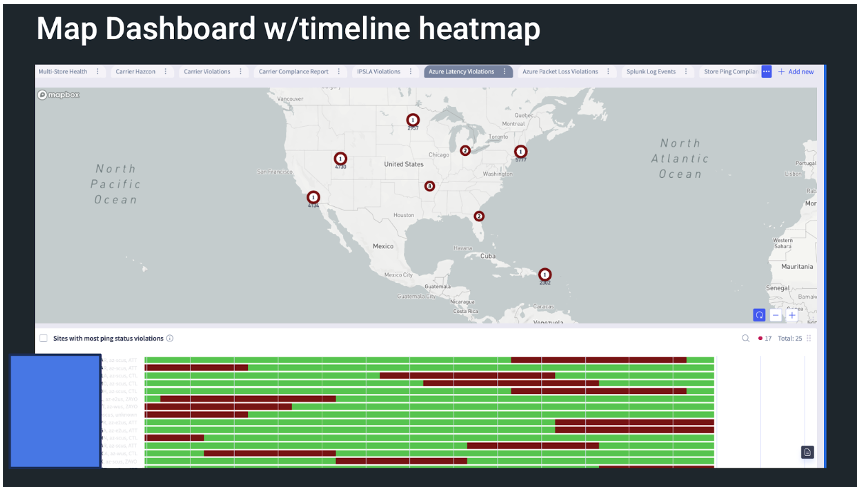
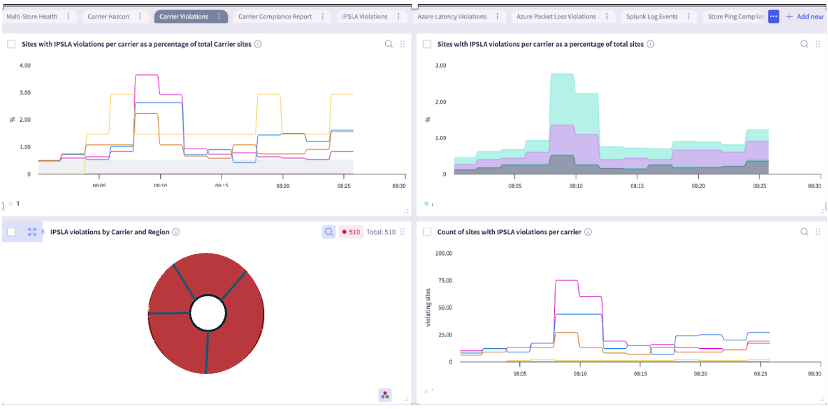
The Selector UI provides a common framework for presenting various data using S2QL. The presentation of the data can be customized for customer formats. The log-based dashboard, sunburst, and map-based dashboard are standard and do NOT require customization. Other UI views are built to customer requirements or customer teams can be trained to build their own.
Here are some examples of the types of data that Selector’s S2QL can present to users.
Logs can be presented with details or as a graphical sunburst.
A map-based dashboard can show a heatmap of normal operation and anomalies.
Various widgets can show operational violations in several ways.
Honeycomb widgets are effective to convey a quick overview of the entire network.
The Selector analytics platform incorporates machine learning and AI in multiple places:
- Auto-baselining of thresholds for metrics
- Clustering of syslogs and named entity recognition
- Event predictions
- Correlations and topology-aware correlations
- LLMs for summarization and Chatops
Multi-Language
English is the supported language in the Selector platform. Selector is open to exploring multi-lingual support as part of a commercial engagement.
Storage for On-Premises Solutions
The total available storage and storage retention are based on individual customer requirements. For on-premises solutions, the customer hosts the VMs and Disks that the Selector platform uses. Selector uses LongHorn to replicate the data stores across the cluster.
For Selector’s on-premises solution, we guide our customers on best practices for backups, system redundancy, and disaster recovery tailored to their specific setup.
Selector has an internal monitoring solution (using Selector) for on-premise and cloud deployments to monitor the resources being used.