System Architecture
Overview
The Selector platform is constructed around four functional layers:
Data Collection Engine - Entry point for data in the system.
Data Hypervisor - The data plane where data gets normalized and enriched for further processing by upper layers.
Knowledge Service - Data is processed and ML analytics are performed.
Collaboration Service - Exposes the various interfaces for the user to interact with Selector Analytics.
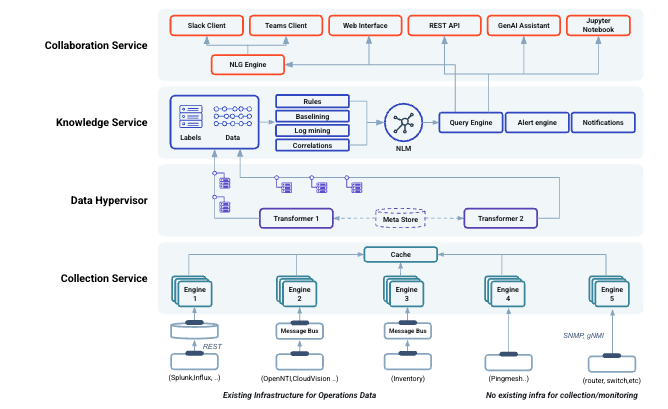
Data Collection Engine
Selector Analytics has access to a wide variety of data sources through a set of custom-built collection engines that leverage both push and pull technology.
We collect data from existing monitoring systems such as Solarwinds, Datadog, or Zabbix, as well as log collection systems like Splunk. For these cases, we have pre-integrated engines for each of these systems, making them plug and play. Selector Analytics can also collect data directly from monitored entities (e.g., network devices using SNMP collection, gNMI, syslog, Netconf/CLI, etc.).
All the collection engines are cloud-native and are designed to be able to scale out. The data collection layer is the entry point of the data for the system, and it plays a key role in bringing the wide variety of data that may be necessary for our mission: answering complex questions.
There is another collection capability that is fundamental for the proper infrastructure observability and correlation: inventory. Selector Analytics can connect to an existing inventory or CMDB tool, consume static inventory definitions from a file or dynamic definitions via an API, integrate with an existing Netbox instance or provide inventory as a service using our own Netbox instance. Any of these mechanisms allow us to populate the Selector Analytics Metastore with data that will be used for real-time telemetry and event enrichment. For synthetic testing, lightweight software agents are available to be deployed in servers, VMs, network devices, etc.
Data Hypervisor
Data is ingested from different types of sources, and each one has its own characteristics, schema, encapsulation mechanisms, etc.
Depending on the nature of the data, the type of storage and processing it will require will also be different, which leads to the need to have different mechanisms for that purpose. Standalone data sources lack context, which is necessary for proper analysis, so it must be enriched with the necessary metadata (usually in the form of labels) to make it useful. That context also allows data coming from different sources to become connected so that they can be cross-correlated (metrics, events, logs, configuration, operational state, flow data, etc.)
The hypervisor is in charge of decoupling the physical infrastructure from the applications and provides an abstract view through the concept of VMs, or containers. Our data hypervisor provides the equivalent functionality for data processing: decoupling the various and different types of data sources, normalizing the data and providing a source agnostic mechanism to extract, enrich, process and redirect the data to the right storage repositories, adequate to each type of data.
We use ML in the Data Hypervisor to automatically extract information from logs, events, and traps despite having unstructured or semi-structured content.
Traditional architectures need hundreds or thousands of regex rules to be created and maintained for that purpose. We use ML techniques to automatically infer and extract the relevant entities and cluster various events into meaningful types. The Data Hypervisor again plays a key role in the delivery of our mission, enabling the processing of any type of data and enriching the data with the contextual information necessary to answering complex questions.
Knowledge Service
The knowledge service uses data and algorithms to answer IT / operational questions. Our ML engine will automatically detect anomalies on any metric and/or apply heuristics-based rules when configured to do so. Alerts will be raised upon anomalies detected, which will be cross-correlated by our ML engine in the Knowledge Service and ranked with other alerts or events on the system. This process provides a cohesive view of the data received from different sources.
The Knowledge Service is the brain of the platform.
It not only provides the insights required to detect and correlate potential problems within the infrastructure, but also provides the interface to query any data on the system, regardless of the type (metric, events, logs, alerts, etc.). It plays a fundamental role in the Selector mission: provide the right answer to the questions, provide visibility of the problems, whether known or unknown.
At Selector Analytics, our goal is to answer questions, but do it in a way that is operationally affordable. The days of programming hundreds or thousands of rules on a system to analyze logs, set thresholds, raise alarms and correlate events are gone. Networks and IT infrastructure have grown in size and complexity to a level where it is humanly impossible to deal with them using rules. Knowledge is necessary to answer questions, and machine learning techniques are used to extract that knowledge from the data, transform it, analyze it, correlate it with other analyzed data and make that knowledge available through the natural language interface.
Collaboration Service
If having the right answer to a question is important, it is also important to make it easy for users to ask their questions, and get the required answers in the right time, and in the right place.
The goal of the collaboration layer is to provide a human-centered set of interfaces to facilitate collaboration. With seamless integration in Slack and Microsoft Teams, network operation engineers can interact with the Selector Analytics from their collaboration tool of choice, without the need to switch to other interfaces.
It is possible to articulate the questions that need answers using natural human language, and get the right answers, in real-time, right there. It is also possible to get notifications and alerts directly in Slack or Microsoft Teams, and troubleshoot them from the same channel by issuing the necessary follow up questions (in natural language) to the Selector Analytics chatbot
Static dashboards are yesterday’s way of finding data. Our dashboards can be dynamically rendered as a result of the questions asked in Slack, for example, and all the operations teams can have joint access to the information to troubleshoot and address a network or IT incident.
Operations teams need the relevant information to be rendered in order to analyze a problem, for the specific context, and in the place that it is necessary. The days of having to learn complex structured query languages to find the information you need, across multiple tools, are gone. Operations engineers need to be able to articulate questions using natural human language and get the responses they need.
The Selector Analytics Platform mission is to find the right answers to the operational questions in the right time, the right place and the right way – and collaboration service plays a key role.