System Implementation
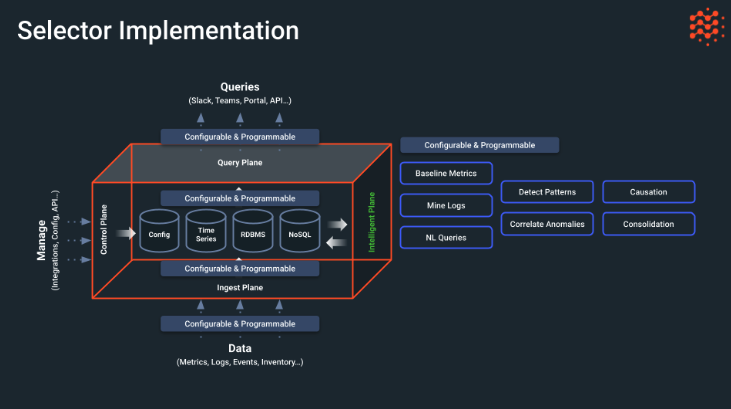
Selector implementation can be visualized as a number of planes representing aspects of software interactions. There are four main planes to the Selector software “cube”:
- Ingest Plane—The data, such as configurations, inventories, logs, or metrics, that flows into Selector is configurable and programmable, both before ingestion and after. The data is kept in a series of data stores for configurations, time series events, a relational database, and in NoSQL format. The other planes all interact with this central information store.
- Control Plane—The Selector software is managed and controlled by a configuration interface. It can also be managed by way of APIs or some other integration technique. The aim here is to be flexible.
- Query Plane—Users can interact with Selector by means of natural language queries instead of arcane commands with cryptic variables. These interactions are also configurable and programmable and can be accessed through portals such as Slack, Teams, and API, or other portal type.
- Intelligent Plane—A special feature of Selector is the inclusion of AI and ML in its operation. Selector uses AI and ML to detect patterns, determine causes, consolidate alerts and alarms to cut down on unhelpful storms, and correlate anomalies when they occur. Here is where the natural language query is interpreted, baseline metrics established, and logs are mined for every hint of useful information.
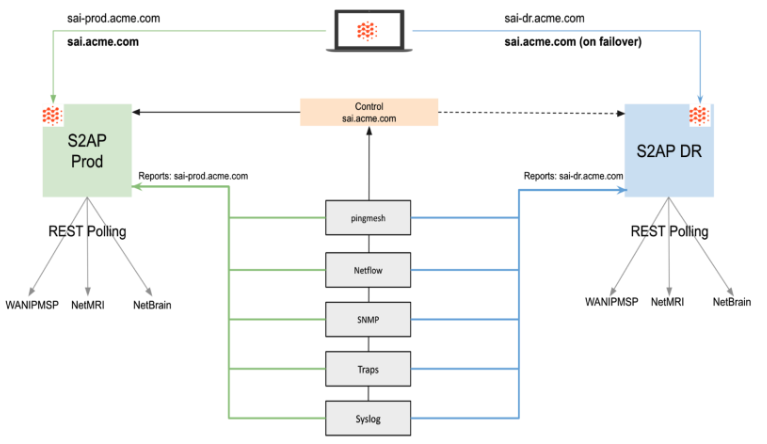
Selector offers a redundant architecture that distributes the Selector application and related data across multiple regions for protection against site-specific failures. Advantages of this model include rapid deployment, minimal application changes, reduced client-to-platform latency, and potential increased read capacity.
The solution is configured as follows:
- Ideally configured in two disparate regions.
- Overlay DNS is used for the active Selector deployment.
- Data Collectors simultaneously publish collected data to each of the two Selector deployments.
- Deployment configuration is also synced between the two associated Selector deployments, ensuring relational data such as user records, dashboards, alerting rules, and so on are present on both deployments.
The architecture has a central control that can connect to either the primary S2AP production environment or the standby S2AP disaster recovery (DR) site. All features are redundant in both areas.
Data Ingestion
Selector integrates with and is otherwise able to ingest telemetry (metrics, logs, events/alerts) from Splunk, cloudwatch, Azure Monitor and Thousand Eyes. Additionally, Selector can both receive alerts from Grafana AlertManagers, while also enabling Grafana to visualize telemetry from the Selector platform.
Selector supports over 300 integrations today and is adding new integrations on a nearly daily basis. Selector supports a native ability to work with Otel metrics and logs. Prometheus data can easily be submitted to the platform via remote-write, or alternatively we can scrape the Prometheus endpoints directly.
Robust anomaly detection and event correlation are applicable to these data sources and many more. Selector customers can either submit standard syslogs directly to the platform’s syslog endpoint. Alternatively, Selector can reach out to intermediate logging platforms such as Splunk and ElasticSearch and pull the logs via their API.
Selector can integrate with and pull topology from ITSM/CMDB tools such as ServiceNow, Netbox, Nautobot, BMC Remedy, and others. Webhooks can be both received and sent by the platform for exactly this purpose. The Selector platform can integrate directly with a broad variety of platforms such as Pagerduty, Opsgenie, Ansible, Puppet, Itential, Gluware and others to enable response workflows and automated remediation.
With Selector, metadata is identified and extracted from a variety of data sources. This metadata is then used to enrich telemetry and ultimately produces higher-fidelity correlations.
This feature is used by nearly all of Selector’s customers, and is one of our most significant differentiators.
Selector Log Miner can process syslog messages. Through a combination of normalization, clustering and name entity recognition (NER) Selector can automatically identify log patterns and robustly extract metadata (e.g., interface name, IP address, etc.)
Selector supports ML-driven baselining of time series to enable the Platform to understand what is normal for time of day (cyclicity) and what is normal for time of year (seasonality). Using the baseline, Selector can robustly identify anomalies within time-series data.
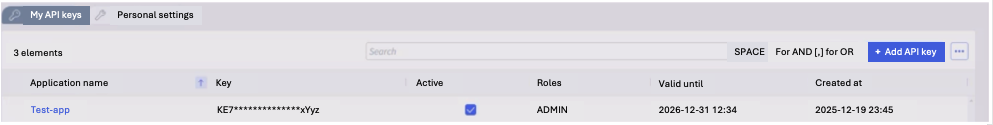
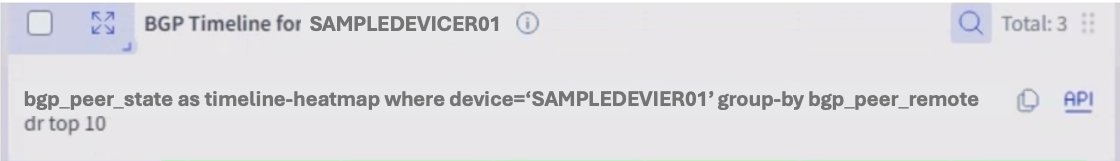
Accessing Data Using APIs
The Selector platform can ingest any data in any format, but users can also access the platform using APIs to better integrate with other tools. Every widget that Selector creates has an API end point created by wrapping the query inside.
The Selector APIs are aligned with the TM Forum industry standard Open APIs/interfaces and support encryption.
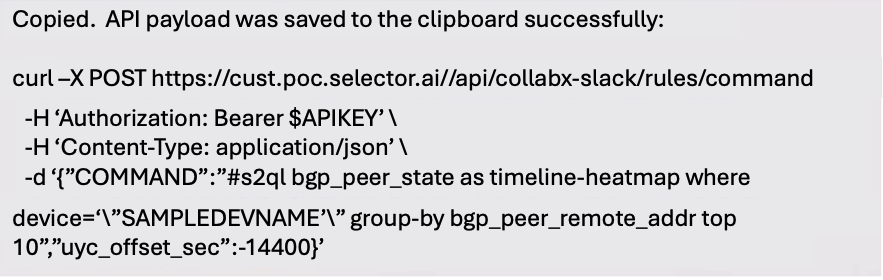
The API key can be downloaded and used as part of the API to retrieve data.