System Operations
Selector Solution Operation
The Selector platform offers many ways to view and control system operations. The major methods are described in this section.
Device Monitoring
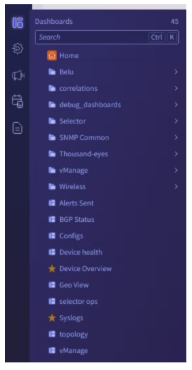
Multiple widgets are built to monitor a specific device. Selector dashboards are customizable and provide an easy way to navigate through the platform using multiple ways. Every data source has its own dashboard to view raw data and to derive additional metrics from it. There are also drill-downs associated with each. Note that these drilldowns and dashboards are highly customizable and if the customer desires a different representation, this is easy to do.
Static dashboards are yesterday’s way of finding data. Our dashboards can be dynamically rendered as a result of the questions asked in Slack, for example, and all the operations teams can have joint access to the information to troubleshoot and address a network or IT incident.
Operations teams need the relevant information to be rendered in order to analyze a problem, for the specific context, and in the place that it is necessary. The days of having to learn complex structured query languages to find the information you need, across multiple tools, are gone. Operations engineers need to be able to articulate questions using natural human language and get the responses they need.
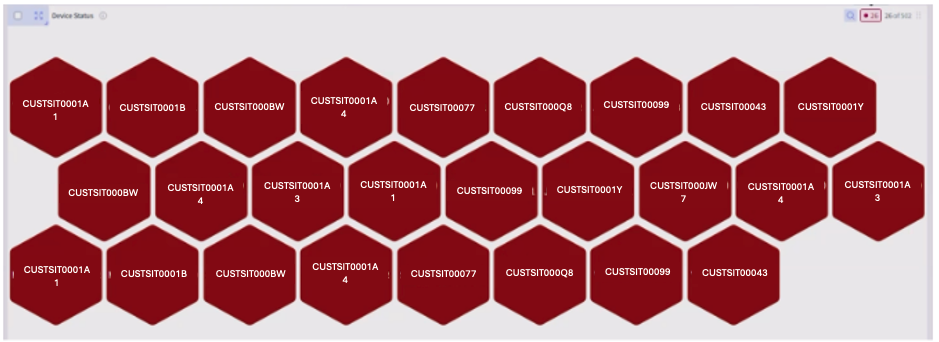
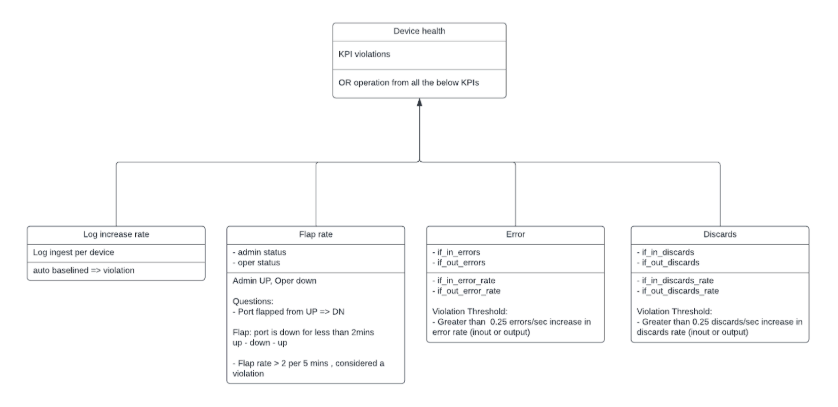
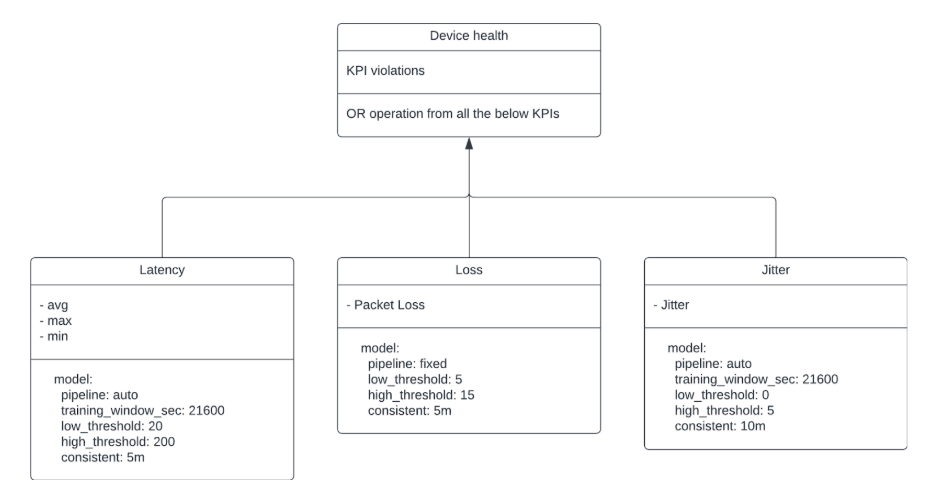
For a specific device, KPIs are derived currently from thousand eyes, vmanage, SNMP and respective device logs. Device health is determined by considering KPIs from all previous sources. Any violation color codes the device health so that the user can easily identify unhealthy devices. Necessary drilldowns are created from each data source to enable the user to view the exact raw detail and the derived metric or KPI.
You can easily view only violated devices when the honeycomb contains many devices.
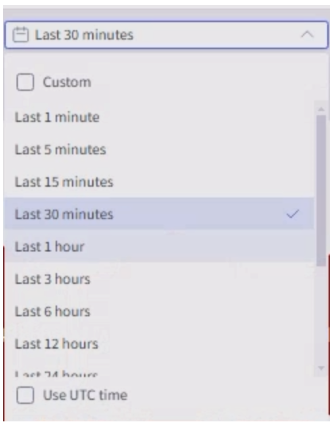
In addition, Selector reviews the timeline for a specific window to see how the health of devices has changed.
You can view specific device metrics by drilling down into a device, revealing more and more details.
You can also easily search for a given device from the dashboard honeycomb. The search bar is implemented as a screen scrape making it easy to search for multiple patterns.
Selector provides self-monitoring as part of the Selector product suite. This software collects system performance data related to the Selector deployment, collects metric, log and event data, and otherwise supports alerting and notification for the Selector support team, as well as customer staff.
Drilldowns also contain a dashboard called Original Analytics to help the user understand where the drill down came from. You can also navigate to other drilldowns easily with a simple click.
Identification of Anomalies
Anomalies surface when outliers are detected based on the variously derived metrics. Derived metrics are created for generating KPIs and can be helpful in aggregating information. Labels are also added as part of this activity.
The methodology Selector uses to identify anomalies is customizable. The same customization applies to training windows for baselining and static thresholds. If there are additional parameters that need to be added, they are easy to add.
Device health is determined by several methods:
- SNMP
- Thousand eyes model
- Vmanage
- Syslogs
Each is detailed below.
SNMP
Thousand Eyes Model
Not all routers have thousand-eyes agents. When drilling down to a device, the Selector platform might not notice thousand-eyes KPIs.
Vmanage
Only Vmanage inventory and events are considered. The Selector platform catches events associated with Vmanage and uses these events for correlations.
Syslogs
As described previously, Syslogs are mined to capture events and entities. These are used for further correlations. Additional insights are generated based on the number of logs and the number of events occurring for a specific device.
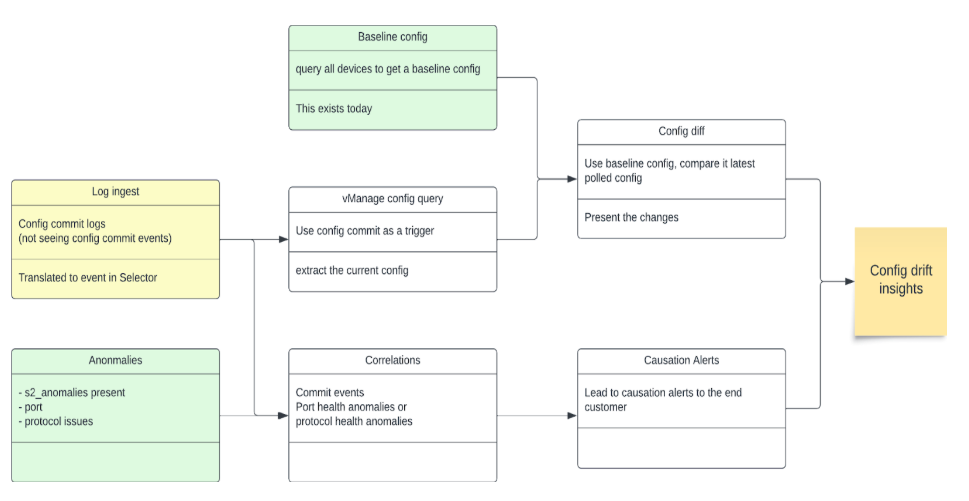
Configuration Drifts
The Selector platform also determines configuration drifts and use that data for correlations to identify specific configuration changes that lead to an event or degradation in performance.
Correlations
Using all data sources, device monitoring, and anomaly identification methods, the Selector platform performs both temporal and contextual correlation. Two models are used in most cases to achieve this post-temporal filtering:
- Recommender models identify the correlation of various events
- Association models identify causal relationships
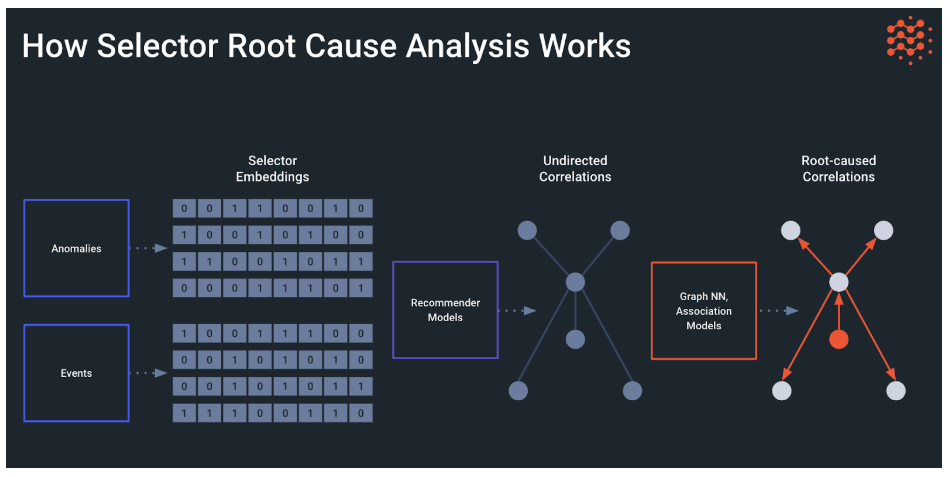
The two models used together helps to provide root cause analysis (RCA) and help in identifying the issue faster reducing MTTI, MTTD and MTTR.
The same concept applies for both WAN and wireless analytics.
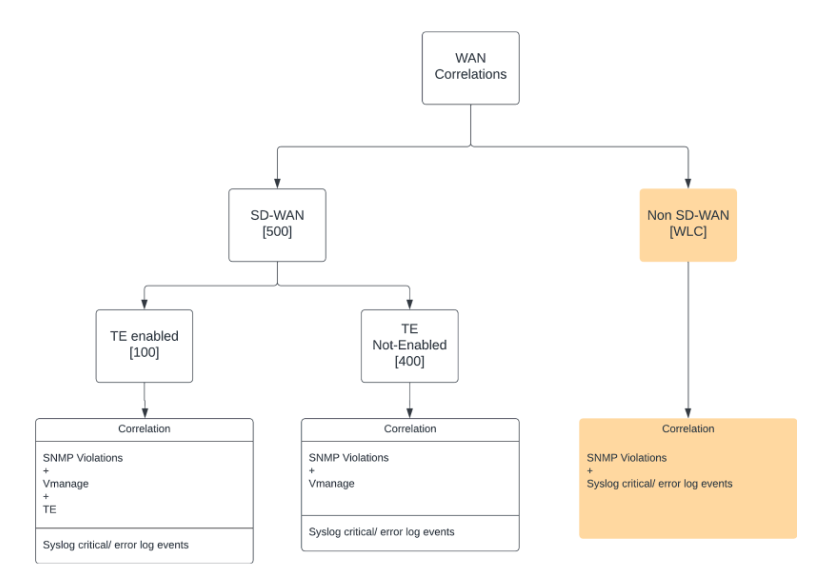
The Selector correlations dashboard has three tabs (wan, wlc, meraki). They are split for user readability because the undirected graph tends to get busy. There are various ways to filter the graphs based on labels and events
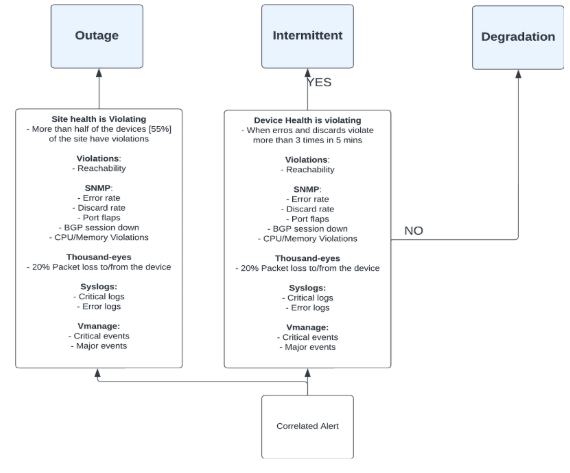
For example, the determination of a device whose health violates some condition is made by considering both thousand-eyes data and SNMP data. The same correlation summary is translated into an event.
Correlations are done on a per device basis. Selector can work with the customer to modify the correlations to include more consolidations, including connected sites and devices connected over SDWAN.
Instant Correlations
Instant correlations occur when the Selector platform looks not at 10-minute historic windows to perform correlations but looks at the current time to perform instant correlations based on various events. These events can also be filtered. This is most useful during debugging.
Alert Generation
Alert generation and event-intelligent alert generation are important pieces of the Selector platform. The alerts are not based on individual devices, but on overall associations that have been created. Once the correlated events are identified, alerts can be sent based on various integrations. During the POC, integrations to Email, Moogsoft and Itential can be done. In addition, Slack-related alerts can be demonstrated. If the customer has interest in integrating these alerts into other tools such as Microsoft Teams or others, this can be done easily because these integrations already exist in the Selector platform. The payload is also customizable.
Moogsoft Alert
The Selector platform can also record notifications along with raw and processed payloads that are sent to various tools.
During maintenance windows, the alerts are suppressed and ensure that no alerts are sent out to disrupt maintenance activities.