This is the multi-page printable view of this section. Click here to print.
Integrations
1 - Pingmesh Integration
Contents
Overview
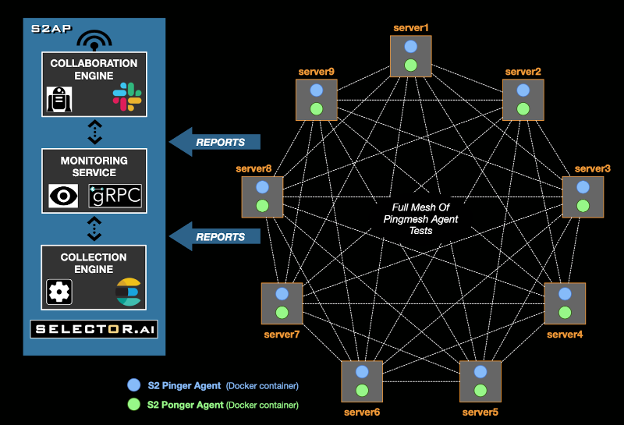
Selector Pingmesh is a comprehensive, synthetic performance measurement solution designed for hybrid networks, applications, and infrastructure. It provides an “over-the-top” mechanism for assessing network health by employing probe agents to continuously exercise the data plane.
The way Pingmesh is used in S2AP is shown in the following figure.
Key Benefits
Continuous & Synthetic Performance Measurement
Pingmesh operates by deploying agents that generate synthetic traffic to measure critical network metrics. This proactive approach ensures real-time visibility into network performance without relying solely on user traffic.
Core Metrics: Measures latency, packet loss, and jitter.
Path & Reachability: Validates network paths and reachability across the infrastructure.
Protocol Support: Utilizes UDP probes for standard measurements, with support for TCP and ICMP ping probes.
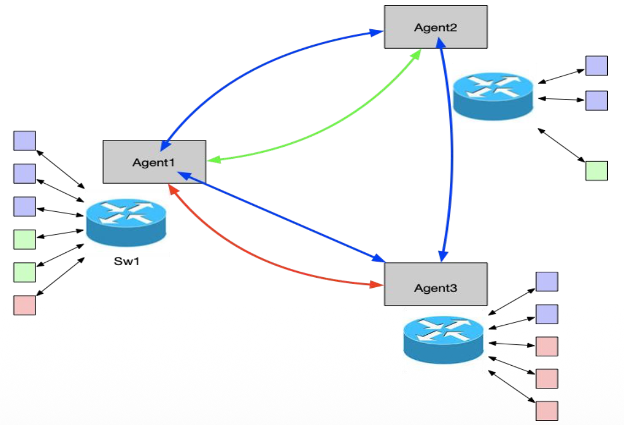
Multi-VRF Awareness for Complex Architectures
Designed for modern, segmented networks, Selector Pingmesh supports multiple Virtual Routing and Forwarding (Multi-VRF) environments.
VRF-Aware Agents: A single agent can act in multiple “pinger” and “ponger” roles simultaneously across different VRFs (e.g., VRF1, VRF2, VRF3).
Resource Efficiency: This architecture reduces the need for multiple agents on a single switch, allowing one agent to validate connectivity across segmented routing domains, as shown in the following figure.
Enhanced Path Validation with ECMP Support
To accurately validate load-balanced networks, Pingmesh employs source port randomization.
Path Diversity: By randomizing the source port or multiple source ports for probe packets, the system exercises different links in an ECMP (Equal-Cost Multi-Path) bundle.
Traffic Simulation: This ensures that probe packets traverse varying paths to the destination, detecting issues that might be hidden by a single static path.
Integrated Analytics with S2AP
The solution is powered by the Selector Software Analytics Platform (S2AP), which acts as the “brain” of the operation.
Correlation: Metrics are correlated with tags (for example, rack, pod, cluster, site) and other logs/events for deeper context.
Visualization: Data is rendered into actionable formats such as threshold violation matrices (heatmaps), line plots, and honeycomb charts.
Technical Architecture
The Pingmesh architecture consists of distributed agents communicating with a central management and analytics layer.
Components
S2 Agents: Lightweight Docker containers running on network devices (servers/switches) for active Pingmesh.
Pinger: The sender of probe packets.
Ponger: The responder to probe packets.
S2AP: Handles collection, monitoring, and analysis.
Monitoring Service: Manages agent registration and configuration using gRPC.
It is essential to understand the distinction between Active and Passive Pingmesh configurations to select the right deployment model for your network. While both active and passive modes deliver critical health metrics such as RTT and packet loss, they utilize different protocols and have distinct infrastructure requirements. The table below details the operational differences between these two types to help you align the solution with your specific monitoring goals.
| Feature | Active Pingmesh | Passive Pingmesh |
|---|---|---|
| Protocol | UDP only | ICMP only |
| Ports | Destination: UDP 52000 (Default) Source: UDP 52001 (Sequential) or 20000-32000 (Randomized) | N/A (Standard ICMP Echo probes do not use transport layer ports) |
| Agent Requirement | Multiple Agents (Requires a “Pinger” and a “Ponger” agent) | Singular Agent (One agent probes a target device or devices) |
| Metrics Collected | Round Trip Time (RTT), Packet Loss, Jitter | Round Trip Time (RTT), Packet Loss, Jitter |
| Traffic Generation | Generates synthetic UDP traffic between agents to stress-test specific paths. | Uses standard ICMP echo requests (Ping) to check reachability of non-agent devices. |
Deployment & Security
Automated Installation: Agents are installed by way of DEB/RPM packages and can be managed using Ansible scripts.
Security: Releases are signed using GnuPG (GPG), and the system supports secure distribution with APT/YUM repositories.
Inventory Management: Devices can be added dynamically using CSV upload or API, with support for automated instance creation.
Key Features at a Glance
| Feature | Description |
|---|---|
| Probe Types | UDP (default), TCP, ICMP Ping, Traceroute. |
| Topologies | Full mesh, partial mesh, and multi-node S2AP support. |
| Inventory Logic | Flexible grouping by Cluster, Rack, Site, and Suite labels. |
| Visualizations | Heatmaps for quick health checks (Red/Yellow/Green status) and time-series plots for historical trends. |
| Scalability | Supports high-scale environments with automated “fanout” reporting and configurable ping intervals. |
Example Usage
Network Health Barometer: Acts as a continuous “heartbeat” for the network data plane.
Latency & Loss Monitoring: Precise tracking of packet loss percentages and round-trip latency.
Fabric Verification: Validates connectivity across Spine, Leaf, and ToR switches in complex data center fabrics.
2 - Slack Integration
SelectorAIOps Slack Integration
Selector Software enables customers to monitor, analyze, and share their digital infrastructure performance using Slack and SelectorAIOps. Selector AI’s analytics and collaboration engine hides the complexity of heterogeneous infrastructure and tools. Our turn-key solution sits on top of disparate information sources to provide visibility, monitoring, correlated real time insights and alerting for hosts, devices, infrastructure, and network health and performance. We present these insights in a unique collaborative manner between people, machines, and applications acting in unison enabling teams to interact with the SelectorAIOps platform in the collaboration tool of their choice.
SelectorAIOps provides actionable multi-dimensional insights to network, cloud, and application operators. It provides a query interface to monitor and analyze events and trends. Users can keep their team updated on performance, view alerts, and share dashboards in the specific Slack channels where their team collaborates. SelectorAIOps provides these insights by ingesting metrics from multiple data sources, and doing an analysis on historical metrics and real-time streaming metrics.
Configuration
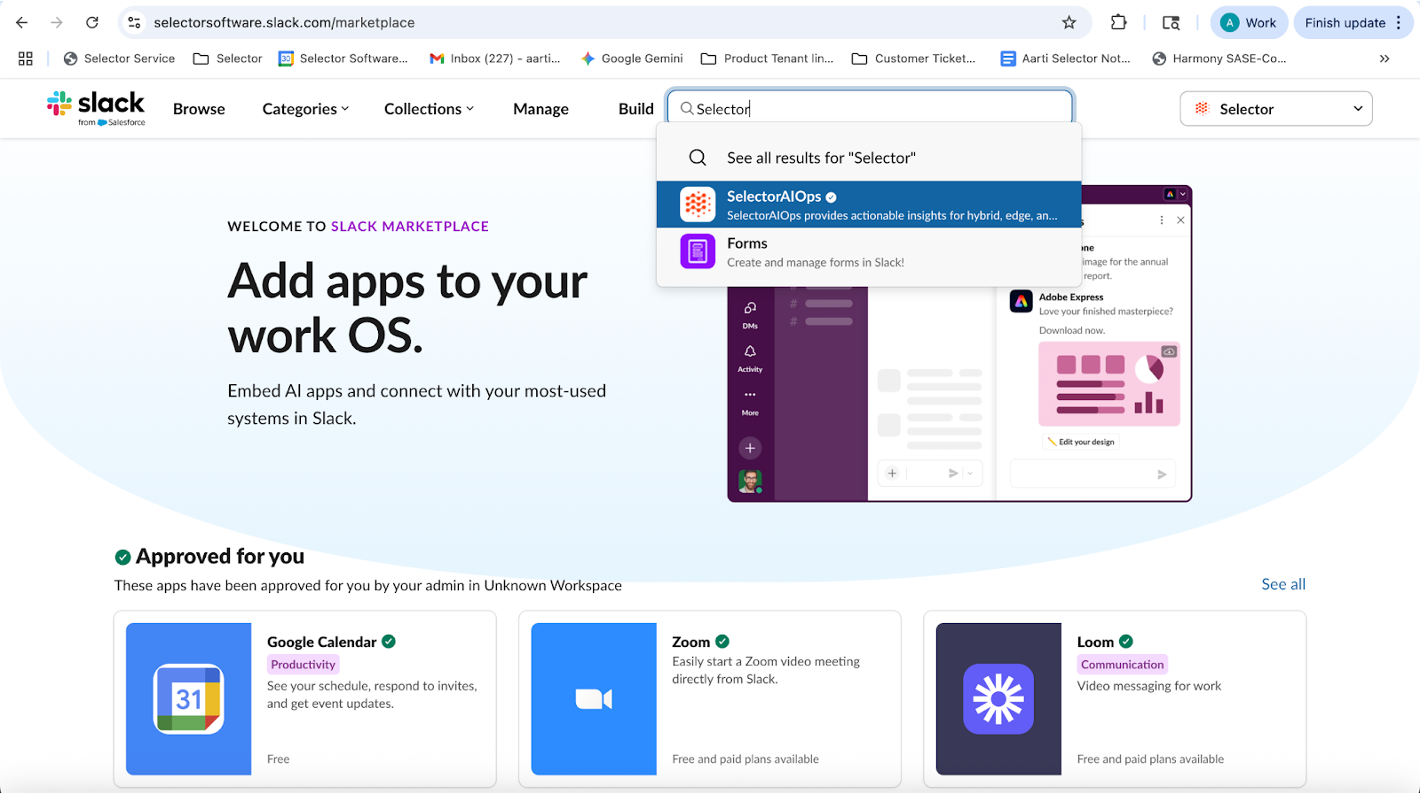
Step 1:Add the Selector AIOPs App to your Slack workspace.
- Ensure that you are signed into your Slack workspace account.
- Find Selector AIOps app in Slack marketplace, and install or add the app to your slack workspace.
- Prior to starting, please ensure that you have the appropriate permissions to install apps in your Slack workspace.
- Reach out to your Selector contact (Solution Engineer or Sales Engineer representative) if you have questions here.

Step 2: Create the Slack channel in your Slack workspace that you want to interact with the Selector AIOPs BOT. You may need appropriate permissions to do this. (For example, test-demo-slack-channel)
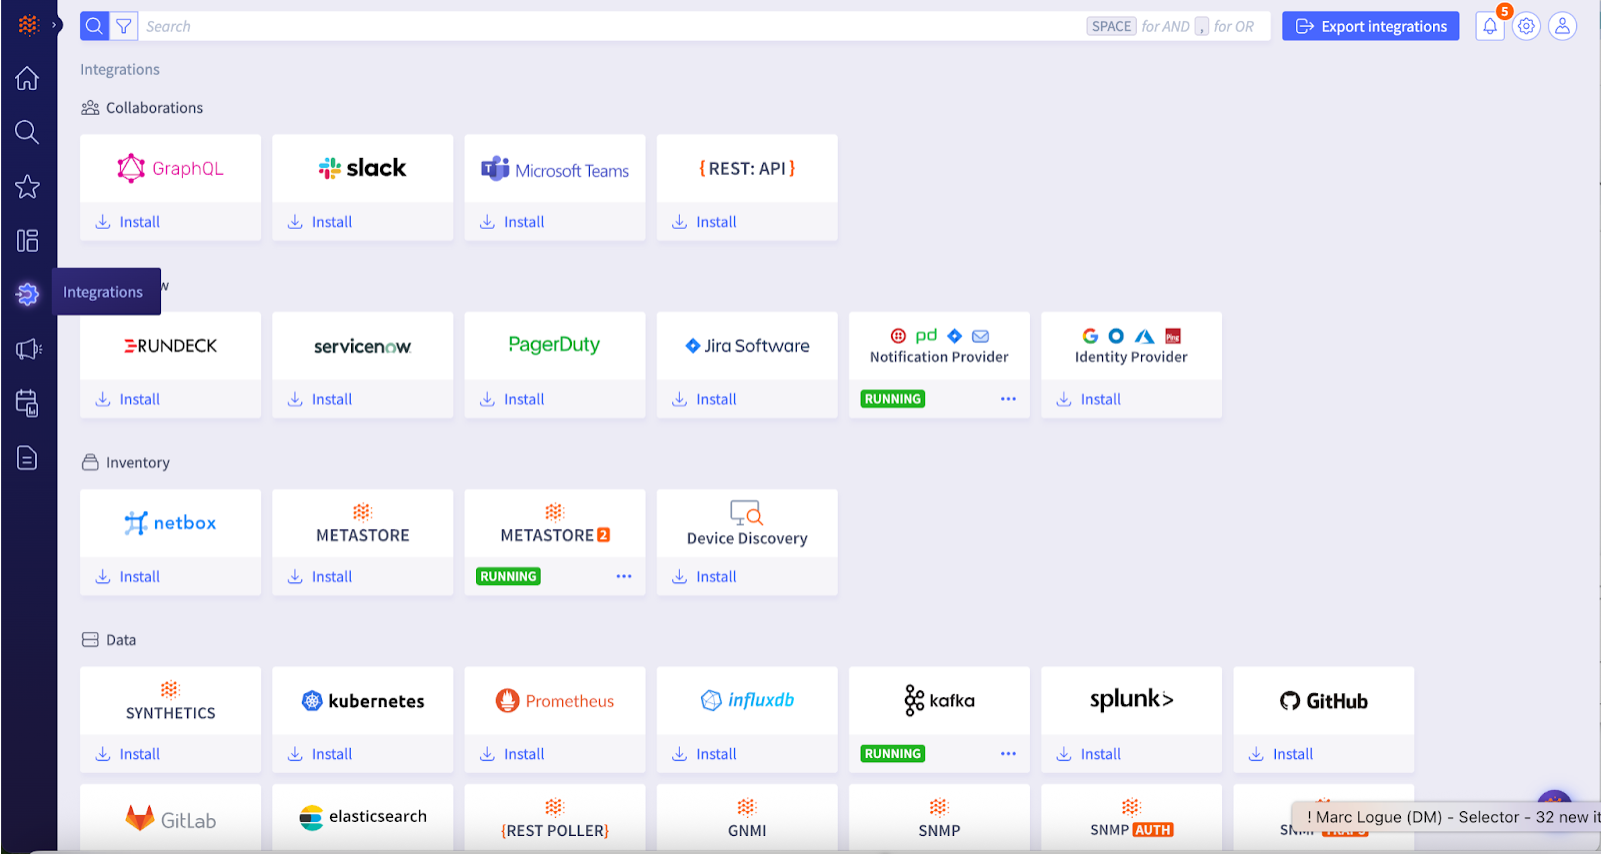
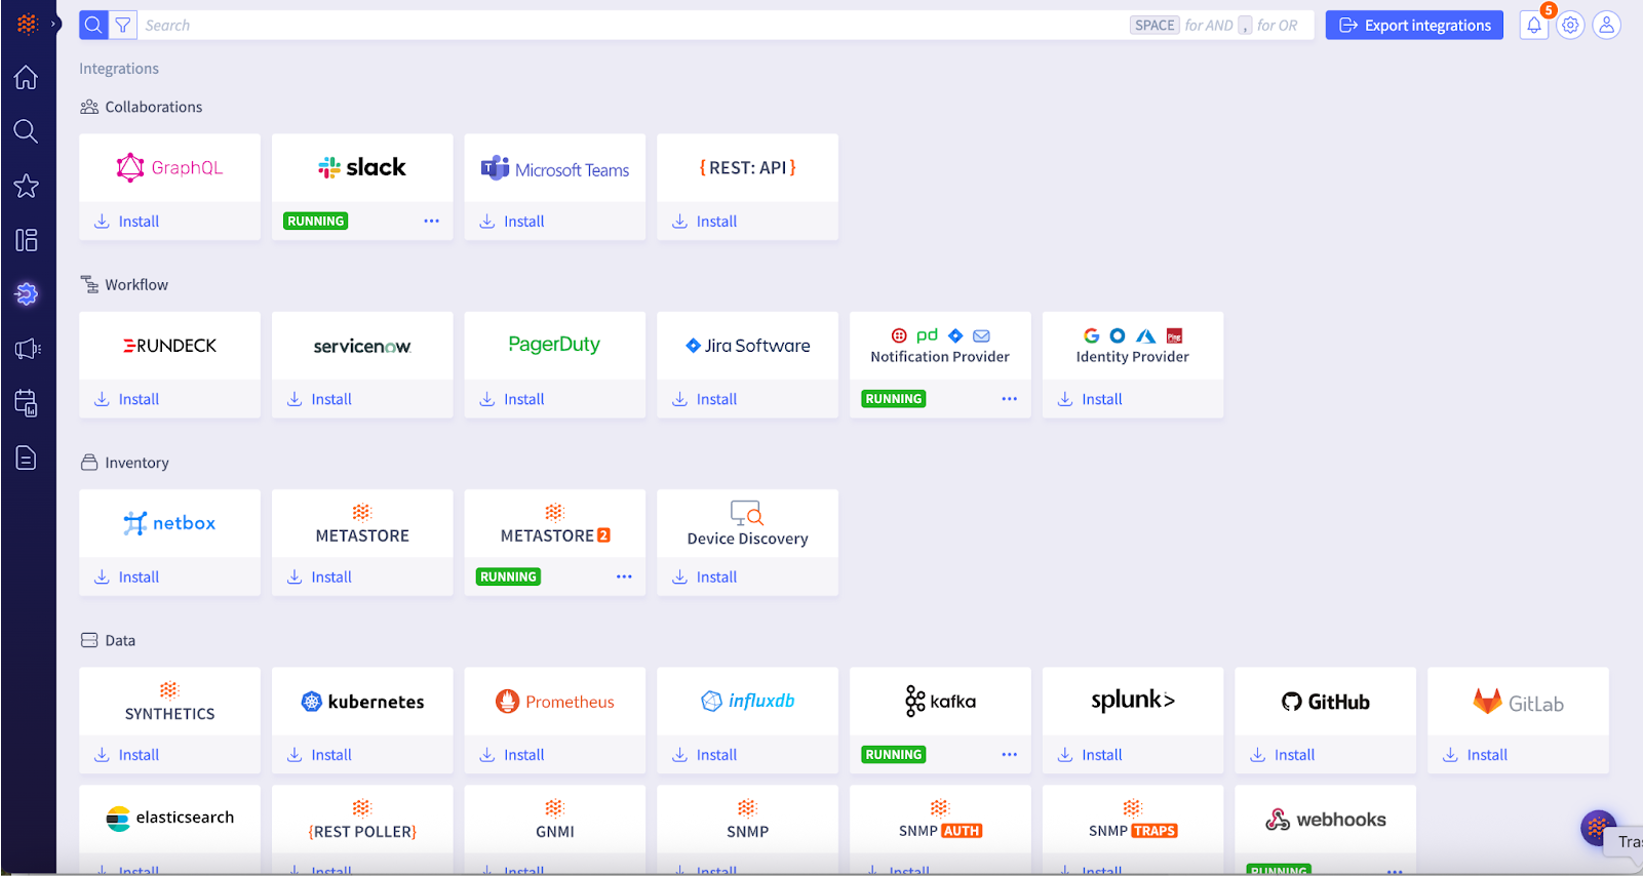
Step 3: Navigate to your Selector integrations page in your Selector S2AP UI to set up the Slack integration. Please ensure you have admin access to S2AP.
Example URL selector.ai/app/integrations.
Please ensure you use the correct URL corresponding to your S2AP instance.
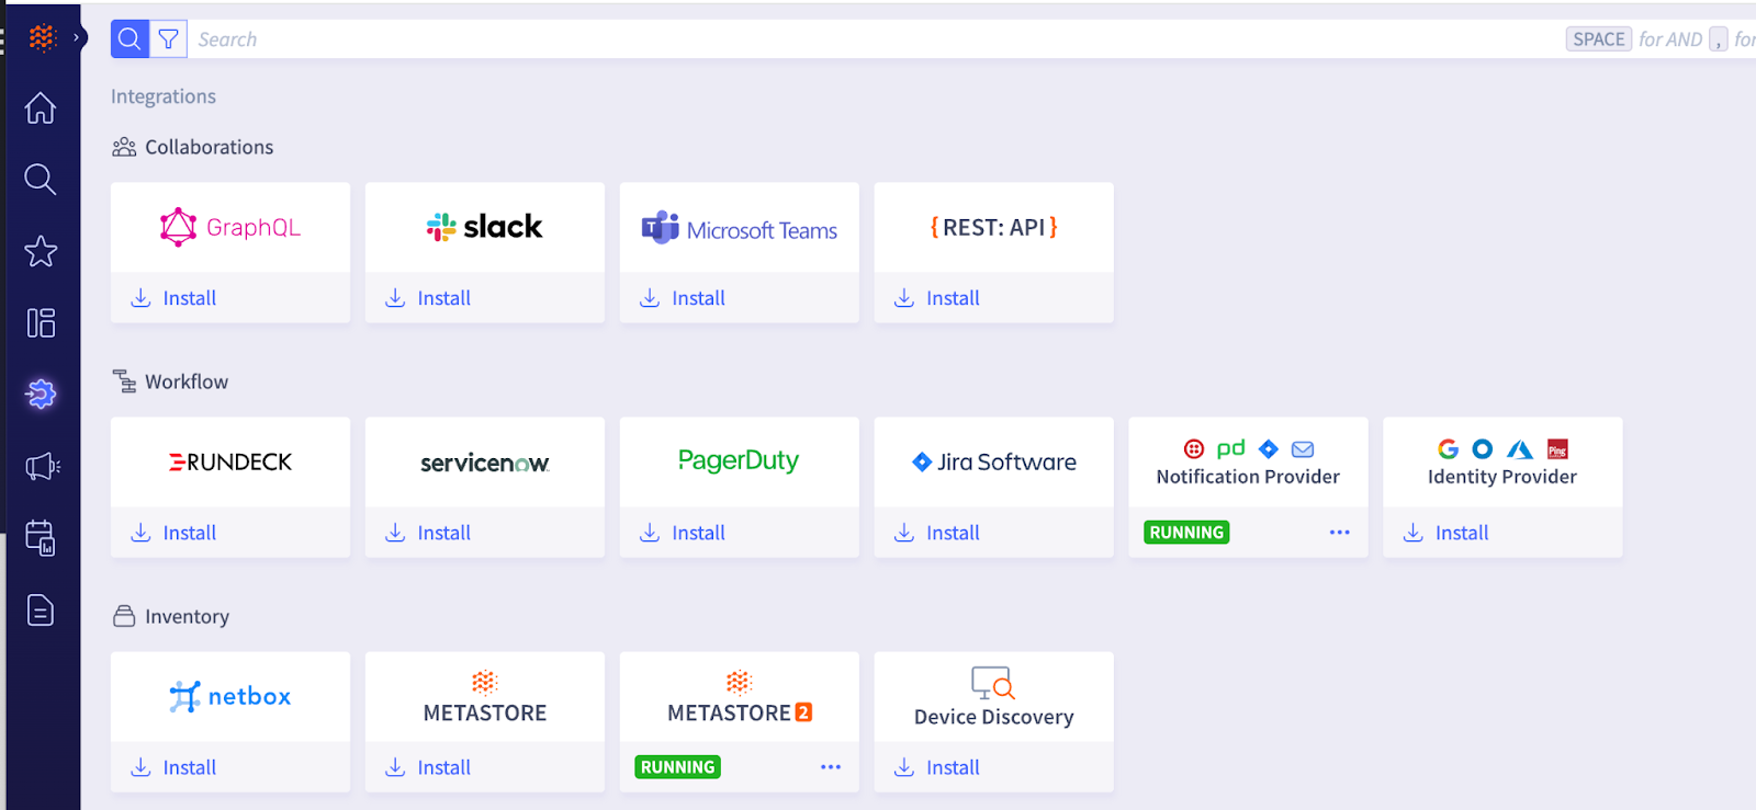
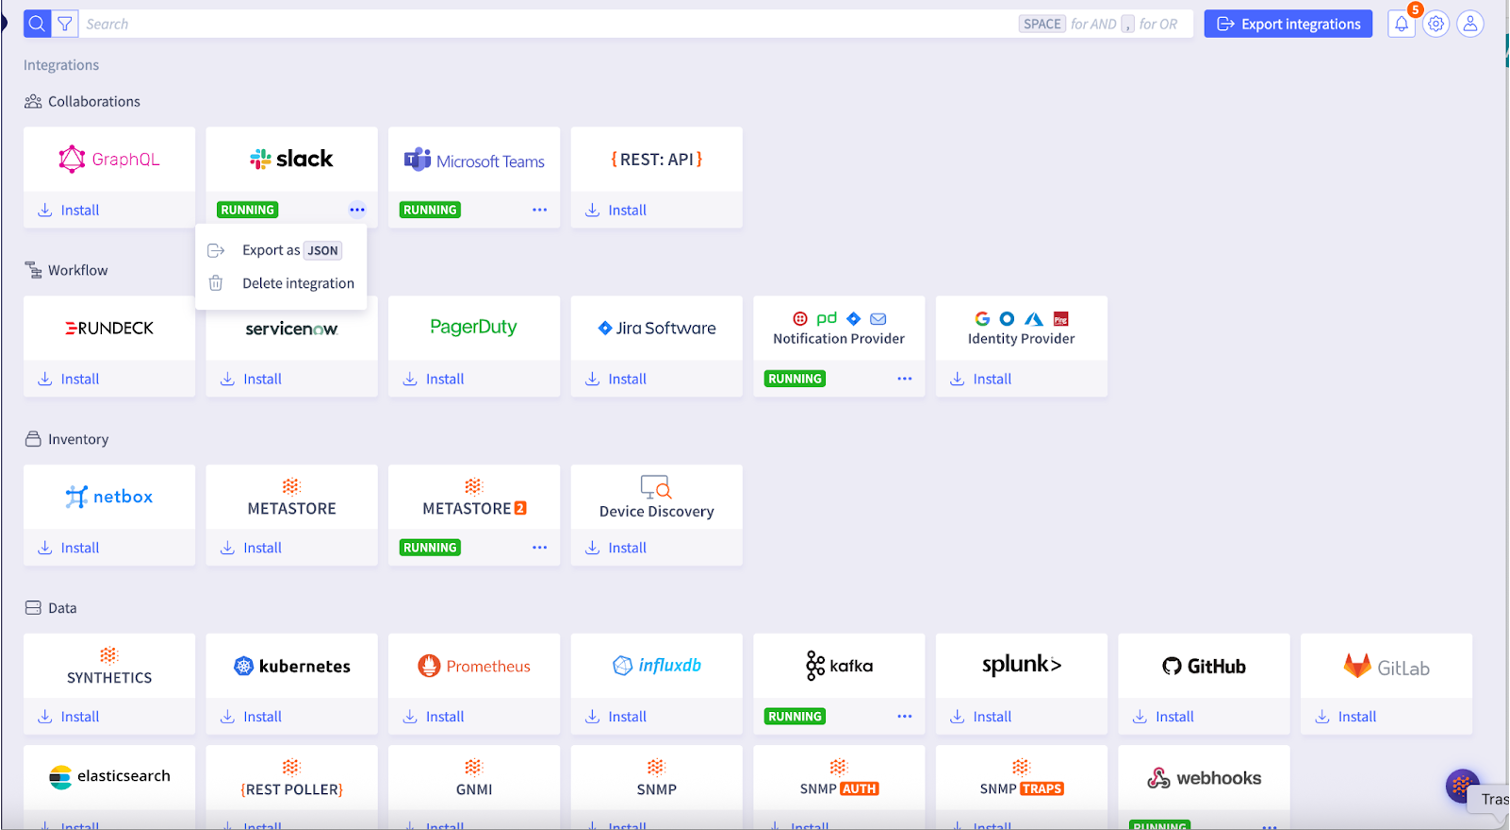
Step 4: Click on install under the Slack integration logo to enable the workflow to integrate with your given Slack workspace and a Slack channel in it.
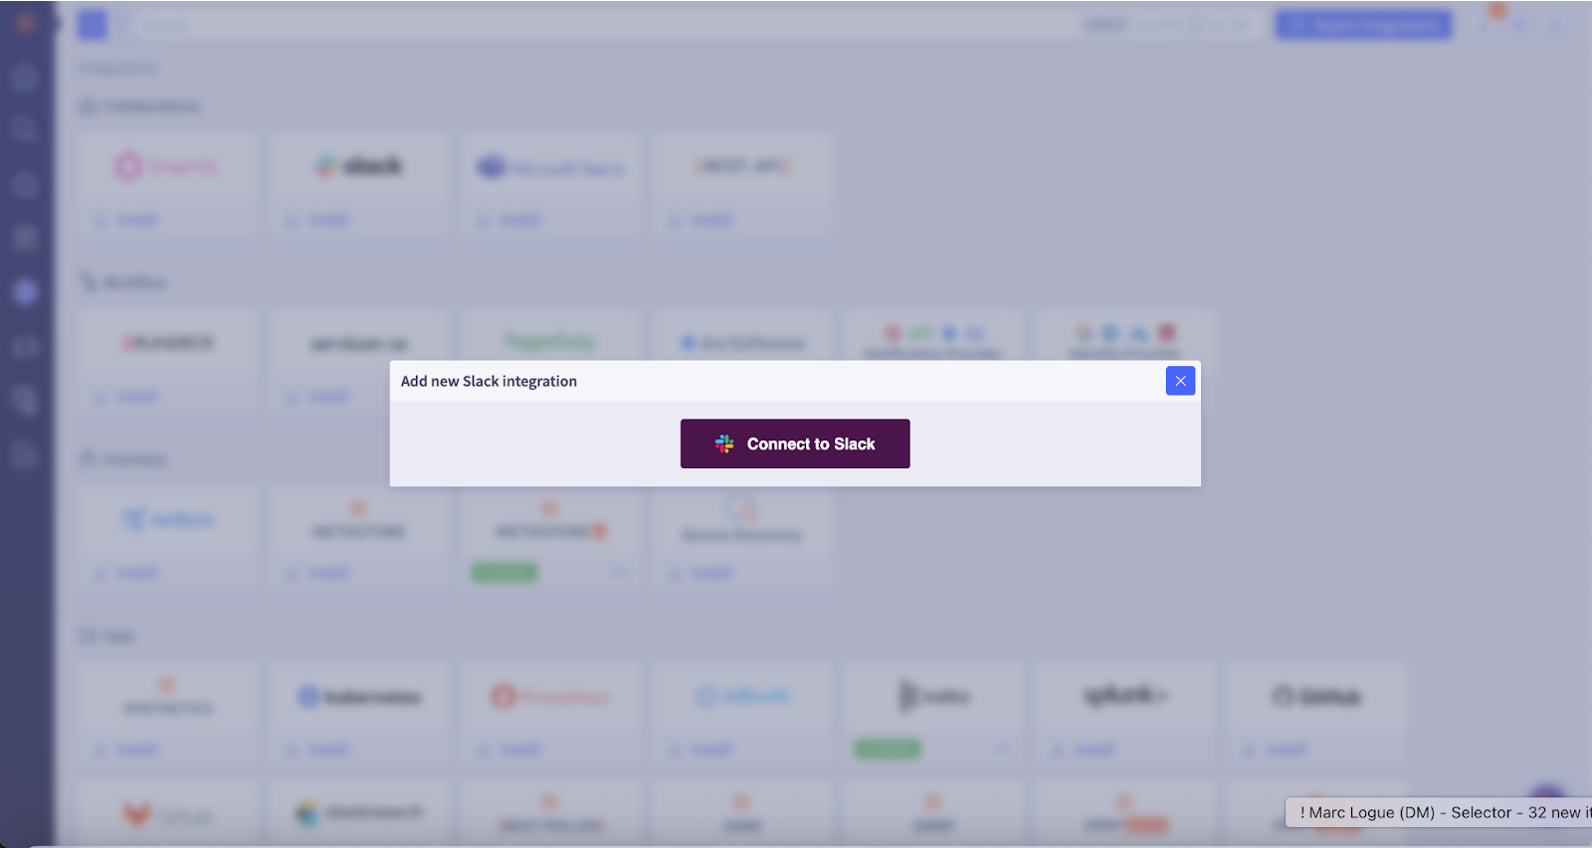
Step 5: Click on Connect to Slack in the S2AP UI.
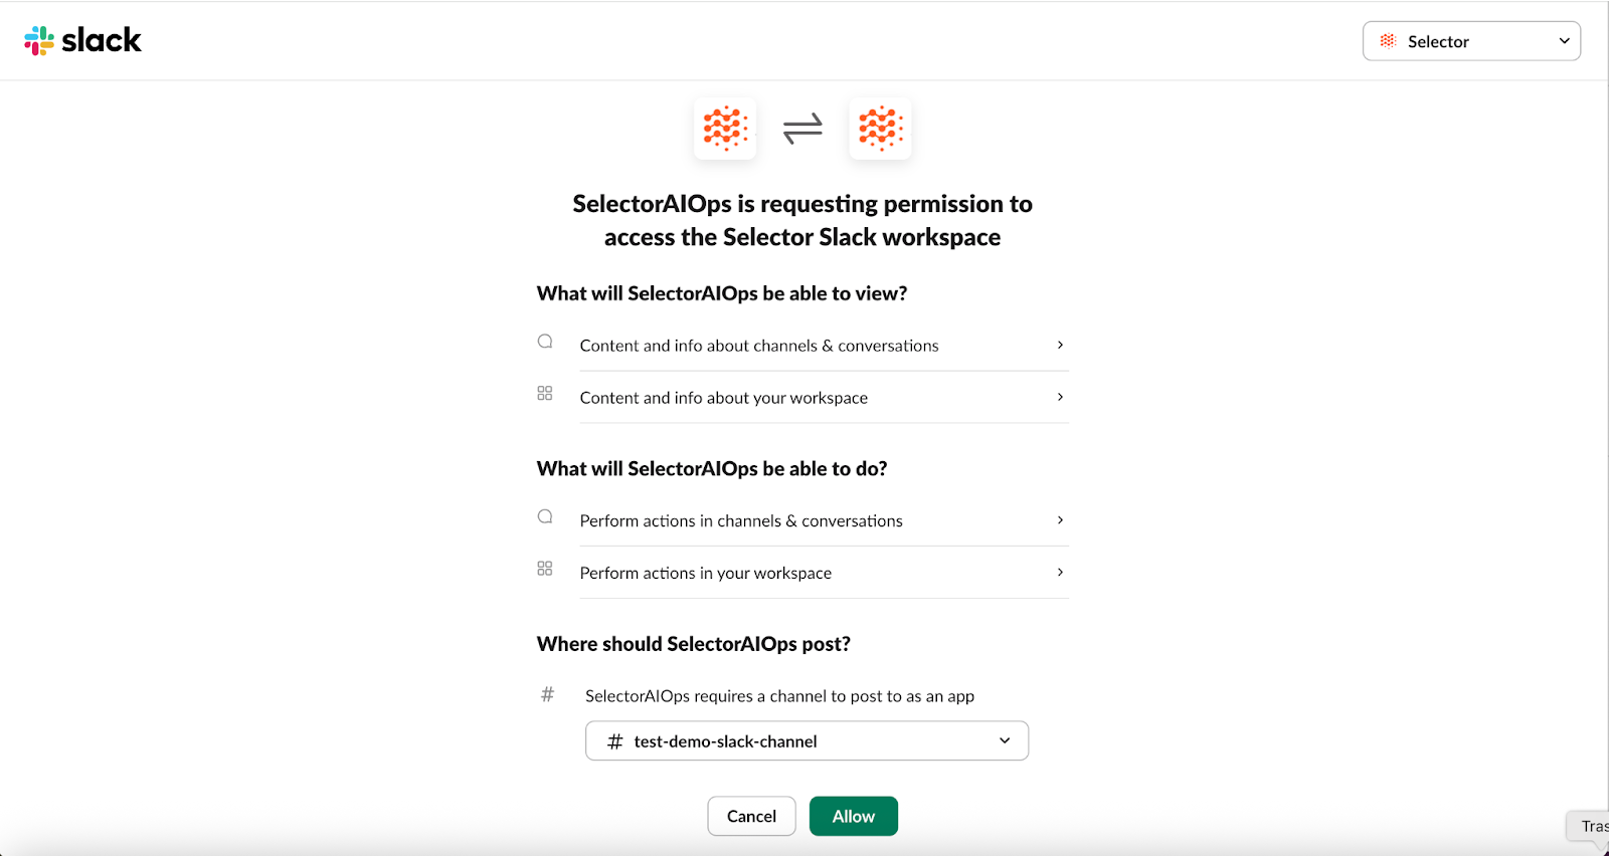
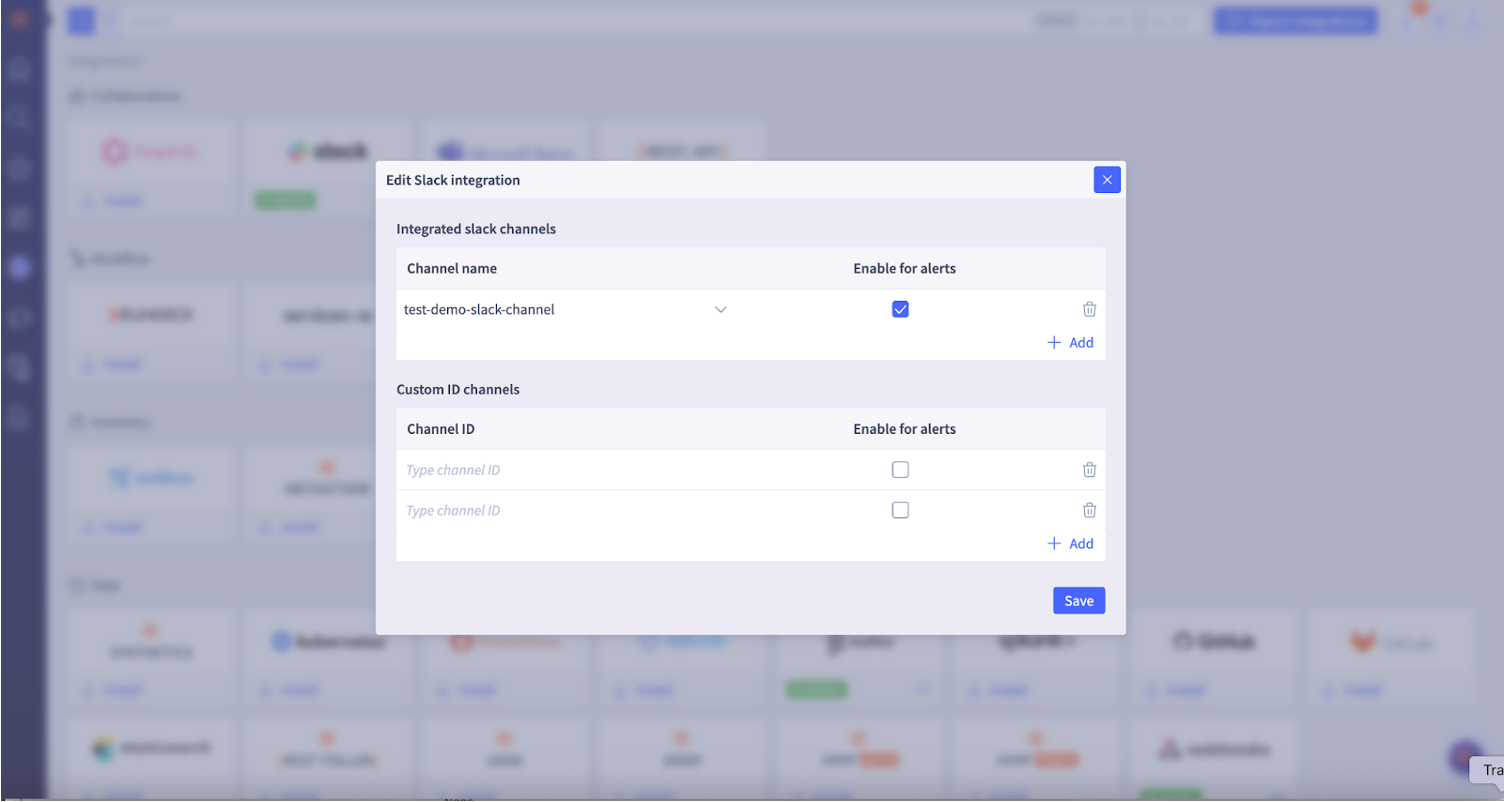
Step 6: Select the channel name where you want to interact with the Selector AIOps BOT from the drop-down list (For example: test-demo-slack-channel). Then select Allow.
Step 7: A pop-up appears in the S2AP UI, along with the channels you can select to interact with the Selector AIOPs BOT. For example, in this case, the test-demo-slack channel.
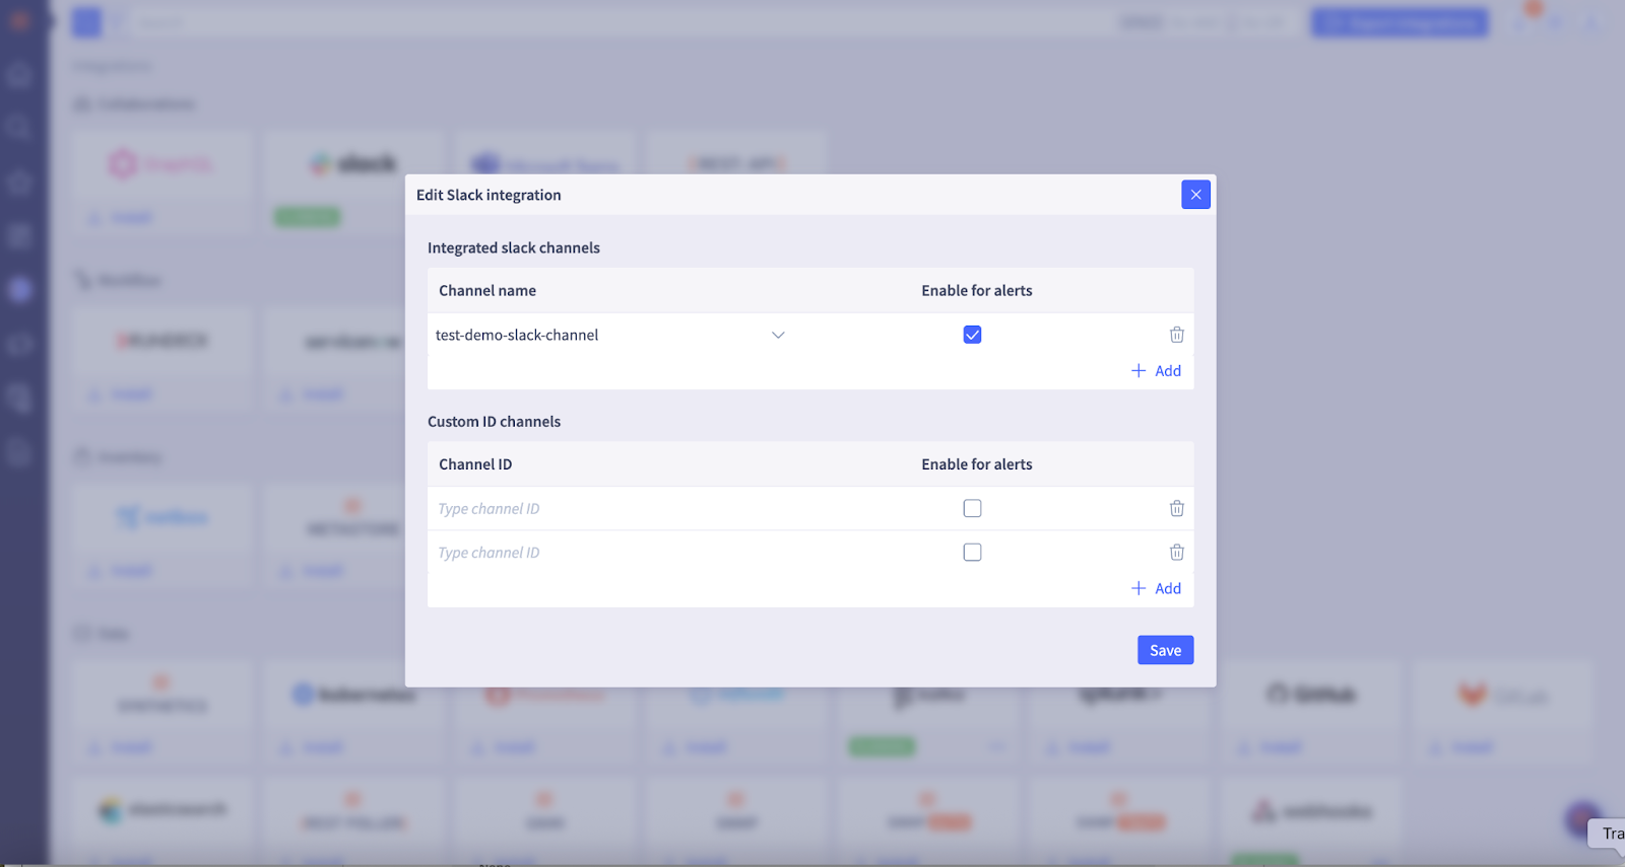
If you want to see the alerts in these channels, you can enable alerts in the check box.
You can also enable alerts at a later time if you choose. Also refer to Step 8.
If you want to interact with the Selector AIOps Bot in a custom ID Slack channel, find the channel ID and enter it in the pop-up window in the Custom Channel ID section.
How to find channel ID for a custom app: Click on the Slack channel name for that custom app, then locate the ID.
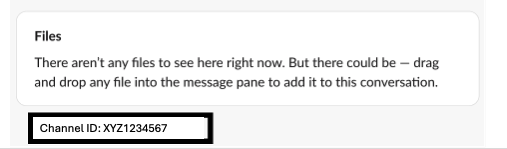
Click Save, and then the Slack integration should be up and running.
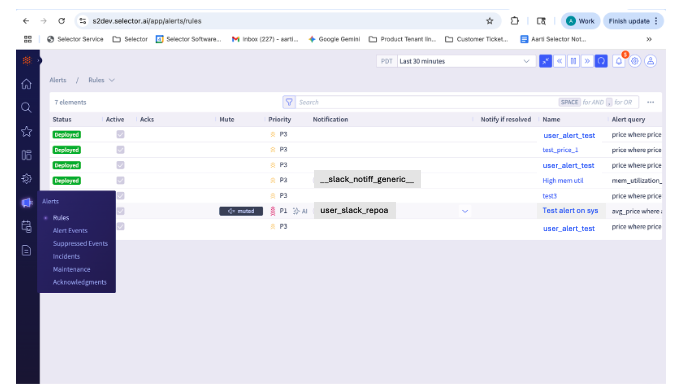
Step 8: If you want to send alerts to Slack channels, go to the Notification provider on the Integrations page, add a notification provider, and add the Slack Channel Ids that you want to get alerts. You also need to provide the correct slack_token attribute corresponding to your Slack account.
Note: you can also simply duplicate the auto-created __slack_notif_generic notification provider to copy all attributes and update it with the relevant channel ids.
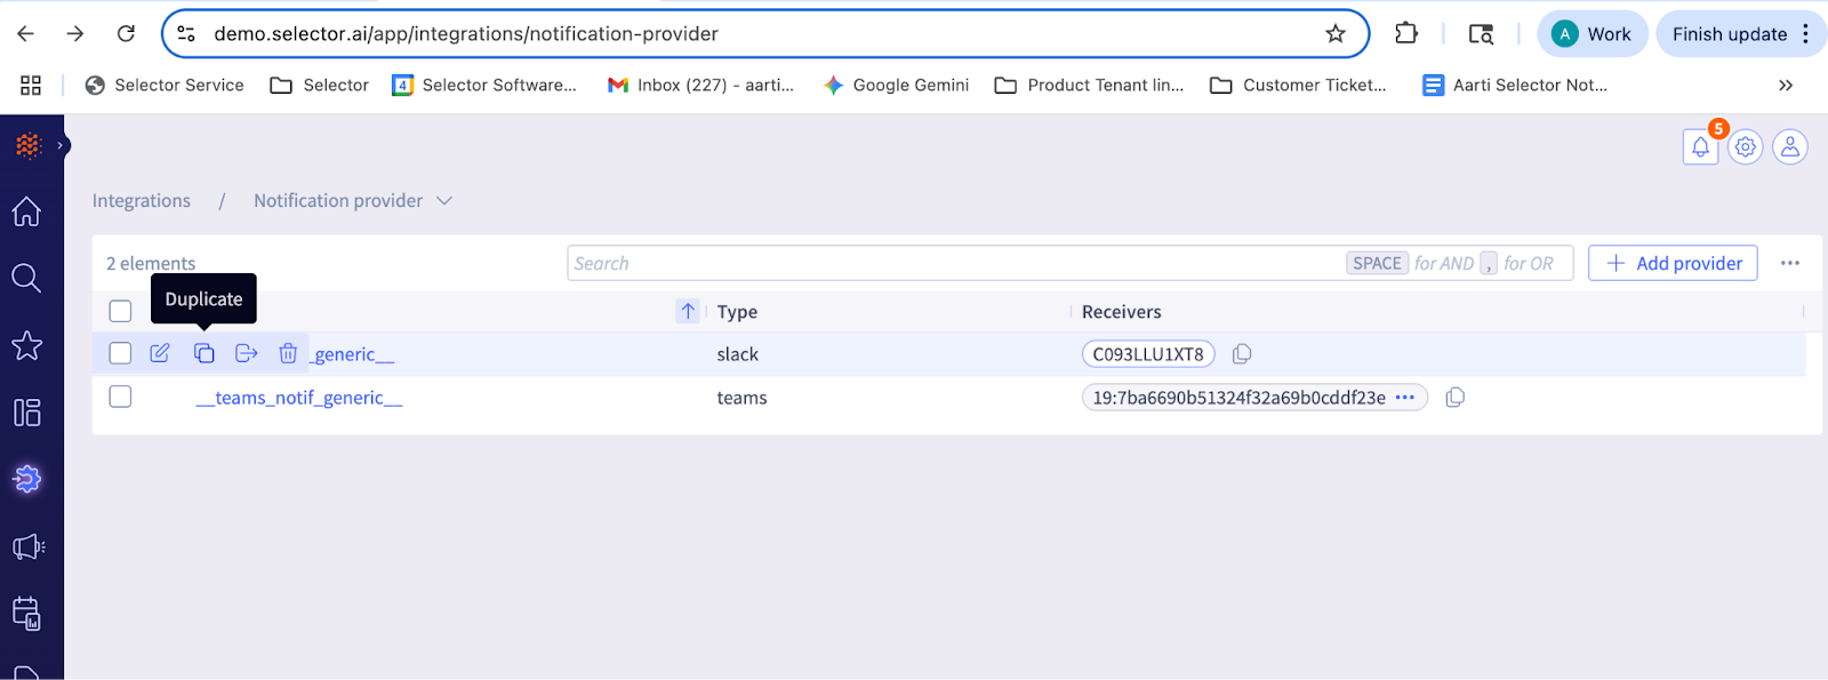
Then, associate the Notification Provider with the corresponding alert rule.
Step 9: Invite the SelectorAIOps BOT to the Slack channel in the correct Slack workspace, using app mention. Check the BOT response in the Slack channel.

Step 10: Execute the slash (/) command on the channel to check SelectorAIOps’ response in the Slack channel. See the Operations section for more details.
Step 11: At a later time, if you want to add additional channels from your Slack workspace to interact with the Selector AIOps app, come back to the Integrations page in the S2AP UI, click on Integrations, then click on the Slack tile to Add additional channels.
Step 12: To connect the SelectorAIOps BOT to a new Slack workspace, please delete the current integration by clicking on Delete Integration and repeat the above steps for a new Slack workspace.
Operations
Query service using Slack
You can use following actions with the SelectorAIOps query service:
- Get a report of metrics over a period of time
- Plot metrics as line graph, bar graph, stacked graph, honeycomb, event graph
This is a list of available “slash” (/) commands:
- /select [query]: Query Selector Analytics
- /select summon: Display a modal to summon a dashboard/widget in Slack
- /select summon [dashboard/widget name]* Summon a dashboard or widget to Slack
- /select help: Display help Options
Collaborate using Slack
- Users can share and collaborate with other team members in a slack channel
- Users can view alerts, issues in the slack channel
- Users can query S2AP using natural language queries and see the status of their network and devices in the slack channel
- Users can view topology, dashboard widgets in their slack channel.
Support
For support and questions, please contact us or send an email to support@selector.ai.
3 - MS Teams Integration
SelectorAIOps Microsoft Teams Integration
Selector Software enables customers to monitor, analyze, and share their digital infrastructure performance using Microsoft teams and SelectorAIOps. Selector AI’s analytics and collaboration engine hides the complexity of heterogeneous infrastructure and tools. Our turn-key solution sits on top of disparate information sources to provide visibility, monitoring, correlated real time insights, and alerting for hosts, devices, infrastructure, and network health and performance. We present these insights in a unique collaborative manner between people, machines, and applications acting in unison enabling teams to interact with the SelectorAIOps platform in the collaboration tool of their choice
SelectorAIOps provides actionable multi-dimensional insights to network, cloud, and application operators. It provides a query interface to monitor and analyze events and trends. Users can keep their team updated on performance, view alerts, and share dashboards in the specific Microsoft teams channels where their team collaborates. SelectorAIOps provides these insights by ingesting metrics from multiple data sources and doing analysis on historical metrics and real-time streaming metrics.
Configuration
Before beginning, make sure that you have added the Selector AIOps App to your Teams workspace.
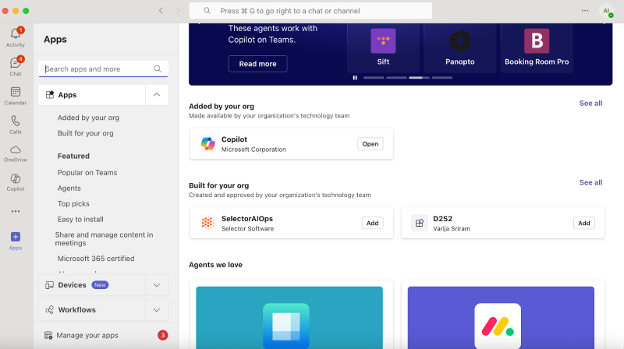
Step 1:Add the Selector AIOPs App to your Microsoft Teams
- Make sure you are signed into your Microsoft Teams account.
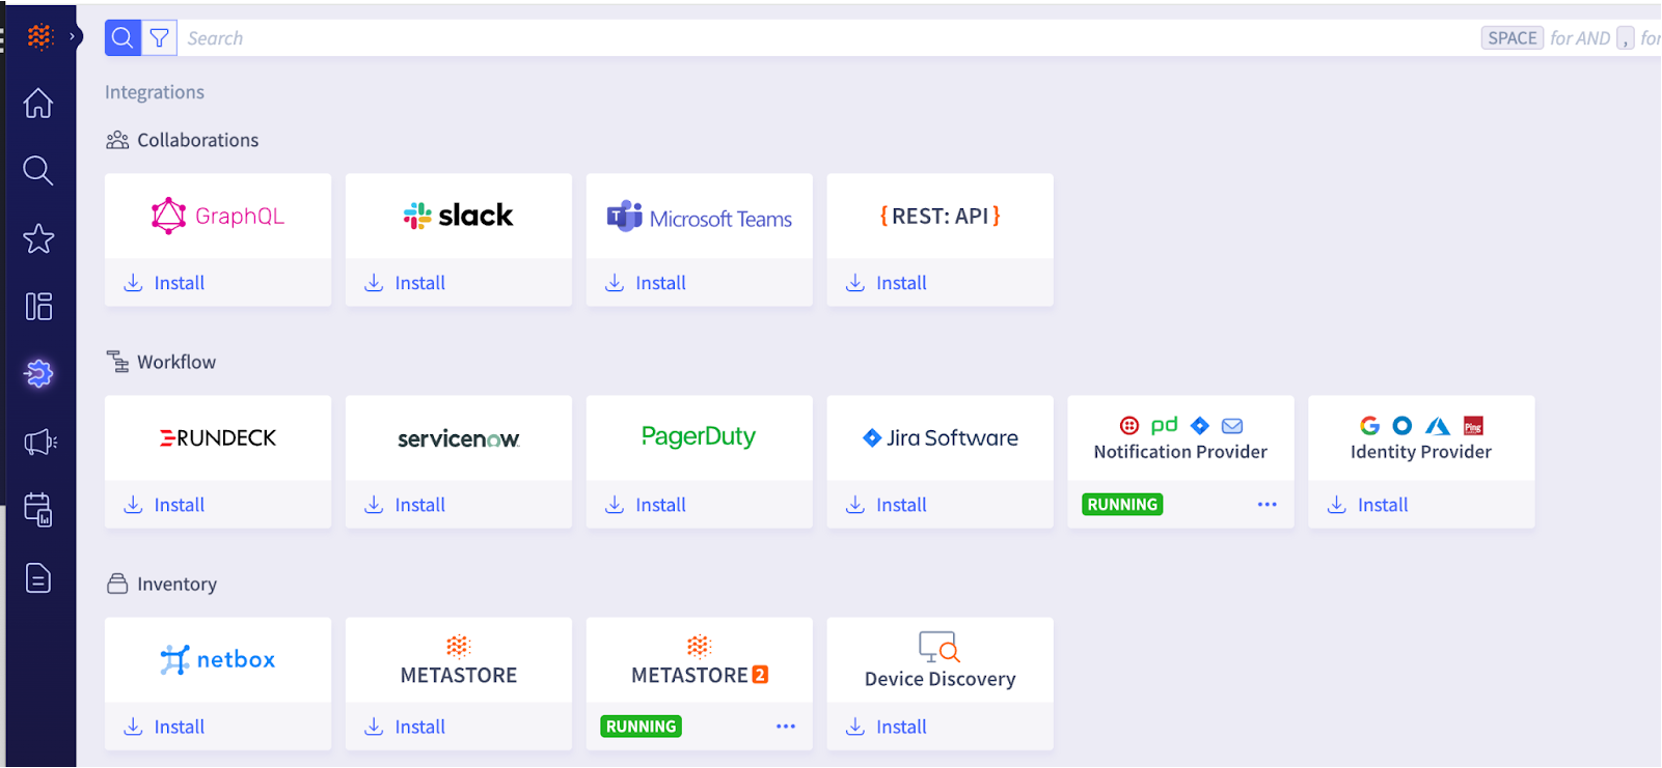
- Search for Selector AIOPs in Microsoft Teams Apps, and select Add. You can get this from your Teams app (as shown below), or from the web.
- Before doing this, please make sure you have the appropriate permissions to install apps in your Microsoft Teams account.
- Reach out to your Selector point of contact (Solution Engineer or Sales Engineer) if you have questions.
Step 2: In your Microsoft Teams app, create the Teams channel through which you want to interact with the Selector AIOPs BOT.
Step 3: Collect the Channel ID information for that channel as explained below.
- Note: Your Selector representative should be able to help you with any questions you have.
Paste the copied link in a browser window. Follow the instructions below to extract the Channel ID.
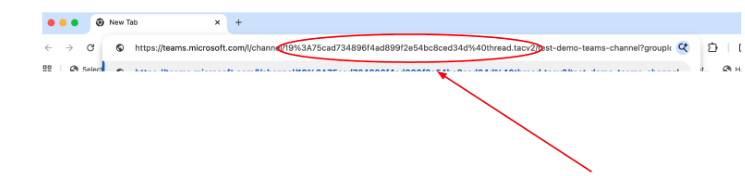
Extract the Channel ID, which is the portion after
/channel/ending with.tacv2(see example above). In the example the extracted Channel id is: 19%3A85af72f0be4646dca7d3230886c6f88b%40threadedit the channel ID as follows:
Remove “%3a” located at the beginning of the extracted Channel ID and replace it with a colon :
Remove “%40” located towards the end of the extracted Channel ID and replace it with “@” sign. From the example above, the edited channel ID now looks like this: 19:85af72f0be4646dca7d3230886c6f88b@thread.
Provide this edited channel ID to your Selector contact (Customer Success or Solutions Engineering representative), who will update some YAML files.
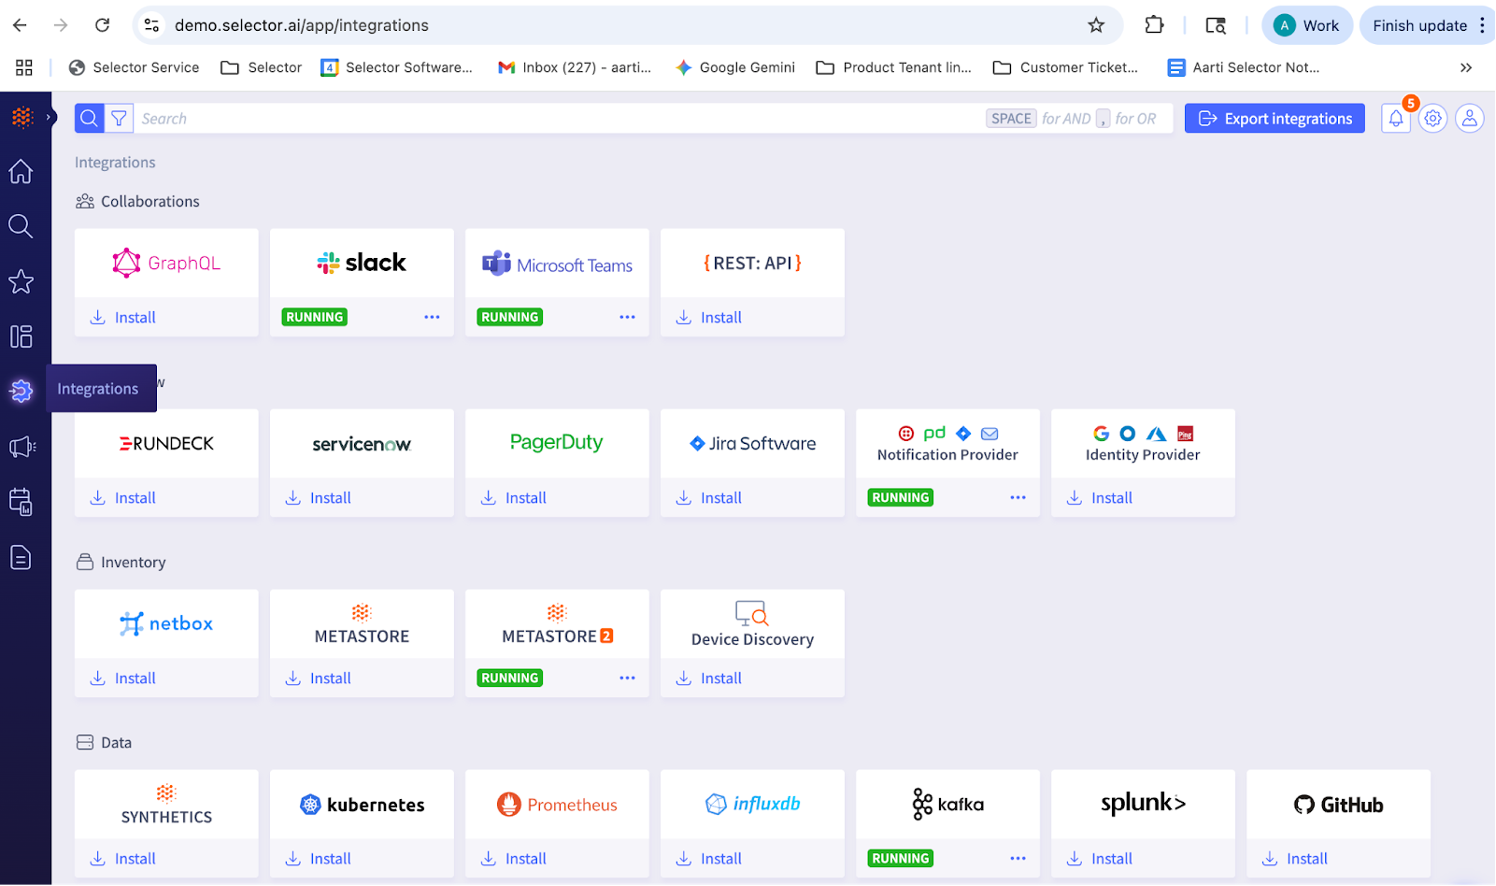
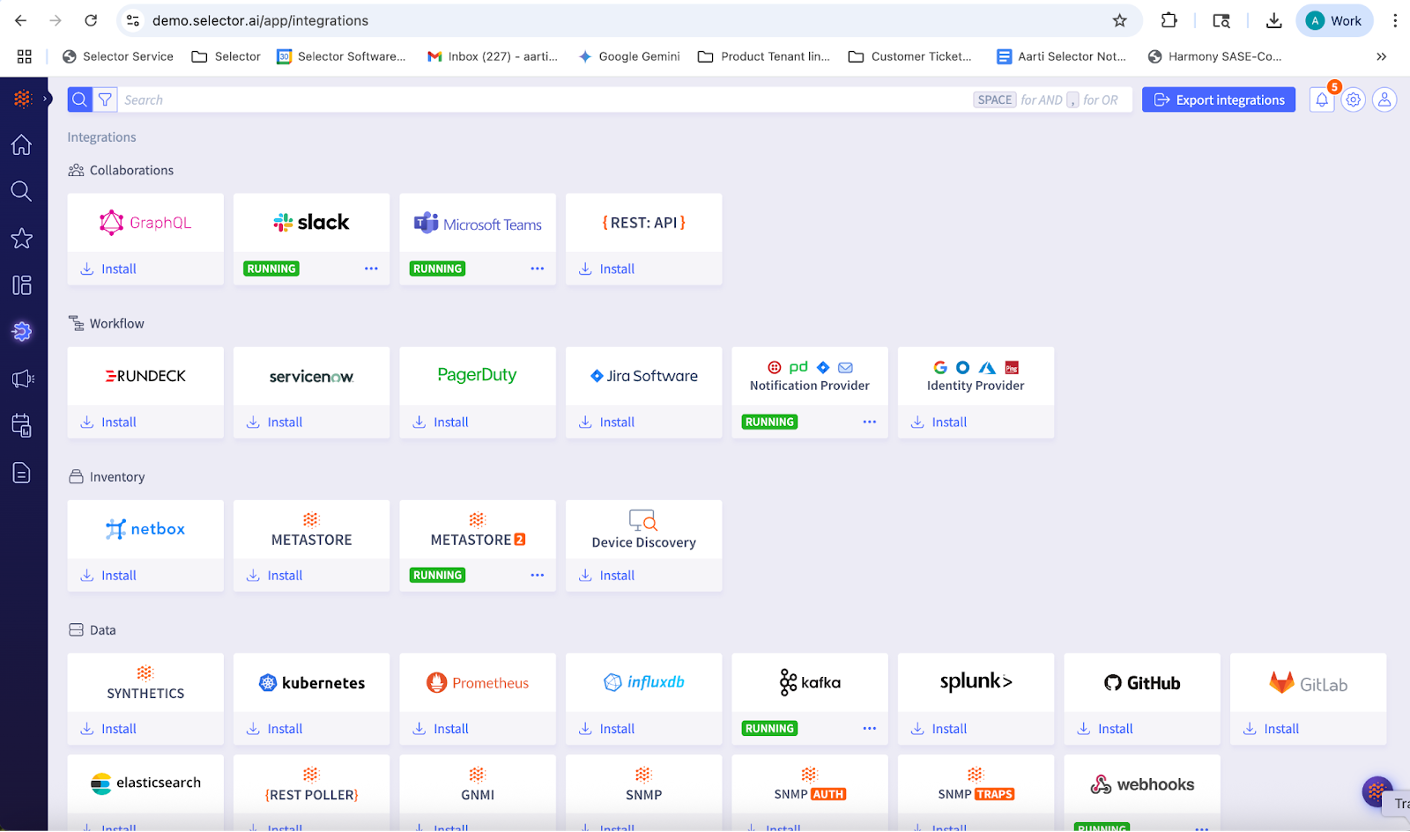
Step 4: Once the previous step is complete, navigate to the Selector integrations dashboard on the Selector S2AP UI to set up Teams integration. Please make sure you have admin access to S2AP.
An example URL is https://<customer-domain>.selector.ai/app/integrations.
Please make sure you use the correct URL corresponding to your S2AP instance.
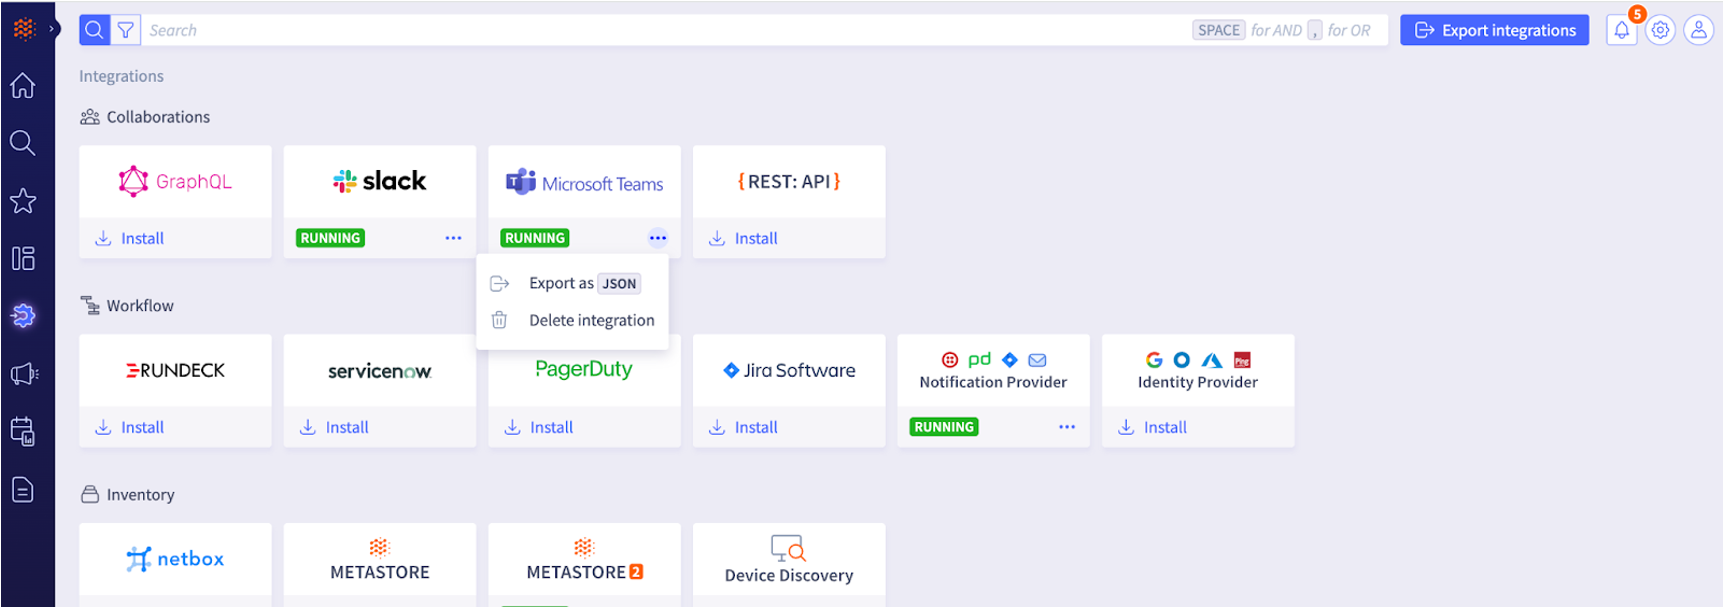
Step 5: Click on install under the Teams integration logo to enable the workflow to add the SelectorAIOps BOT to an MS Teams workspace and an MS Teams channel.
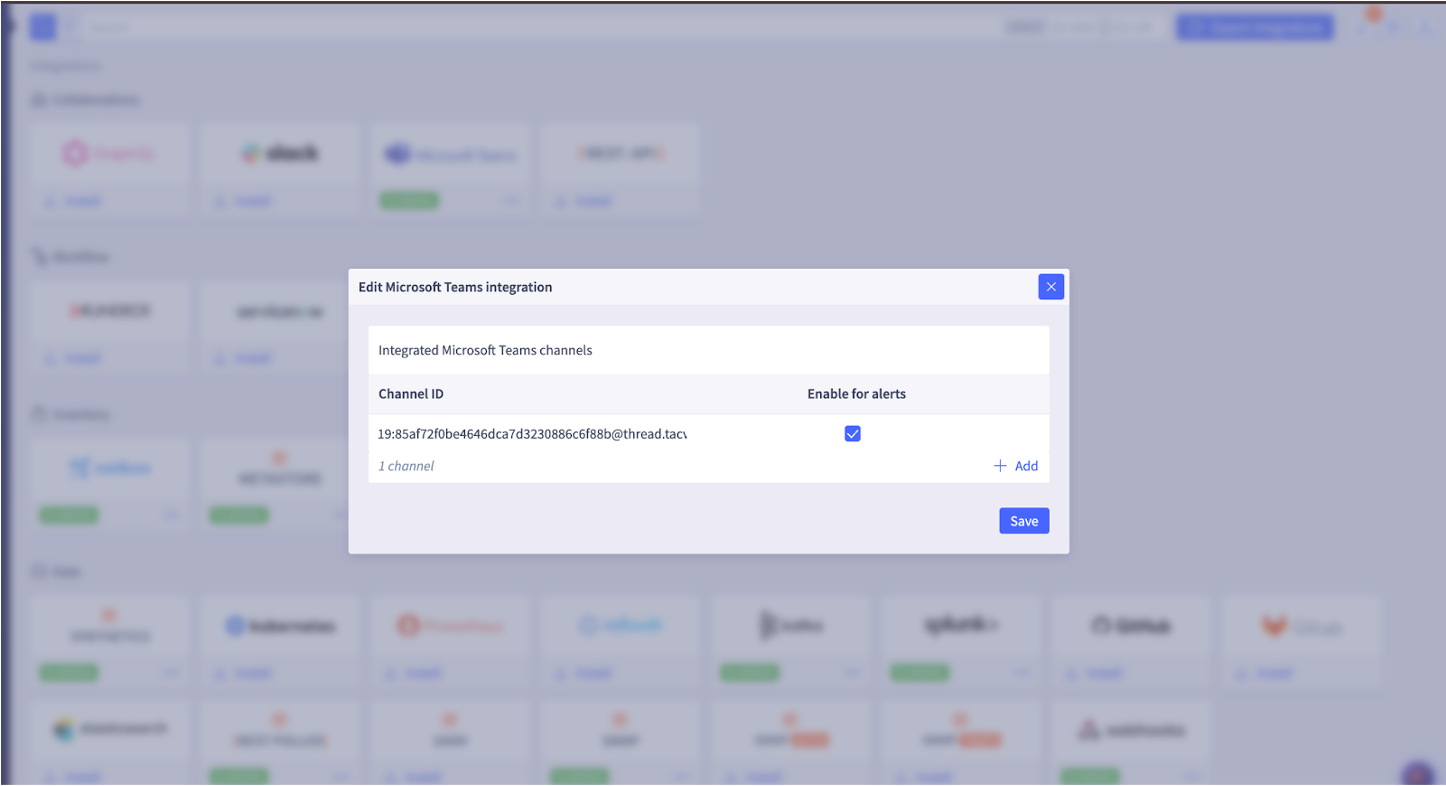
Step 6: In the pop-up window that appears, enter the edited channel ID from Step 3.
If you want to see the alerts in these channels, you should enable alerts in the check box.
You can enable alerts at a later time if you choose. Refer to Step 8 as well.
Click Save.
Step 7: The Microsoft Teams integration should be up and running.
Step 8: If you want to send alerts to Teams channels, go to the Notification provider on the Integrations page, Add a notification provider, and add the edited Teams Channel Id you want to get alerts in. You will need to also provide the correct teams_token and teams_password attributes corresponding to your Teams account.
Note: you can also simply duplicate the auto-created __teams_notif_generic to copy all attributes and update it with the relevant channel IDs.
Then you need to associate the Notification Provider with the corresponding alert rule.
Step 9: Interact with the Selector AIOps App (listed as SelectorAIOps) in your teams channel.
Step 10: Execute commands on the channel to check SelectorAIOps’s response in the Teams channel.
See the Operations section for details.
Step 11: To add additional channels from the same MS Teams workspace, navigate to the Selector teams integration dashboard and click on Add.
Step 12: To connect the SelectorAIOps BOT to a new Microsoft teams instance, please delete the current integration by clicking on Delete Integration and repeat the above steps for the new instance.
Operations
Query service using Microsoft teams
You can use following actions with the SelectorAIOps query service:
- Get a report of metrics over a period of time
- Plot metrics as line graph, bar graph, stacked graph, honeycomb, event graph
This is a list of available commands:
- @SelectorAIOps [query]: Query Selector Analytics
- @SelectorAIOps summon: Display a modal to summon a dashboard/widget in MS Teams
- @SelectorAIOps summon [dashboard/widget name]: Summon a dashboard or widget to Teams
- @SelectorAIOps help: Display help Options
Collaborate Using Microsoft Teams
- Users can share and collaborate with other team members in a teams channel
- Users can view alerts and issues in a teams channel
- Users can query S2AP using natural language queries and see the status of their network and devices in a teams channel
- Users can view topology and dashboard widgets in their teams channel
Support
For support and questions, please contact us or send an email to support@selector.ai
4 - SNMP MIB OID Description
Selector Software SNMP Standard and Vendor-Specific MIB and OIDs
This document provides a list and description of various MIB OIDs Selector platform ingest to derive insights into the operations state of the network. This document covers Standards Based MIBs such as BGP-MIB and MIB-2 as well as various Vendor-Specific (“proprietary”) OIDs that various network vendors support. This document serves as a reference to all MIB OIDs supported by the Selector platform and will be updated periodically to keep it current.
It is critical to note that the Selector platform provides insights into the operational status of the network using these MIB OIDs as one of the data sources. After ingesting the MIB OID data, the Selector platform transforms the OIDs into a Selector Queryables, which is a representation of those MIB OIDs into a more human readable entity. This document also lists the corresponding Selector Queryable associated with those MIB OIDs. As a user of the Selector platform, you will be interacting with these Selector Queryables.
You might notice that some SNMP MIB OIDs do not have a directly corresponding Selector Queryable. This is not a documentation error. Those cases indicate that the Selector platform uses ingested MIB OIDs as one of the data sources to derive other operational insights.
Organization
The Document is structured as follows:
- Standard OIDs
- Vendor-Specific OIDs
Each of these categories contains a MIB Module. Under each MIB Module, there are Table Names.
Each table consists of three columns:
- OID Name - OID: Displays the OID name along with its numerical identifier
- Selector Queryable: Name used for querying the OID in our systems (whenever applicable)
- Description: A detailed explanation of what the OID represents and its functionality.
Table of Contents for Standard OIDs
List of Supported Vendors
List of Supported Vendor MIBs
Standard MIB OIDs
BGP4-MIB
bgpPeerTable
| OID Name | Selector Queryable | Description |
|---|---|---|
| bgpPeerAdminStatus- 1.3.6.1.2.1.15.3.1.3 | bgp_peer_admin_status_raw | The desired state of the BGP connection. A transition from ‘stop’ to ‘start’ will cause the BGP Manual Start Event to be generated. A transition from ‘start’ to ‘stop’ will cause the BGP Manual Stop Event to be generated. This parameter can be used to restart BGP peer connections. Care should be used in providing write access to this object without adequate authentication. |
| bgpPeerConnectRetryInterval-1.3.6.1.2.1.15.3.1.17 | Time interval (in seconds) for the ConnectRetry timer. The suggested value for this timer is 120 seconds. | |
| bgpPeerFsmEstablishedTime-1.3.6.1.2.1.15.3.1.16 | bgp_peer_fsm_established_time_raw | This timer indicates how long (in seconds) this peer has been in the established state or how long since this peer was last in the established state. It is set to zero when a new peer is configured or when the router is booted. |
| bgpPeerFsmEstablishedTransitions- 1.3.6.1.2.1.15.3.1.15 | The total number of times the BGP FSM transitioned into the established state for this peer. | |
| bgpPeerHoldTime- 1.3.6.1.2.1.15.3.1.18 | Time interval (in seconds) for the Hold Timer established with the peer. The value of this object is calculated by this BGP speaker, using the smaller of the values in bgpPeerHoldTimeConfigured and the Hold Time received in the OPEN message. This value must be at least three seconds if it is not zero (0). If the Hold Timer has not been established with the peer this object MUST have a value of zero (0). If the bgpPeerHoldTimeConfigured object has a value of (0), then this object MUST have a value of (0). | |
| bgpPeerHoldTimeConfigured-1.3.6.1.2.1.15.3.1.20 | Time interval (in seconds) for the Hold Time configured for this BGP speaker with this peer. This value is placed in an OPEN message sent to this peer by this BGP speaker, and is compared with the Hold Time field in an OPEN message received from the peer when determining the Hold Time (bgpPeerHoldTime) with the peer. This value must not be less than three seconds if it is not zero (0). If it is zero (0), the Hold Time is NOT to be established with the peer. The suggested value for this timer is 90 seconds. | |
| bgpPeerInTotalMessages- 1.3.6.1.2.1.15.3.1.12 | The total number of messages received from the remote peer on this connection. | |
| bgpPeerInUpdateElapsedTime- 1.3.6.1.2.1.15.3.1.24 | Elapsed time (in seconds) since the last BGP UPDATE message was received from the peer. Each time bgpPeerInUpdates is incremented, the value of this object is set to zero (0). | |
| bgpPeerInUpdates- 1.3.6.1.2.1.15.3.1.10 | bgp_peer_in_updates_raw | The number of BGP UPDATE messages received on this connection. |
| bgpPeerKeepAlive- 1.3.6.1.2.1.15.3.1.19 | Time interval (in seconds) for the KeepAlive timer established with the peer. The value of this object is calculated by this BGP speaker such that, when compared with bgpPeerHoldTime, it has the same proportion that bgpPeerKeepAliveConfigured has, compared with bgpPeerHoldTimeConfigured. If the KeepAlive timer has not been established with the peer, this object MUST have a value of zero (0). If the of bgpPeerKeepAliveConfigured object has a value of (0), then this object MUST have a value of (0). | |
| bgpPeerKeepAliveConfigured- 1.3.6.1.2.1.15.3.1.21 | Time interval (in seconds) for the KeepAlive timer configured for this BGP speaker with this peer. The value of this object will only determine the KEEPALIVE messages’ frequency relative to the value specified in bgpPeerHoldTimeConfigured; the actual time interval for the KEEPALIVE messages is indicated by bgpPeerKeepAlive. A reasonable maximum value for this timer would be one third of that of bgpPeerHoldTimeConfigured. If the value of this object is zero (0), no periodical KEEPALIVE messages are sent to the peer after the BGP connection has been established. The suggested value for this timer is 30 seconds. | |
| bgpPeerLastError- 1.3.6.1.2.1.15.3.1.14 | The last error code and subcode seen by this peer on this connection. If no error has occurred, this field is zero. Otherwise, the first byte of this two byte OCTET STRING contains the error code, and the second byte contains the subcode. | |
| bgpPeerLocalAddr- 1.3.6.1.2.1.15.3.1.5 | The local IP address of this entry’s BGP connection. | |
| bgpPeerMinASOriginationInterval- 1.3.6.1.2.1.15.3.1.22 | Time interval (in seconds) for the MinASOriginationInterval timer. The suggested value for this timer is 15 seconds. | |
| bgpPeerMinRouteAdvertisementInterval- 1.3.6.1.2.1.15.3.1.23 | Time interval (in seconds) for the MinRouteAdvertisementInterval timer. The suggested value for this timer is 30 seconds for EBGP connections and 5 seconds for IBGP connections. | |
| bgpPeerOutTotalMessages- 1.3.6.1.2.1.15.3.1.13 | The total number of messages transmitted to the remote peer on this connection. | |
| bgpPeerOutUpdates- 1.3.6.1.2.1.15.3.1.11 | bgp_peer_out_updates_raw | The number of BGP UPDATE messages transmitted on this connection. |
| bgpPeerRemoteAddr- 1.3.6.1.2.1.15.3.1.7 | The remote IP address of this entry’s BGP peer. | |
| bgpPeerRemoteAs- 1.3.6.1.2.1.15.3.1.9 | The remote autonomous system number received in the BGP OPEN message. | |
| bgpPeerState- 1.3.6.1.2.1.15.3.1.2 | bgp_peer_state_raw | The BGP peer connection state. |
ENTITY-SENSOR-MIB
entPhySensorTable
| OID Name | Selector Queryable | Description |
|---|---|---|
| entPhySensorOperStatus- 1.3.6.1.2.1.99.1.1.1.5 | fru_power_oper_status | The operational status of the sensor. |
| entPhySensorScale- 1.3.6.1.2.1.99.1.1.1.2 | The exponent to apply to values returned by the associated entPhySensorValue object. This object SHOULD be set by the agent during entry creation, and the value SHOULD NOT change during operation. | |
| entPhySensorType- 1.3.6.1.2.1.99.1.1.1.1 | The type of data returned by the associated entPhySensorValue object. This object SHOULD be set by the agent during entry creation, and the value SHOULD NOT change during operation. | |
| entPhySensorValue- 1.3.6.1.2.1.99.1.1.1.4 | netflow_conversation_bytes | The most recent measurement obtained by the agent for this sensor. To correctly interpret the value of this object, the associated entPhySensorType, entPhySensorScale, and entPhySensorPrecision objects must also be examined. |
ENTITY-MIB
entPhysicalTable
| OID Name | Selector Queryable | Description |
|---|---|---|
| entPhysicalDescr- 1.3.6.1.2.1.47.1.1.1.1.2 | A textual description of physical entity. This object should contain a string that identifies the manufacturer’s name for the physical entity and should be set to a distinct value for each version or model of the physical entity. | |
| entPhysicalIndex- 1.3.6.1.2.1.47.1.1.1.1.1 | The index for this entry. | |
| entPhysicalMfgName- 1.3.6.1.2.1.47.1.1.1.1.12 | The name of the manufacturer of this physical component. The preferred value is the manufacturer name string actually printed on the component itself (if present). Note that comparisons between instances of the entPhysicalModelName, entPhysicalFirmwareRev, entPhysicalSoftwareRev, and the entPhysicalSerialNum objects are only meaningful amongst entPhysicalEntries with the same value of entPhysicalMfgName. If the manufacturer name string associated with the physical component is unknown to the agent, then this object will contain a zero-length string. | |
| entPhysicalModelName- 1.3.6.1.2.1.47.1.1.1.1.13 | The vendor-specific model name identifier string associated with this physical component. The preferred value is the customer-visible part number, which may be printed on the component itself. If the model name string associated with the physical component is unknown to the agent, then this object will contain a zero-length string. | |
| entPhysicalName- 1.3.6.1.2.1.47.1.1.1.1.7 | The textual name of the physical entity. The value of this object should be the name of the component as assigned by the local device and should be suitable for use in commands entered at the device’s ‘console’. This might be a text name (e.g., ‘console’) or a simple component number (e.g., port or module number, such as ‘1’), depending on the physical component naming syntax of the device. If there is no local name, or if this object is otherwise not applicable, then this object contains a zero-length string. Note that the value of entPhysicalName for two physical entities will be the same in the event that the console interface does not distinguish between them, e.g., slot-1 and the card in slot-1. | |
| entPhysicalSerialNum- 1.3.6.1.2.1.47.1.1.1.1.11 | The vendor-specific serial number string for the physical entity. The preferred value is the serial number string actually printed on the component itself (if present). On the first instantiation of a physical entity, the value of entPhysicalSerialNum associated with that entity is set to the correct vendor-assigned serial number, if this information is available to the agent. If a serial number is unknown or non-existent, the entPhysicalSerialNum will be set to a zero-length string instead. Note that implementations that can correctly identify the serial numbers of all installed physical entities do not need to provide write access to the entPhysicalSerialNum object. Agents that cannot provide non-volatile storage for the entPhysicalSerialNum strings are not required to implement write access for this object. Not every physical component will have a serial number, or even need one. Physical entities for which the associated value of the entPhysicalIsFRU object is equal to ‘false(2)’ (e.g., the repeater ports within a repeater module) do not need their own unique serial numbers. An agent does not have to provide write access for such entities and may return a zero-length string. If write access is implemented for an instance of entPhysicalSerialNum and a value is written into the instance, the agent must retain the supplied value in the entPhysicalSerialNum instance (associated with the same physical entity) for as long as that entity remains instantiated. This includes instantiations across all re-initializations/reboots of the network management system, including those resulting in a change of the physical entity’s entPhysicalIndex value. |
HOST-RESOURCES-MIB
hrDeviceTable
| OID Name | Selector Queryable | Description |
|---|---|---|
| hrDeviceDescr- 1.3.6.1.2.1.25.3.2.1.3 | A textual description of this device, including the device’s manufacturer and revision, and optionally, its serial number. | |
| hrDeviceType- 1.3.6.1.2.1.25.3.2.1.2 | An indication of the type of device. If this value is `hrDeviceProcessor { hrDeviceTypes 3 }’ then an entry exists in the hrProcessorTable which corresponds to this device. If this value is `hrDeviceNetwork { hrDeviceTypes 4 }’, then an entry exists in the hrNetworkTable which corresponds to this device. If this value is `hrDevicePrinter { hrDeviceTypes 5 }’, then an entry exists in the hrPrinterTable which corresponds to this device. If this value is `hrDeviceDiskStorage { hrDeviceTypes 6 }’, then an entry exists in the hrDiskStorageTable which corresponds to this device. | |
| hrProcessorLoad- 1.3.6.1.2.1.25.3.3.1.2 | cpu_usage, cpu_util_raw | The average, over the last minute, of the percentage of time that this processor was not idle. Implementations may approximate this one minute smoothing period if necessary. |
hrStorageTable
| OID Name | Selector Queryable | Description |
|---|---|---|
| hrStorageDescr- 1.3.6.1.2.1.25.2.3.1.3 | A description of the type and instance of the storage described by this entry. | |
| hrStorageIndex- 1.3.6.1.2.1.25.2.3.1.1 | A unique value for each logical storage area contained by the host. | |
| hrStorageSize- 1.3.6.1.2.1.25.2.3.1.5 | memory_size | The size of the storage represented by this entry, in units of hrStorageAllocationUnits. This object is writable to allow remote configuration of the size of the storage area in those cases where such an operation makes sense and is possible on the underlying system. For example, the amount of main memory allocated to a buffer pool might be modified or the amount of disk space allocated to virtual memory might be modified. |
| hrStorageType- 1.3.6.1.2.1.25.2.3.1.2 | The type of storage represented by this entry. | |
| hrStorageUsed- 1.3.6.1.2.1.25.2.3.1.6 | memory_used | The amount of the storage represented by this entry that is allocated, in units of hrStorageAllocationUnits. |
IF-MIB
ifXTable
| OID Name | Selector Queryable | Description |
|---|---|---|
| ifAdminStatus- 1.3.6.1.2.1.2.2.1.7 | if_admin_status | The desired state of the interface. The testing(3) state indicates that no operational packets can be passed. When a managed system initializes, all interfaces start with ifAdminStatus in the down(2) state. As a result of either explicit management action or per configuration information retained by the managed system, ifAdminStatus is then changed to either the up(1) or testing(3) states (or remains in the down(2) state). |
| ifAlias- 1.3.6.1.2.1.31.1.1.1.18 | This object is an ‘alias’ name for the interface as specified by a network manager, and provides a non-volatile ‘handle’ for the interface. On the first instantiation of an interface, the value of ifAlias associated with that interface is the zero-length string. As and when a value is written into an instance of ifAlias through a network management set operation, then the agent must retain the supplied value in the ifAlias instance associated with the same interface for as long as that interface remains instantiated, including across all re- initializations/reboots of the network management system, including those which result in a change of the interface’s ifIndex value. An example of the value which a network manager might store in this object for a WAN interface is the (Telco’s) circuit number/identifier of the interface. Some agents may support write-access only for interfaces having particular values of ifType. An agent which supports write access to this object is required to keep the value in non-volatile storage, but it may limit the length of new values depending on how much storage is already occupied by the current values for other interfaces. | |
| ifDescr- 1.3.6.1.2.1.2.2.1.2 | A textual string containing information about the interface. This string should include the name of the manufacturer, the product name and the version of the interface hardware/software. | |
| ifHCInOctets- 1.3.6.1.2.1.31.1.1.1.6 | if_in_octets | The total number of octets received on the interface, including framing characters. This object is a 64-bit version of ifInOctets. Discontinuities in the value of this counter can occur at re-initialization of the management system, and at other times as indicated by the value of ifCounterDiscontinuityTime. |
| ifHCOutOctets- 1.3.6.1.2.1.31.1.1.1.10 | if_out_octets | The total number of octets transmitted out of the interface, including framing characters. This object is a 64-bit version of ifOutOctets. Discontinuities in the value of this counter can occur at re-initialization of the management system, and at other times as indicated by the value of ifCounterDiscontinuityTime. |
| ifHighSpeed- 1.3.6.1.2.1.31.1.1.1.15 | if_speed | An estimate of the interface’s current bandwidth in units of 1,000,000 bits per second. If this object reports a value of `n’ then the speed of the interface is somewhere in the range of `n-500,000’ to `n+499,999’. For interfaces which do not vary in bandwidth or for those where no accurate estimation can be made, this object should contain the nominal bandwidth. For a sub-layer which has no concept of bandwidth, this object should be zero. |
| ifInBroadcastPkts- 1.3.6.1.2.1.31.1.1.1.3 | The number of packets, delivered by this sub-layer to a higher (sub-)layer, which were addressed to a broadcast address at this sub-layer. Discontinuities in the value of this counter can occur at re-initialization of the management system, and at other times as indicated by the value of ifCounterDiscontinuityTime. | |
| ifInDiscards- 1.3.6.1.2.1.2.2.1.13 | if_in_discards | The number of inbound packets which were chosen to be discarded even though no errors had been detected to prevent their being deliverable to a higher-layer protocol. One possible reason for discarding such a packet could be to free up buffer space. Discontinuities in the value of this counter can occur at re-initialization of the management system, and at other times as indicated by the value of ifCounterDiscontinuityTime. |
| ifInErrors- 1.3.6.1.2.1.2.2.1.14 | if_in_errors | For packet-oriented interfaces, the number of inbound packets that contained errors preventing them from being deliverable to a higher-layer protocol. For character- oriented or fixed-length interfaces, the number of inbound transmission units that contained errors preventing them from being deliverable to a higher-layer protocol. Discontinuities in the value of this counter can occur at re-initialization of the management system, and at other times as indicated by the value of ifCounterDiscontinuityTime. |
| ifInUnknownProtos- 1.3.6.1.2.1.2.2.1.15 | if_in_unknown_protos | For packet-oriented interfaces, the number of packets received via the interface which were discarded because of an unknown or unsupported protocol. For character-oriented or fixed-length interfaces that support protocol multiplexing the number of transmission units received via the interface which were discarded because of an unknown or unsupported protocol. For any interface that does not support protocol multiplexing, this counter will always be 0. Discontinuities in the value of this counter can occur at re-initialization of the management system, and at other times as indicated by the value of ifCounterDiscontinuityTime. |
| ifIndex- 1.3.6.1.2.1.2.2.1.1 | A unique value, greater than zero, for each interface. It is recommended that values are assigned contiguously starting from 1. The value for each interface sub-layer must remain constant at least from one re-initialization of the entity’s network management system to the next re- initialization. | |
| ifLastChange- 1.3.6.1.2.1.2.2.1.9 | if_lastchange | The value of sysUpTime at the time the interface entered its current operational state. If the current state was entered prior to the last re-initialization of the local network management subsystem, then this object contains a zero value. |
| ifName- 1.3.6.1.2.1.31.1.1.1.1 | The textual name of the interface. The value of this object should be the name of the interface as assigned by the local device and should be suitable for use in commands entered at the device’s `console’. This might be a text name, such as `le0’ or a simple port number, such as `1’, depending on the interface naming syntax of the device. If several entries in the ifTable together represent a single interface as named by the device, then each will have the same value of ifName. Note that for an agent which responds to SNMP queries concerning an interface on some other (proxied) device, then the value of ifName for such an interface is the proxied device’s local name for it. If there is no local name, or this object is otherwise not applicable, then this object contains a zero-length string. | |
| ifOperStatus- 1.3.6.1.2.1.2.2.1.8 | if_oper_status | The current operational state of the interface. The testing(3) state indicates that no operational packets can be passed. If ifAdminStatus is down(2) then ifOperStatus should be down(2). If ifAdminStatus is changed to up(1) then ifOperStatus should change to up(1) if the interface is ready to transmit and receive network traffic; it should change to dormant(5) if the interface is waiting for external actions (such as a serial line waiting for an incoming connection); it should remain in the down(2) state if and only if there is a fault that prevents it from going to the up(1) state; it should remain in the notPresent(6) state if the interface has missing (typically, hardware) components. |
| ifOutDiscards- 1.3.6.1.2.1.2.2.1.19 | if_out_discards | The number of outbound packets which were chosen to be discarded even though no errors had been detected to prevent their being transmitted. One possible reason for discarding such a packet could be to free up buffer space. Discontinuities in the value of this counter can occur at re-initialization of the management system, and at other times as indicated by the value of ifCounterDiscontinuityTime. |
| ifOutErrors- 1.3.6.1.2.1.2.2.1.20 | if_out_errors | For packet-oriented interfaces, the number of outbound packets that could not be transmitted because of errors. For character-oriented or fixed-length interfaces, the number of outbound transmission units that could not be transmitted because of errors. Discontinuities in the value of this counter can occur at re-initialization of the management system, and at other times as indicated by the value of ifCounterDiscontinuityTime. |
ipAddressTable
| OID Name | Selector Queryable | Description |
|---|---|---|
| ipAddressAddr- 1.3.6.1.2.1.4.34.1.2 | The IP address to which this entry’s addressing information pertains. The address type of this object is specified in ipAddressAddrType. Implementors need to be aware that if the size of ipAddressAddr exceeds 116 octets, then OIDS of instances of columns in this row will have more than 128 sub-identifiers and cannot be accessed using SNMPv1, SNMPv2c, or SNMPv3. | |
| ipAddressIfIndex- 1.3.6.1.2.1.4.34.1.3 | The index value that uniquely identifies the interface to which this entry is applicable. The interface identified by a particular value of this index is the same interface as identified by the same value of the IF-MIB’s ifIndex. | |
| ipAddressType- 1.3.6.1.2.1.4.34.1.4 | The type of address. broadcast(3) is not a valid value for IPv6 addresses (RFC 3513). |
LLDP-MIB
lldpRemTable
| OID Name | Selector Queryable | Description |
|---|---|---|
| lldpRemPortId- 1.0.8802.1.1.2.1.4.1.1.7 | The string value used to identify the port component associated with the remote system. | |
| lldpRemSysName- 1.0.8802.1.1.2.1.4.1.1.9 | The string value used to identify the system name of the remote system. |
lldpRemTablesChange
| OID Name | Selector Queryable | Description |
|---|---|---|
| lldpRemIndex- 1.0.8802.1.1.2.1.4.1.1.3 | This object represents an arbitrary local integer value used by this agent to identify a particular connection instance, unique only for the indicated remote system. An agent is encouraged to assign monotonically increasing index values to new entries, starting with one, after each reboot. It is considered unlikely that the lldpRemIndex will wrap between reboots. | |
| lldpRemLocalPortNum- 1.0.8802.1.1.2.1.4.1.1.2 | The index value used to identify the port component (contained in the local chassis with the LLDP agent) associated with this entry. The lldpRemLocalPortNum identifies the port on which the remote system information is received. The value of this object is used as a port index to the lldpRemTable. |
OSPF-MIB
ospfAreaTable
| OID Name | Selector Queryable | Description |
|---|---|---|
| ospfAreaBdrRtrCount- 1.3.6.1.2.1.14.2.1.5 | ospf_area_bdr_rtr_count_raw | The total number of Area Border Routers reachable within this area. This is initially zero and is calculated in each Shortest Path First (SPF) pass. |
| ospfAreaId- 1.3.6.1.2.1.14.2.1.1 | A 32-bit integer uniquely identifying an area. Area ID 0.0.0.0 is used for the OSPF backbone. | |
| ospfAreaLsaCksumSum- 1.3.6.1.2.1.14.2.1.8 | The 32-bit sum of the link state advertisements’ LS checksums contained in this area’s link state database. This sum excludes external (LS type-5) link state advertisements. The sum can be used to determine if there has been a change in a router’s link state database, and to compare the link state database of two routers. The value should be treated as unsigned when comparing two sums of checksums. | |
| ospfAreaLsaCount- 1.3.6.1.2.1.14.2.1.7 | ospf_area_lsa_count_raw | The total number of link state advertisements in this area’s link state database, excluding AS-external LSAs. |
| ospfAreaStatus- 1.3.6.1.2.1.14.2.1.10 | This object permits management of the table by facilitating actions such as row creation, construction, and destruction. The value of this object has no effect on whether other objects in this conceptual row can be modified. | |
| ospfAreaSummary- 1.3.6.1.2.1.14.2.1.9 | The variable ospfAreaSummary controls the import of summary LSAs into stub and NSSA areas. It has no effect on other areas. If it is noAreaSummary, the router will not originate summary LSAs into the stub or NSSA area. It will rely entirely on its default route. If it is sendAreaSummary, the router will both summarize and propagate summary LSAs. | |
| ospfAsBdrRtrCount- 1.3.6.1.2.1.14.2.1.6 | ospf_as_bdr_rtr_count_raw | The total number of Autonomous System Border Routers reachable within this area. This is initially zero and is calculated in each SPF pass. |
| ospfAuthType- 1.3.6.1.2.1.14.2.1.2 | The authentication type specified for an area. | |
| ospfImportAsExtern- 1.3.6.1.2.1.14.2.1.3 | Indicates if an area is a stub area, NSSA, or standard area. Type-5 AS-external LSAs and type-11 Opaque LSAs are not imported into stub areas or NSSAs. NSSAs import AS-external data as type-7 LSAs | |
| ospfSpfRuns- 1.3.6.1.2.1.14.2.1.4 | ospf_spf_runs_raw | The number of times that the intra-area route table has been calculated using this area’s link state database. This is typically done using Dijkstra’s algorithm. Discontinuities in the value of this counter can occur at re-initialization of the management system, and at other times as indicated by the value of ospfDiscontinuityTime. |
ospfGeneralGroup
| OID Name | Selector Queryable | Description |
|---|---|---|
| ospfASBdrRtrStatus- 1.3.6.1.2.1.14.1.5 | A flag to note whether this router is configured as an Autonomous System Border Router. This object is persistent and when written the entity SHOULD save the change to non-volatile storage. | |
| ospfAdminStat- 1.3.6.1.2.1.14.1.2 | ospf_admin_stat_raw | The administrative status of OSPF in the router. The value ’enabled’ denotes that the OSPF Process is active on at least one interface; ‘disabled’ disables it on all interfaces. This object is persistent and when written the entity SHOULD save the change to non-volatile storage. |
| ospfAreaBdrRtrStatus- 1.3.6.1.2.1.14.1.4 | A flag to note whether this router is an Area Border Router. | |
| ospfDemandExtensions- 1.3.6.1.2.1.14.1.14 | The router’s support for demand routing. This object is persistent and when written the entity SHOULD save the change to non-volatile storage. | |
| ospfExitOverflowInterval- 1.3.6.1.2.1.14.1.13 | The number of seconds that, after entering OverflowState, a router will attempt to leave OverflowState. This allows the router to again originate non-default AS-external LSAs. When set to 0, the router will not leave overflow state until restarted. This object is persistent and when written the entity SHOULD save the change to non-volatile storage. | |
| ospfExtLsdbLimit- 1.3.6.1.2.1.14.1.11 | The maximum number of non-default AS-external LSAs entries that can be stored in the link state database. If the value is -1, then there is no limit. When the number of non-default AS-external LSAs in a router’s link state database reaches ospfExtLsdbLimit, the router enters overflow state. The router never holds more than ospfExtLsdbLimit non-default AS-external LSAs in its database. OspfExtLsdbLimit MUST be set identically in all routers attached to the OSPF backbone and/or any regular OSPF area (i.e., OSPF stub areas and NSSAs are excluded). This object is persistent and when written the entity SHOULD save the change to non-volatile storage. | |
| ospfExternLsaCksumSum- 1.3.6.1.2.1.14.1.7 | The 32-bit sum of the LS checksums of the external link state advertisements contained in the link state database. This sum can be used to determine if there has been a change in a router’s link state database and to compare the link state database of two routers. The value should be treated as unsigned when comparing two sums of checksums. | |
| ospfExternLsaCount- 1.3.6.1.2.1.14.1.6 | ospf_extern_lsa_count_raw | The number of external (LS type-5) link state advertisements in the link state database. |
| ospfMulticastExtensions- 1.3.6.1.2.1.14.1.12 | A bit mask indicating whether the router is forwarding IP multicast (Class D) datagrams based on the algorithms defined in the multicast extensions to OSPF. Bit 0, if set, indicates that the router can forward IP multicast datagrams in the router’s directly attached areas (called intra-area multicast routing). Bit 1, if set, indicates that the router can forward IP multicast datagrams between OSPF areas (called inter-area multicast routing). Bit 2, if set, indicates that the router can forward IP multicast datagrams between Autonomous Systems (called inter-AS multicast routing). Only certain combinations of bit settings are allowed, namely: 0 (no multicast forwarding is enabled), 1 (intra-area multicasting only), 3 (intra-area and inter-area multicasting), 5 (intra-area and inter-AS multicasting), and 7 (multicasting everywhere). By default, no multicast forwarding is enabled. This object is persistent and when written the entity SHOULD save the change to non-volatile storage. | |
| ospfOriginateNewLsas- 1.3.6.1.2.1.14.1.9 | ospf_originate_new_lsas_raw | The number of new link state advertisements that have been originated. This number is incremented each time the router originates a new LSA. Discontinuities in the value of this counter can occur at re-initialization of the management system, and at other times as indicated by the value of ospfDiscontinuityTime. |
| ospfRouterId- 1.3.6.1.2.1.14.1.1 | A 32-bit integer uniquely identifying the router in the Autonomous System. By convention, to ensure uniqueness, this should default to the value of one of the router’s IP interface addresses. This object is persistent and when written the entity SHOULD save the change to non-volatile storage. | |
| ospfRxNewLsas- 1.3.6.1.2.1.14.1.10 | ospf_rx_new_lsas_raw | The number of link state advertisements received that are determined to be new instantiations. This number does not include newer instantiations of self-originated link state advertisements. Discontinuities in the value of this counter can occur at re-initialization of the management system, and at other times as indicated by the value of ospfDiscontinuityTime. |
| ospfTOSSupport- 1.3.6.1.2.1.14.1.8 | The router’s support for type-of-service routing. This object is persistent and when written the entity SHOULD save the change to non-volatile storage. | |
| ospfVersionNumber- 1.3.6.1.2.1.14.1.3 | The current version number of the OSPF protocol is 2. |
ospfIfTable
| OID Name | Selector Queryable | Description |
|---|---|---|
| ospfIfAdminStat- 1.3.6.1.2.1.14.7.1.5 | ospf_if_admin_stat_raw | The OSPF interface’s administrative status. The value formed on the interface, and the interface will be advertised as an internal route to some area. The value ‘disabled’ denotes that the interface is external to OSPF. |
| ospfIfAreaId- 1.3.6.1.2.1.14.7.1.3 | A 32-bit integer uniquely identifying the area to which the interface connects. Area ID 0.0.0.0 is used for the OSPF backbone. | |
| ospfIfAuthKey- 1.3.6.1.2.1.14.7.1.16 | The cleartext password used as an OSPF authentication key when simplePassword security is enabled. This object does not access any OSPF cryptogaphic (e.g., MD5) authentication key under any circumstance. If the key length is shorter than 8 octets, the agent will left adjust and zero fill to 8 octets. Unauthenticated interfaces need no authentication key, and simple password authentication cannot use a key of more than 8 octets. Note that the use of simplePassword authentication is NOT recommended when there is concern regarding attack upon the OSPF system. SimplePassword authentication is only sufficient to protect against accidental misconfigurations because it re-uses cleartext passwords [RFC1704]. When read, ospfIfAuthKey always returns an octet string of length zero. | |
| ospfIfAuthType- 1.3.6.1.2.1.14.7.1.20 | The authentication type specified for an interface. Note that this object can be used to engage in significant attacks against an OSPF router. | |
| ospfIfBackupDesignatedRouter- 1.3.6.1.2.1.14.7.1.14 | The IP address of the backup designated router. | |
| ospfIfDemand- 1.3.6.1.2.1.14.7.1.19 | Indicates whether Demand OSPF procedures (hello suppression to FULL neighbors and setting the DoNotAge flag on propagated LSAs) should be performed on this interface. | |
| ospfIfDesignatedRouter- 1.3.6.1.2.1.14.7.1.13 | The IP address of the designated router. | |
| ospfIfEvents- 1.3.6.1.2.1.14.7.1.15 | ospf_if_events_raw | The number of times this OSPF interface has changed its state or an error has occurred. Discontinuities in the value of this counter can occur at re-initialization of the management system, and at other times as indicated by the value of ospfDiscontinuityTime. |
| ospfIfHelloInterval- 1.3.6.1.2.1.14.7.1.9 | The length of time, in seconds, between the Hello packets that the router sends on the interface. This value must be the same for all routers attached to a common network. | |
| ospfIfIpAddress- 1.3.6.1.2.1.14.7.1.1 | The IP address of this OSPF interface. | |
| ospfIfLsaCount- 1.3.6.1.2.1.14.7.1.21 | The total number of link-local link state advertisements in this interface’s link-local link state database. | |
| ospfIfMulticastForwarding- 1.3.6.1.2.1.14.7.1.18 | The way multicasts should be forwarded on this interface: not forwarded, forwarded as data link multicasts, or forwarded as data link unicasts. Data link multicasting is not meaningful on point-to-point and NBMA interfaces, and setting ospfMulticastForwarding to 0 effectively disables all multicast forwarding. | |
| ospfIfPollInterval- 1.3.6.1.2.1.14.7.1.11 | The larger time interval, in seconds, between the Hello packets sent to an inactive non-broadcast multi-access neighbor. | |
| ospfIfRetransInterval- 1.3.6.1.2.1.14.7.1.8 | The number of seconds between link state advertisement retransmissions, for adjacencies belonging to this interface. This value is also used when retransmitting database description and Link State request packets. Note that minimal value SHOULD be 1 second. | |
| ospfIfRtrDeadInterval- 1.3.6.1.2.1.14.7.1.10 | The number of seconds that a router’s Hello packets have not been seen before its neighbors declare the router down. This should be some multiple of the Hello interval. This value must be the same for all routers attached to a common network. | |
| ospfIfRtrPriority- 1.3.6.1.2.1.14.7.1.6 | The priority of this interface. Used in multi-access networks, this field is used in the designated router election algorithm. The value 0 signifies that the router is not eligible to become the designated router on this particular network. In the event of a tie in this value, routers will use their Router ID as a tie breaker. | |
| ospfIfState- 1.3.6.1.2.1.14.7.1.12 | ospf_if_state_raw | The OSPF Interface State. |
| ospfIfStatus- 1.3.6.1.2.1.14.7.1.17 | ospf_if_status_raw | This object permits management of the table by facilitating actions such as row creation, construction, and destruction. The value of this object has no effect on whether other objects in this conceptual row can be modified. |
| ospfIfTransitDelay- 1.3.6.1.2.1.14.7.1.7 | The estimated number of seconds it takes to transmit a link state update packet over this interface. Note that the minimal value SHOULD be 1 second. | |
| ospfIfType- 1.3.6.1.2.1.14.7.1.4 | The OSPF interface type. By way of a default, this field may be intuited from the corresponding value of ifType. Broadcast LANs, such as Ethernet and IEEE 802.5, take the value ‘broadcast’, X.25 and similar technologies take the value ’nbma’, and links that are definitively point to point take the value ‘pointToPoint’. |
ospfNbrTable
| OID Name | Selector Queryable | Description |
|---|---|---|
| ospfNbmaNbrPermanence- 1.3.6.1.2.1.14.10.1.10 | This variable displays the status of the entry; ‘dynamic’ and ‘permanent’ refer to how the neighbor became known. | |
| ospfNbmaNbrStatus- 1.3.6.1.2.1.14.10.1.9 | ospf_nbma_nbr_status_raw | This object permits management of the table by facilitating actions such as row creation, construction, and destruction. The value of this object has no effect on whether other objects in this conceptual row can be modified. |
| ospfNbrEvents- 1.3.6.1.2.1.14.10.1.7 | ospf_nbr_events_raw | The number of times this neighbor relationship has changed state or an error has occurred. Discontinuities in the value of this counter can occur at re-initialization of the management system, and at other times as indicated by the value of ospfDiscontinuityTime. |
| ospfNbrHelloSuppressed- 1.3.6.1.2.1.14.10.1.11 | Indicates whether Hellos are being suppressed to the neighbor. | |
| ospfNbrIpAddr- 1.3.6.1.2.1.14.10.1.1 | The IP address this neighbor is using in its IP source address. Note that, on addressless links, this will not be 0.0.0.0 but the address of another of the neighbor’s interfaces. | |
| ospfNbrLsRetransQLen- 1.3.6.1.2.1.14.10.1.8 | ospf_nbr_ls_retrans_q_len_raw | The current length of the retransmission queue. |
| ospfNbrOptions- 1.3.6.1.2.1.14.10.1.4 | A bit mask corresponding to the neighbor’s options field. Bit 0, if set, indicates that the system will operate on Type of Service metrics other than TOS 0. If zero, the neighbor will ignore all metrics except the TOS 0 metric. Bit 1, if set, indicates that the associated area accepts and operates on external information; if zero, it is a stub area. Bit 2, if set, indicates that the system is capable of routing IP multicast datagrams, that is that it implements the multicast extensions to OSPF. Bit 3, if set, indicates that the associated area is an NSSA. These areas are capable of carrying type-7 external advertisements, which are translated into type-5 external advertisements at NSSA borders. | |
| ospfNbrPriority- 1.3.6.1.2.1.14.10.1.5 | The priority of this neighbor in the designated router election algorithm. The value 0 signifies that the neighbor is not eligible to become the designated router on this particular network. | |
| ospfNbrRtrId- 1.3.6.1.2.1.14.10.1.3 | A 32-bit integer (represented as a type IpAddress) uniquely identifying the neighboring router in the Autonomous System. | |
| ospfNbrState- 1.3.6.1.2.1.14.10.1.6 | ospf_nbr_state_raw; ospf_nbma_nbr_status_raw | The state of the relationship with this neighbor. |
SNMPv2-MIB
system
| OID Name | Selector Queryable | Description |
|---|---|---|
| sysName- 1.3.6.1.2.1.1.5 | An administratively-assigned name for this managed node. By convention, this is the node’s fully-qualified domain name. If the name is unknown, the value is the zero-length string. | |
| sysUpTime- 1.3.6.1.2.1.1.3 | sys_uptime | The time (in hundredths of a second) since the network management portion of the system was last re-initialized. |
Cisco Proprietary OIDs
CISCO-EIGRP-MIB
cEigrpInterfaceTable
| OID Name | Selector Queryable | Description |
|---|---|---|
| cEigrpPeerAddr- 1.3.6.1.4.1.9.9.449.1.4.1.1.3 | The source IP address used by the peer to establish the EIGRP adjacency with this router. The format is governed by object cEigrpPeerAddrType. | |
| cEigrpPeerCount- 1.3.6.1.4.1.9.9.449.1.5.1.1.3 | cisco_eigrp_peer_count | The number of EIGRP adjacencies currently formed with peers reached through this interface. |
| cEigrpPeerIfIndex- 1.3.6.1.4.1.9.9.449.1.4.1.1.4 | The ifIndex of the interface on this router through which this peer can be reached. | |
| cEigrpUpTime- 1.3.6.1.4.1.9.9.449.1.4.1.1.6 | cisco_eigrp_peer_uptime | The elapsed time since the EIGRP adjacency was first established with the peer. |
cEigrpTraffStatsTable
| OID Name | Selector Queryable | Description |
|---|---|---|
| cEigrpInputQDrops- 1.3.6.1.4.1.9.9.449.1.2.1.1.14 | cisco_eigrp_pkt_drop_input_q | The number of EIGRP packets dropped from the input queue due to it being full within the AS. |
| cEigrpNbrCount- 1.3.6.1.4.1.9.9.449.1.2.1.1.2 | cisco_eigrp_nbr_count | The total number of live EIGRP neighbors formed on all interfaces whose IP addresses fall under networks configured in the EIGRP AS. |
| cEigrpTopoRoutes- 1.3.6.1.4.1.9.9.449.1.2.1.1.19 | cisco_eigrp_topo_routes_count | The total number of EIGRP derived routes currently existing in the topology table for the AS. |
CISCO-HSRP-EXT-MIB
cHsrpExtIfTrackedTable
| OID Name | Selector Queryable | Description |
|---|---|---|
| cHsrpExtIfTracked- 1.3.6.1.4.1.9.9.107.1.1.1.1.1 | The ifIndex value of the tracked interface. | |
| cHsrpExtIfTrackedPriority- 1.3.6.1.4.1.9.9.107.1.1.1.1.2 | Priority of the tracked interface for the corresponding { ifIndex, cHsrpGrpNumber } pair. In the range of 0 to 255, 0 is the lowest priority and 255 is the highest. When a tracked interface is unavailable, the cHsrpGrpPriority of the router is decreased by the value of this object instance (If the cHsrpGrpPriority is less than the cHsrpExtIfTrackedPriority, then the HSRP priority becomes 0). This allows a standby router to be configured with a priority such that if the currently active router’s priority is lowered because the tracked interface goes down, the standby router can takeover. |
cHsrpExtSecAddrTable
| OID Name | Selector Queryable | Description |
|---|---|---|
| cHsrpExtSecAddrAddress- 1.3.6.1.4.1.9.9.107.1.1.2.1.1 | A secondary IpAddress for the {ifIndex, cHsrpGrpNumber} pair. As explained in the DESCRIPTION for cHsrpExtSecAddrEntry, a primary address must exist before a secondary address for the same {ifIndex, cHsrpGrpNumber} pair can be created. | |
| cHsrpExtSecAddrRowStatus- 1.3.6.1.4.1.9.9.107.1.1.2.1.2 | The control that allows modification, creation, and deletion of entries. For detailed rules see the DESCRIPTION for cHsrpExtSecAddrEntry. |
CISCO-CDP-MIB
mib
| OID Name | Selector Queryable | Description |
|---|---|---|
| cdpCacheDeviceId- 1.3.6.1.4.1.9.9.23.1.2.1.1.6 | The Device-ID string as reported in the most recent CDP message. The zero-length string indicates no Device-ID field (TLV) was reported in the most recent CDP message. | |
| cdpCacheDevicePort- 1.3.6.1.4.1.9.9.23.1.2.1.1.7 | The Port-ID string as reported in the most recent CDP message. This will typically be the value of the ifName object (e.g., ‘Ethernet0’). The zero-length string indicates no Port-ID field (TLV) was reported in the most recent CDP message. |
CISCO-HSRP-MIB
cHsrpGrpTable
| OID Name | Selector Queryable | Description |
|---|---|---|
| cHsrpGrpActiveRouter- 1.3.6.1.4.1.9.9.106.1.2.1.1.13 | Ip Address of the currently active router for this group. | |
| cHsrpGrpNumber- 1.3.6.1.4.1.9.9.106.1.2.1.1.1 | This object along with the ifIndex of a particular interface uniquely identifies an HSRP group. Group numbers 0,1 and 2 are the only valid group numbers for TokenRing interfaces. For other media types, numbers range from 0 to 255. Each interface has its own set of group numbers. There’s no relationship between the groups configured on different interfaces. Using a group number on one interface doesn’t preclude using the same group number on a different interface. For example, there can be a group 1 on an Ethernet and a group 1 on Token Ring. More details can be found from RFC 2281. | |
| cHsrpGrpPreempt- 1.3.6.1.4.1.9.9.106.1.2.1.1.4 | This object, if TRUE, indicates that the current router should attempt to overthrow a lower priority active router and attempt to become the active router. If this object is FALSE, the router will become the active router only if there is no such router (or if an active router fails). | |
| cHsrpGrpPriority- 1.3.6.1.4.1.9.9.106.1.2.1.1.3 | The cHsrpGrpPriority helps to select the active and the standby routers. The router with the highest priority is selected as the active router. In the priority range of 0 to 255, 0 is the lowest priority and 255 is the highest priority. If two (or more) routers in a group have the same priority, the one with the highest ip address of the interface is the active router. When the active router fails to send a Hello message within a configurable period of time, the standby router with the highest priority becomes the active router. A router with highest priority will only attempt to overthrow a lower priority active router if it is configured to preempt. But, if there is more than one router which is not active, the highest priority non-active router becomes the standby router. | |
| cHsrpGrpStandbyRouter- 1.3.6.1.4.1.9.9.106.1.2.1.1.14 | Ip Address of the currently standby router for this group. | |
| cHsrpGrpStandbyState- 1.3.6.1.4.1.9.9.106.1.2.1.1.15 | cisco_hspr_group_state | The current HSRP state of this group on this interface. |
| cHsrpGrpVirtualIpAddr- 1.3.6.1.4.1.9.9.106.1.2.1.1.11 | This is the primary virtual IP address used by this group. If this address is configured (i.e a non zero ip address), this value is used. Otherwise, the agent will attempt to discover the virtual address through a discovery process (which scans the hello messages). | |
| cHsrpGrpVirtualMacAddr- 1.3.6.1.4.1.9.9.106.1.2.1.1.16 | Mac Addresses used are as specified in RFC 2281. For ethernet and fddi interfaces, a MAC address will be in the range 00:00:0c:07:ac:00 through 00:00:0c:07:ac:ff. The last octet is the hexadecimal equivalent of cHsrpGrpNumber (0-255). Some Ethernet and FDDI interfaces allow a unicast MAC address for each HSRP group. Certain Ethernet chipsets(LANCE Ethernet, VGANYLAN and QUICC Ethernet) only support a single Unicast Mac Address. In this case, only one HSRP group is allowed. For TokenRing interfaces, the following three MAC addresses are permitted (functional addresses): C0:00:00:01:00:00 C0:00:00:02:00:00 C0:00:00:04:00:00. |
CISCO-VPC-MIB
cVpcRoleTable
| OID Name | Selector Queryable | Description |
|---|---|---|
| cVpcLocalOperMacAddress- 1.3.6.1.4.1.9.9.807.1.2.1.1.6 | This object indicates VPC local system operational MAC address. | |
| cVpcRoleDomainID- 1.3.6.1.4.1.9.9.807.1.2.1.1.1 | An arbitrary value to uniquely identify the VPC management domain on the local system. Value zero indicates there is no VPC management domain being configured for this device. | |
| cVpcRoleStatus- 1.3.6.1.4.1.9.9.807.1.2.1.1.2 | This object indicates the VPC role status of the peer device. primarySecondary(1) : primary, and operational secondary. primary(2) : primary, and operational primary. secondaryPrimary(3) : secondary, and operational primary. secondary(4) : secondary, and operational secondary. noneEstabished(5) : none peer device. | |
| cVpcSystemAdminMacAddress- 1.3.6.1.4.1.9.9.807.1.2.1.1.4 | This object specifies VPC system MAC address. |
cVpcStatusHostLinkTable
| OID Name | Selector Queryable | Description |
|---|---|---|
| cVpcStatusHostLinkIfIndex- 1.3.6.1.4.1.9.9.807.1.4.2.1.3 | The value of the ifIndex corresponding to a host-link interface. | |
| cVpcStatusHostLinkStatus- 1.3.6.1.4.1.9.9.807.1.4.2.1.4 | cisco_vpc_hostlink_status | This object indicates the current status of VPC host-link. down(1) : Host link is down. downStar(2) : Local host link is down, forwarding via vPC peer-link. up(3) : Host link is up. |
| cVpcStatusHostLinkVpcID- 1.3.6.1.4.1.9.9.807.1.4.2.1.2 | An arbitrary value to uniquely identify a VPC link between the host and the switch for a given VPC management domain. |
cVpcStatusPeerKeepAliveTable
| OID Name | Selector Queryable | Description |
|---|---|---|
| cVpcPeerKeepAliveDomainID- .1.3.6.1.4.1.9.9.807.1.1.2.1.1 | An arbitrary value to uniquely identify the VPC management domain on the local system. Value zero indicates there is no VPC management domain being configured for this device. | |
| cVpcPeerKeepAliveMsgRcvrStatus- 1.3.6.1.4.1.9.9.807.1.1.2.1.7 | This object indicates VPC peer keep-alive message receiving status. | |
| cVpcPeerKeepAliveMsgReceiveInterface- 1.3.6.1.4.1.9.9.807.1.1.2.1.9 | This object indicates the ifIndex of interface of VPC peer keep-alive message last received. | |
| cVpcPeerKeepAliveMsgSendInterface- 1.3.6.1.4.1.9.9.807.1.1.2.1.6 | This object indicates the ifIndex of interface of VPC peer keep-alive message sent on. | |
| cVpcPeerKeepAliveStatus- 1.3.6.1.4.1.9.9.807.1.1.2.1.2 | cisco_vpc_peer_keep_alive_status_all, cisco_vpc_peer_keep_alive_status_rcvr | This object indicates VPC peer keep-alive status. disabled(1) : Peer-keepalive is disabled. alive(2) : Peer-keepalive is alive. peerUnreachable(3) : Peer is unreachable through Peer-keepalive link. aliveButDomainIdDismatch(4) : Peer-keepalive is alive, but VPC domain doesn’t match with each other. suspendedAsISSU(5) : Peer-keepalive is suspended during ISSU. suspendedAsDestIPUnreachable(6) : Peer-keepalive is suspended since destination ip is unreachable. suspendedAsVRFUnusable(7) : Peer-keepalive is suspended since the current VRF is unusable. misconfigured(8) : Misconfigure Peer-keepalive feature. |
| cVpcPeerKeepAliveTime- 1.3.6.1.4.1.9.9.807.1.1.2.1.3 | cisco_vpc_peer_alive_time_all, cisco_vpc_peer_alive_time_rcvr | This object indicates the time (in msec) since the peer became alive. It will hold value 0 if peer-keepalive never becomes alive. |
CISCO-BGP4-MIB
cbgpPeer2Table
| OID Name | Selector Queryable | Description |
|---|---|---|
| cbgpPeer2AdminStatus- 1.3.6.1.4.1.9.9.187.1.2.5.1.4 | bgp_peer_admin_status_raw | The desired state of the BGP connection. A transition from ‘stop’ to ‘start’ will cause the BGP Manual Start Event to be generated. A transition from ‘start’ to ‘stop’ will cause the BGP Manual Stop Event to be generated. This parameter can be used to restart BGP peer connections. Care should be used in providing write access to this object without adequate authentication. |
| cbgpPeer2FsmEstablishedTime- 1.3.6.1.4.1.9.9.187.1.2.5.1.19 | bgp_peer_fsm_established_time_raw | This timer indicates how long (in seconds) this peer has been in the established state or how long since this peer was last in the established state. It is set to zero when a new peer is configured or when the router is booted. |
| cbgpPeer2InUpdates- 1.3.6.1.4.1.9.9.187.1.2.5.1.13 | bgp_peer_in_updates_raw | The number of BGP UPDATE messages received on this connection. |
| cbgpPeer2LocalAddr- 1.3.6.1.4.1.9.9.187.1.2.5.1.6 | The local IP address of this entry’s BGP connection. | |
| cbgpPeer2LocalAs- 1.3.6.1.4.1.9.9.187.1.2.5.1.8 | The local AS number for this session. | |
| cbgpPeer2OutUpdates- 1.3.6.1.4.1.9.9.187.1.2.5.1.14 | bgp_peer_out_updates_raw | The number of BGP UPDATE messages transmitted on this connection. |
| cbgpPeer2RemoteAddr- 1.3.6.1.4.1.9.9.187.1.2.5.1.2 | The remote IP address of this entry’s BGP peer. | |
| cbgpPeer2RemoteAs- 1.3.6.1.4.1.9.9.187.1.2.5.1.11 | The remote autonomous system number received in the BGP OPEN message. | |
| cbgpPeer2RemotePort- 1.3.6.1.4.1.9.9.187.1.2.5.1.10 | The remote port for the TCP connection between the BGP peers. Note that the objects cbgpPeer2LocalAddr, cbgpPeer2LocalPort, cbgpPeer2RemoteAddr, and cbgpPeer2RemotePort provide the appropriate reference to the standard MIB TCP connection table. | |
| cbgpPeer2State- 1.3.6.1.4.1.9.9.187.1.2.5.1.3 | bgp_peer_state_raw | The BGP peer connection state. |
CISCO-ENTITY-FRU-CONTROL-MIB
cefcFanTrayStatusTable
| OID Name | Selector Queryable | Description |
|---|---|---|
| cefcFanTrayOperStatus- 1.3.6.1.4.1.9.9.117.1.4.1.1.1 | fan_tray_oper_status | The operational state of the fan or fan tray. unknown(1) - unknown. up(2) - powered on. down(3) - powered down. warning(4) - partial failure, needs replacement as soon as possible. |
cefcFruPowerStatusTable
| OID Name | Selector Queryable | Description |
|---|---|---|
| cefcFRUPowerOperStatus- 1.3.6.1.4.1.9.9.117.1.1.2.1.2 | fru_power_oper_status | Operational FRU power state. |
CISCO-ETHERNET-FABRIC-EXTENDER-MIB
cefexBindingTable
| OID Name | Selector Queryable | Description |
|---|---|---|
| cefexBindingCreationTime- 1.3.6.1.4.1.9.9.691.1.1.1.1.3 | The timestamp of this entry’s creation time. | |
| cefexBindingExtenderIndex- 1.3.6.1.4.1.9.9.691.1.1.1.1.2 | The value of cefexBindingExtenderIndex used as an Index into the cefexConfigTable to select the Fabric Extender configuration for this binding entry. However, a value in this table does not imply that an instance with this value exists in the cefexConfigTable. If an entry corresponding to the value of this object does not exist in cefexConfigTable, the system default behavior (using DEFVAL values for all the configuration objects as defined in cefexConfigTable) of the Fabric Extender is used for this binding entry. Since an extender may connect to a core switch via multiple interfaces or fabric ports, it is important all the binding entries configuring the same fabric extender are configured with the same extender Index. Every interface on different fabric extender connecting into the same core switch is differentiated by its extender id. To refer to a port on the extender, an example representation may be extender/slot/port. Extender id values 1-99 are reserved. For example, reserved values can be used to identify the core switch and its line cards in the extender/slot/port naming scheme. cefexBindingExtenderIndex identifies further attributes of a fabric extender via the cefexConfigTable. A user may choose to identify a fabric extender by specifying its value of cefexConfigExtendername and/or other attributes. | |
| cefexBindingInterfaceOnCoreSwitch- 1.3.6.1.4.1.9.9.691.1.1.1.1.1 | This object is the index that uniquely identifies an entry in the cefexBindingTable. The value of this object is an IfIndex to a fabric port. By creating a row in this table for a particular core switch interface, the user enables that core switch interface to accept a fabric extender. By default, a core switch interface does not have an entry in this table and consequently does not accept/respond to discovery requests from fabric extenders. | |
| cefexBindingRowStatus- 1.3.6.1.4.1.9.9.691.1.1.1.1.4 | fex_binding_row_status | The status of this conceptual row. |
cefexConfigTable
| OID Name | Selector Queryable | Description |
|---|---|---|
| cefexConfigCreationTime- 1.3.6.1.4.1.9.9.691.1.1.2.1.6 | The timestamp when the value of the corresponding instance of ‘cefexConfigRowStatus’ is made active. If an user modifies objects in this table, the new values are immediately activated. Depending on the object changed, an accepted fabric extender may become not acceptable. As a result, the fabric extender may be disconnected from the core switch. | |
| cefexConfigExtenderName- 1.3.6.1.4.1.9.9.691.1.1.2.1.1 | This object specifies a human readable string representing the name of the ‘Extender’. Note that default value of this object will be the string ‘FEXxxxx’ where xxxx is value of cefexBindingExtenderIndex expressed as 4 digits. For example, if cefexBindingExtenderIndex is 123, the default value of this object is ‘FEX0123’. This object allows the user to identify the extender with an appropriate name. | |
| cefexConfigPinningFailOverMode- 1.3.6.1.4.1.9.9.691.1.1.2.1.4 | fex_pinning_failover_mode | This object allows the user to identify the fabric port failure handling method when pinning is used. |
| cefexConfigPinningMaxLinks- 1.3.6.1.4.1.9.9.691.1.1.2.1.5 | fex_pinning_max_links | This object allows the user to identify number of fabric ports to be used in distribution of pinned non fabric ports. As described above, pinning is the forwarding model used for fabric extenders that do not support local forwarding. Traffic from a non fabric port is forwarded to one fabric port. Selection of non fabric port pinning to fabric ports is distributed as evenly as possible across fabric ports. This object allows administrator to configure number of fabric ports that should be used for pinning non fabric ports. |
| cefexConfigRowStatus- 1.3.6.1.4.1.9.9.691.1.1.2.1.7 | fex_config_row_status | The status of this conceptual row. A row in this table becomes active immediately upon creation. |
| cefexConfigSerialNum- 1.3.6.1.4.1.9.9.691.1.1.2.1.3 | This object allows the user to identify a fabric extender’s Serial Number String. This object is relevant if cefexBindingSerialNumCheck is true. Zero is not a valid length for this object if cefexBindingSerialNumCheck is true. | |
| cefexConfigSerialNumCheck- 1.3.6.1.4.1.9.9.691.1.1.2.1.2 | This object specifies if the serial number check is enabled for this extender or not. If the value of this object is ’true’, then the core switch rejects any extender except for the one with serial number string specified by cefexConfigSerialNum. If the value of this object is ‘false’, then the core switch accept any extender. |
CISCO-ENHANCED-MEMPOOL-MIB
cempMemPoolTable
| OID Name | Selector Queryable | Description |
|---|---|---|
| cempMemPoolHCFree- 1.3.6.1.4.1.9.9.221.1.1.1.1.20 | cisco_mem_pool_free | Indicates the number of bytes from the memory pool that are currently unused on the physical entity. This object is a 64-bit version of cempMemPoolFree. |
| cempMemPoolHCUsed- 1.3.6.1.4.1.9.9.221.1.1.1.1.18 | device_inventory_presence | Indicates the number of bytes from the memory pool that are currently in use by applications on the physical entity. This object is a 64-bit version of cempMemPoolUsed. |
| cempMemPoolName- 1.3.6.1.4.1.9.9.221.1.1.1.1.3 | pan_ha_mode, pan_ha_peer_state, pan_ha_state | A textual name assigned to the memory pool. This object is suitable for output to a human operator, and may also be used to distinguish among the various pool types. |
CISCO-ENVMON-MIB
ciscoEnvMonPresent
| OID Name | Selector Queryable | Description |
|---|---|---|
| ciscoEnvMonFanState- 1.3.6.1.4.1.9.9.13.1.4.1.3 | ent_power_oper_state | The current state of the fan being instrumented. |
| ciscoEnvMonFanStatusDescr-1.3.6.1.4.1.9.9.13.1.4.1.2 | Textual description of the fan being instrumented. This description is a short textual label, suitable as a human-sensible identification for the rest of the information in the entry. | |
| ciscoEnvMonFanStatusIndex-1.3.6.1.4.1.9.9.13.1.4.1.1 | Unique index for the fan being instrumented. This index is for SNMP purposes only, and has no intrinsic meaning. |
ciscoEnvMonSupplyStatusTable
| OID Name | Selector Queryable | Description |
|---|---|---|
| ciscoEnvMonSupplyState- 1.3.6.1.4.1.9.9.13.1.5.1.3 | ent_power_oper_state | The current state of the power supply being instrumented. |
| ciscoEnvMonSupplyStatusDescr- 1.3.6.1.4.1.9.9.13.1.5.1.2 | Textual description of the power supply being instrumented. This description is a short textual label, suitable as a human-sensible identification for the rest of the information in the entry. | |
| ciscoEnvMonSupplyStatusIndex-1.3.6.1.4.1.9.9.13.1.5.1.1 | Unique index for the power supply being instrumented. This index is for SNMP purposes only, and has no intrinsic meaning. |
ciscoEnvMonTemperatureStatusTable
| OID Name | Selector Queryable | Description |
|---|---|---|
| ciscoEnvMonTemperatureStatusDescr- 1.3.6.1.4.1.9.9.13.1.3.1.2 | Textual description of the testpoint being instrumented. This description is a short textual label, suitable as a human-sensible identification for the rest of the information in the entry. | |
| ciscoEnvMonTemperatureStatusIndex- 1.3.6.1.4.1.9.9.13.1.3.1.1 | Unique index for the testpoint being instrumented. This index is for SNMP purposes only, and has no intrinsic meaning. | |
| ciscoEnvMonTemperatureStatusValue-1.3.6.1.4.1.9.9.13.1.3.1.3 | temp_value_c | The current measurement of the testpoint being instrumented. |
CISCO-MEMORY-POOL-MIB
ciscoMemoryPoolTable
| OID Name | Selector Queryable | Description |
|---|---|---|
| ciscoMemoryPoolFree- 1.3.6.1.4.1.9.9.48.1.1.1.6 | cisco_mem_pool_free | Indicates the number of bytes from the memory pool that are currently unused on the managed device. Note that the sum of ciscoMemoryPoolUsed and ciscoMemoryPoolFree is the total amount of memory in the pool |
| ciscoMemoryPoolName- 1.3.6.1.4.1.9.9.48.1.1.1.2 | pan_ha_mode, pan_ha_peer_state, pan_ha_state | A textual name assigned to the memory pool. This object is suitable for output to a human operator, and may also be used to distinguish among the various pool types, especially among dynamic pools. |
| ciscoMemoryPoolUsed- 1.3.6.1.4.1.9.9.48.1.1.1.5 | device_inventory_presence | Indicates the number of bytes from the memory pool that are currently in use by applications on the managed device. |
CISCO-PROCESS-MIB
cpmCpuTotalTable
| OID Name | Selector Queryable | Description |
|---|---|---|
| cpmCPUTotal5minRev- 1.3.6.1.4.1.9.9.109.1.1.1.1.8 | cpu_util_raw, cpu_util_5min_raw | The overall CPU busy percentage in the last 5 minute period. This object deprecates the object cpmCPUTotal5min and increases the value range to (0..100). |
| cpmCPUTotalIndex- 1.3.6.1.4.1.9.9.109.1.1.1.1.1 | An index that uniquely represents a CPU (or group of CPUs) whose CPU load information is reported by a row in this table. This index is assigned arbitrarily by the engine and is not saved over reboots. |
CISCO-STACKWISE-MIB
cswStackInfo
| OID Name | Selector Queryable | Description |
|---|---|---|
| cswSwitchHwPriority- 1.3.6.1.4.1.9.9.500.1.2.1.1.5 | csw_switch_hw_priority | This object contains the hardware priority of a switch. If two or more entries in this table have the same cswSwitchSwPriority value during the master election time, the switch with the highest cswSwitchHwPriority will become the master. Note: This object will contain the value of 0 if the cswSwitchState value is other than ‘ready’. |
| cswSwitchMacAddress- 1.3.6.1.4.1.9.9.500.1.2.1.1.7 | The MAC address of the switch. Note: This object will contain the value of 0000:0000:0000 if the cswSwitchState value is other than ‘ready’. | |
| cswSwitchNumCurrent- 1.3.6.1.4.1.9.9.500.1.2.1.1.1 | csw_switch_num_current | This object contains the current switch identification number. This number should match any logical labeling on the switch. For example, a switch whose interfaces are labeled ‘interface #3’ this value should be 3. |
| cswSwitchRole- 1.3.6.1.4.1.9.9.500.1.2.1.1.3 | csw_switch_role | This object describes the function of the switch: master - stack master. member - active member of the stack. notMember - none-active stack member, see cswSwitchState for status. standby - stack standby switch. |
| cswSwitchState- 1.3.6.1.4.1.9.9.500.1.2.1.1.6 | csw_switch_state | The current state of a switch: waiting - Waiting for a limited time on other switches in the stack to come online. progressing - Master election or mismatch checks in progress. added - The switch is added to the stack. ready - The switch is operational. sdmMismatch - The SDM template configured on the master is not supported by the new member. verMismatch - The operating system version running on the master is different from the operating system version running on this member. featureMismatch - Some of the features configured on the master are not supported on this member. newMasterInit - Waiting for the new master to finish initialization after master switchover (Master Re-Init). provisioned - The switch is not an active member of the stack. invalid - The switch’s state machine is in an invalid state. removed - The switch is removed from the stack. |
| cswSwitchSwPriority- 1.3.6.1.4.1.9.9.500.1.2.1.1.4 | csw_switch_sw_priority | A number containing the priority of a switch. The switch with the highest priority will become the master. The maximum value for this object is defined by the cswMaxSwitchConfigPriority object. If after a reload the value of cswMaxSwitchConfigPriority changes to a smaller value, and the value of cswSwitchSwPriority has been previously set to a value greater or equal to the new cswMaxSwitchConfigPriority, then the SNMP agent must set cswSwitchSwPriority to the new cswMaxSwitchConfigPriority. Note: This object will contain the value of 0 if the cswSwitchState value is other than ‘ready’. |
CISCO-VRF-MIB
cvVrfTable
| OID Name | Selector Queryable | Description |
|---|---|---|
| cvVrfIndex- 1.3.6.1.4.1.9.9.711.1.1.1.1.1 | An identifier that is assigned to each VRF and is used to uniquely identify it. The uniqueness of this identifier is restricted only to this device. | |
| cvVrfName- 1.3.6.1.4.1.9.9.711.1.1.1.1.2 | The human-readable name of the VRF instance. This name uniquely identifies the VRF instance in the system. This object is mandatory for creating an entry in this table. | |
| cvVrfOperStatus- 1.3.6.1.4.1.9.9.711.1.1.1.1.4 | cisco_vrf_status | Denotes whether a VRF is operational or not. A VRF is up(1) when at least one interface associated with the VRF, which ifOperStatus is up(1). A VRF is down(2) when: a. There does not exist at least one interface whose ifOperStatus is up(1). b. There are no interfaces associated with the VRF. |
CISCO-ENTITY-SENSOR-MIB
entSensorValueTable
| OID Name | Selector Queryable | Description |
|---|---|---|
| entSensorType- 1.3.6.1.4.1.9.9.91.1.1.1.1.1 | This variable indicates the type of data reported by the entSensorValue. This variable is set by the agent at start-up and the value does not change during operation. | |
| entSensorValue- 1.3.6.1.4.1.9.9.91.1.1.1.1.4 | netflow_conversation_bytes | This variable reports the most recent measurement seen by the sensor. To correctly display or interpret this variable’s value, you must also know entSensorType, entSensorScale, and entSensorPrecision. However, you can compare entSensorValue with the threshold values given in entSensorThresholdTable without any semantic knowledge. |
Extreme Proprietary MIBs
EXTREME-SYSTEM-MIB
extremeFanStatusTable
| OID Name | Selector Queryable | Description |
|---|---|---|
| extremeFanEntPhysicalIndex-1.3.6.1.4.1.1916.1.1.1.9.1.3 | The entity index for this fan entity in the entityPhysicalTable table of the entity MIB. | |
| extremeFanNumber- 1.3.6.1.4.1.1916.1.1.1.9.1.1 | Identifier of cooling fan, numbered from the front and/or left side of device. | |
| extremeFanOperational- 1.3.6.1.4.1.1916.1.1.1.9.1.2 | extreme_fan_state | Operational status of a cooling fan. |
extremePowerSupplyTable
| OID Name | Selector Queryable | Description |
|---|---|---|
| extremePowerSupplyEntPhysicalIndex- 1.3.6.1.4.1.1916.1.1.1.27.1.5 | The entity index for this psu entity in the entityPhysicalTable of the entity MIB. | |
| extremePowerSupplySerialNumber- 1.3.6.1.4.1.1916.1.1.1.27.1.4 | The serial number of the power supply unit. | |
| extremePowerSupplyStatus- 1.3.6.1.4.1.1916.1.1.1.27.1.2 | extreme_power_supply_state | Status of the power supply. |
extremeSystemCommon
| OID Name | Selector Queryable | Description |
|---|---|---|
| extremeCurrentTemperature-1.3.6.1.4.1.1916.1.1.1.8 | extreme_temp_value_c | Current temperature in degrees celsius measured inside device enclosure. |
F5 Proprietary MIB OIDs
F5-BIGIP-SYSTEM-MIB
cpmCPUTotalTable
| OID Name | Selector Queryable | Description |
|---|---|---|
| sysStatMemoryTotal- 1.3.6.1.4.1.3375.2.1.1.2.1.44 | memory_size | The total memory available in bytes for TMM (Traffic Management Module). Use sysStatMemoryTotalKb for gauge type. |
| sysStatMemoryUsed- 1.3.6.1.4.1.3375.2.1.1.2.1.45 | memory_used | The memory in use in bytes for TMM (Traffic Management Module). Use sysStatMemoryUsedKb for gauge type. |
sysChassisFanTable
| OID Name | Selector Queryable | Description |
|---|---|---|
| sysChassisFanIndex- 1.3.6.1.4.1.3375.2.1.3.2.1.2.1.1 | The index of a chassis fan on the system. It identifies a particular chassis fan. | |
| sysChassisFanStatus- 1.3.6.1.4.1.3375.2.1.3.2.1.2.1.2 | fan_f5_chassis_state | The status of the indexed chassis fan on the system., This is only supported for the platform where the sensor data is available. |
sysChassisPowerSupplyTable
| OID Name | Selector Queryable | Description |
|---|---|---|
| sysChassisPowerSupplyIndex - 1.3.6.1.4.1.3375.2.1.3.2.2.2.1.1 | The index of a power supply on the system. | |
| sysChassisPowerSupplyStatus - 1.3.6.1.4.1.3375.2.1.3.2.2.2.1.2 | power_supply_f5_chassis_state | The status of the indexed power supply on the system., This is only supported for the platform where the sensor data is available. |
sysChassisTempTable
| OID Name | Selector Queryable | Description |
|---|---|---|
| sysChassisTempIndex- 1.3.6.1.4.1.3375.2.1.3.2.3.2.1.1 | The index of a chassis temperature sensor on the system. It identifies a particular chassis temperature sensor, fan, etc. | |
| sysChassisTempTemperature- 1.3.6.1.4.1.3375.2.1.3.2.3.2.1.2 | temp_value_f5_chassis_c | The chassis temperature (in Celsius) of the indexed sensor on the system., This is only supported for the platform where the sensor data is available. |
sysCmFailoverStatus
| OID Name | Selector Queryable | Description |
|---|---|---|
| sysCmFailoverStatusColor- 1.3.6.1.4.1.3375.2.1.14.3.3 | f5_ha_failover_status | The color of the failover status on the system. green - the system is functioning correctly; yellow - the system may be functioning suboptimally; red - the system requires attention to function correctly; blue - the system’s status is unknown or incomplete; gray - the system is intentionally not functioning (offline); black - the system is not connected to any peers. |
| sysCmFailoverStatusId- 1.3.6.1.4.1.3375.2.1.14.3.1 | f5_ha_mode | The failover status ID on the system. unknown - the failover status of the device is unknown; offline - the device is offline; forcedOffline - the device is forced offline; standby - the device is standby; active - the device is active. |
| sysCmFailoverStatusStatus- 1.3.6.1.4.1.3375.2.1.14.3.2 | The failover status on the system. | |
| sysCmFailoverStatusSummary- 1.3.6.1.4.1.3375.2.1.14.3.4 | The summary of the failover status on the system. |
sysLldpNeighborsTableTable
| OID Name | Selector Queryable | Description |
|---|---|---|
| sysLldpNeighborsTableLocalInterface- 1.3.6.1.4.1.3375.2.1.2.16.1.2.1.3 | The local port ID to which the LLDP neighbor is connected. | |
| sysLldpNeighborsTablePortDesc- 1.3.6.1.4.1.3375.2.1.2.16.1.2.1.4 | A description of the port on the LLDP neighbor. | |
| sysLldpNeighborsTablePortId- 1.3.6.1.4.1.3375.2.1.2.16.1.2.1.2 | The port ID of the LLDP neighbor. | |
| sysLldpNeighborsTableSysName- 1.3.6.1.4.1.3375.2.1.2.16.1.2.1.5 | The system name of the LLDP neighbor. |
sysMultiHostCpuTable
| OID Name | Selector Queryable | Description |
|---|---|---|
| sysMultiHostCpuUsageRatio5m- 1.3.6.1.4.1.3375.2.1.7.5.2.1.35 | cpu_util_raw, cpu_util_5min_raw | This is average usage ratio of CPU for the associated host in the last five minutes. It is calculated by (sum of deltas for user, niced, system)/(sum of deltas of user, niced, system, idle, irq, softirq, and iowait), where each delta is the difference for each stat over the last 5-minute interval; user: sysMultiHostCpuUser5m; niced: sysMultiHostCpuNiced5m; stolen: sysMultiHostCpuStolen5m; system: sysMultiHostCpuSystem5m; idle: sysMultiHostCpuIdle5m; irq: sysMultiHostCpuIrq5m; iowait: sysMultiHostCpuIowait5m |
Fortinet Proprietary MIB OIDs
FORTIGATE-MIB
fgDisks
| OID Name | Selector Queryable | Description |
|---|---|---|
| fgDiskName- 1.3.6.1.4.1.12356.101.4.10.2.1.2 | The name of the storage. |
fgHaInfo
| OID Name | Selector Queryable | Description |
|---|---|---|
| fgHaSystemMode- 1.3.6.1.4.1.12356.101.13.1.1 | fortinet_ha_mode | High-availability mode (Standalone, A-A or A-P) |
fgHaStatsTable
| OID Name | Selector Queryable | Description |
|---|---|---|
| fgHaStatsHostname- 1.3.6.1.4.1.12356.101.13.2.1.1.11 | Host name of the specified cluster member | |
| fgHaStatsIndex- 1.3.6.1.4.1.12356.101.13.2.1.1.1 | An index value that uniquely identifies an unit in the HA Cluster | |
| fgHaStatsSyncStatus- 1.3.6.1.4.1.12356.101.13.2.1.1.12 | fortinet_ha_sync_status | Current HA Sync status |
fgHwSensorTablee
| OID Name | Selector Queryable | Description |
|---|---|---|
| fgHwSensorEntAlarmStatus- 1.3.6.1.4.1.12356.101.4.3.2.1.4 | fortinet_env_alarm_status | If the sensor has an alarm threshold and has exceeded it, this will indicate its status. Not all sensors have alarms. |
| fgHwSensorEntIndex- 1.3.6.1.4.1.12356.101.4.3.2.1.1 | A unique identifier within the fgHwSensorTable | |
| fgHwSensorEntName- 1.3.6.1.4.1.12356.101.4.3.2.1.2 | A string identifying the sensor by name | |
| fgHwSensorEntValue- 1.3.6.1.4.1.12356.101.4.3.2.1.3 | fortinet_env_value | A string representation of the value of the sensor. Because sensors can present data in different formats, string representation is most general format. Interpretation of the value (units of measure, for example) is dependent on the individual sensor. |
fgLinkMonitorTable
| OID Name | Selector Queryable | Description |
|---|---|---|
| fgLinkMonitorBandwidthBi- 1.3.6.1.4.1.12356.101.4.8.2.1.12 | link_monitor_bw_bi | The available bandwidth in Mbps of bi-direction traffic detected by a link monitor on its interface. |
| fgLinkMonitorBandwidthIn- 1.3.6.1.4.1.12356.101.4.8.2.1.10 | link_monitor_bw_in | The available bandwidth in Mbps of incoming traffic detected by a link monitor on its interface. |
| fgLinkMonitorBandwidthOut- 1.3.6.1.4.1.12356.101.4.8.2.1.11 | link_monitor_bw_out | The available bandwidth in Mbps of outgoing traffic detected by a link monitor on its interface. |
| fgLinkMonitorID- 1.3.6.1.4.1.12356.101.4.8.2.1.1 | Link Monitor ID. Only enabled link monitor entries are present in this table. Link Monitor IDs are only unique within a virtual domain. | |
| fgLinkMonitorJitter- 1.3.6.1.4.1.12356.101.4.8.2.1.5 | link_monitor_jitter | The average jitter of link monitor in float number within last 30 probes. |
| fgLinkMonitorLatency- 1.3.6.1.4.1.12356.101.4.8.2.1.4 | link_monitor_latency | The average latency of link monitor in float number within last 30 probes. |
| fgLinkMonitorName- 1.3.6.1.4.1.12356.101.4.8.2.1.2 | Link Monitor name. | |
| fgLinkMonitorOutofSeq- 1.3.6.1.4.1.12356.101.4.8.2.1.13 | link_monitor_out_of_seq | The total number of out of sequence packets received. |
| fgLinkMonitorPacketLoss- 1.3.6.1.4.1.12356.101.4.8.2.1.8 | link_monitor_packet_loss | The average packet loss percentage in float number within last 30 probes. |
| fgLinkMonitorState- 1.3.6.1.4.1.12356.101.4.8.2.1.3 | link_monitor_state | Link Monitor state. |
| fgLinkMonitorVdom- 1.3.6.1.4.1.12356.101.4.8.2.1.9 | Virtual domain the link monitor entry exists in. This name corresponds to the fgVdEntName used in fgVdTable. |
fgSystemInfo
| OID Name | Selector Queryable | Description |
|---|---|---|
| fgSysCpuUsage- 1.3.6.1.4.1.12356.101.4.1.3 | cpu_util_raw | Current CPU usage (percentage) |
| fgSysMemUsage- 1.3.6.1.4.1.12356.101.4.1.4 | memory_usage_fortinet | Current memory utilization (percentage) |
fgVWLHealthCheckLinkTable
| OID Name | Selector Queryable | Description |
|---|---|---|
| fgVWLHealthCheckLinkBandwidthBi- 1.3.6.1.4.1.12356.101.4.9.2.1.13 | sd_wan_bw_bi | The available bandwidth in Mbps of bi-direction traffic detected by a health-check on a specific member link. |
| fgVWLHealthCheckLinkBandwidthIn- 1.3.6.1.4.1.12356.101.4.9.2.1.11 | sd_wan_bw_in | The available bandwidth in Mbps of incoming traffic detected by a health-check on a specific member link. |
| fgVWLHealthCheckLinkBandwidthOut- 1.3.6.1.4.1.12356.101.4.9.2.1.12 | sd_wan_bw_out | The available bandwidth in Mbps of outgoing traffic detected by a health-check on a specific member link. |
| fgVWLHealthCheckLinkID- 1.3.6.1.4.1.12356.101.4.9.2.1.1 | Virtual-wan-link health-check link ID. Only health-checks with configured member link are present in this table. Virtuwal-wan-link health check link IDs are only unique within a virtual domain. | |
| fgVWLHealthCheckLinkJitter- 1.3.6.1.4.1.12356.101.4.9.2.1.6 | sd_wan_jitter | The average jitter of a health check on a specific member link in float number within last 30 probes. |
| fgVWLHealthCheckLinkLatency- 1.3.6.1.4.1.12356.101.4.9.2.1.5 | sd_wan_latency | The average latency of a health check on a specific member link in float number within last 30 probes. |
| fgVWLHealthCheckLinkName- 1.3.6.1.4.1.12356.101.4.9.2.1.2 | Health check name. | |
| fgVWLHealthCheckLinkPacketLoss- 1.3.6.1.4.1.12356.101.4.9.2.1.9 | sd_wan_packet_loss | The packet loss percentage of a health check on a specific member link in float number within last 30 probes. |
| fgVWLHealthCheckLinkState- 1.3.6.1.4.1.12356.101.4.9.2.1.4 | sd_wan_state | Heatlth check state on a specific member link. |
| fgVWLHealthCheckLinkVdom- 1.3.6.1.4.1.12356.101.4.9.2.1.10 | Virtual domain the link monitor entry exists in. This name corresponds to the fgVdEntName used in fgVdTable. |
fgVdTable
| OID Name | Selector Queryable | Description |
|---|---|---|
| fgVdEntHaState- 1.3.6.1.4.1.12356.101.3.2.1.1.4 | HA cluster member state of the virtual domain on this device (master, backup or standalone) | |
| fgVdEntIndex- 1.3.6.1.4.1.12356.101.3.2.1.1.1 | Internal virtual domain index used to uniquely identify rows in this table. This index is also used by other tables referencing a virtual domain. | |
| fgVdEntName- 1.3.6.1.4.1.12356.101.3.2.1.1.2 | The name of the virtual domain | |
| fgVdEntOpMode- 1.3.6.1.4.1.12356.101.3.2.1.1.3 | Operation mode of the virtual domain (NAT or Transparent) |
fgVpnTunTable
| OID Name | Selector Queryable | Description |
|---|---|---|
| fgVpnTunEntInOctets- 1.3.6.1.4.1.12356.101.12.2.2.1.18 | phase1_tunnel_in_octets, if_in_octets | Number of bytes received on tunnel |
| fgVpnTunEntIndex- 1.3.6.1.4.1.12356.101.12.2.2.1.1 | An index value that uniquely identifies a VPN tunnel within the fgVpnTunTable | |
| fgVpnTunEntLifeSecs- 1.3.6.1.4.1.12356.101.12.2.2.1.15 | phase1_tunnel_life_secs | Lifetime of tunnel in seconds, if time based lifetime used |
| fgVpnTunEntLocGwyIp- 1.3.6.1.4.1.12356.101.12.2.2.1.6 | IP of local gateway used by the tunnel | |
| fgVpnTunEntOutOctets- 1.3.6.1.4.1.12356.101.12.2.2.1.19 | phase1_tunnel_out_octets, if_out_octets | Number of bytes sent out on tunnel |
| fgVpnTunEntPhase1Name- 1.3.6.1.4.1.12356.101.12.2.2.1.2 | Descriptive name of phase1 configuration for the tunnel | |
| fgVpnTunEntPhase2Name- 1.3.6.1.4.1.12356.101.12.2.2.1.3 | Descriptive name of phase2 configuration for the tunnel | |
| fgVpnTunEntRemGwyIp- 1.3.6.1.4.1.12356.101.12.2.2.1.4 | IP of remote gateway used by the tunnel | |
| fgVpnTunEntStatus- 1.3.6.1.4.1.12356.101.12.2.2.1.20 | phase1_tunnel_status, if_oper_status, if_admin_status | Current status of tunnel (up or down) |
| fgVpnTunEntTimeout- 1.3.6.1.4.1.12356.101.12.2.2.1.17 | phase1_tunnel_timeout | Timeout of tunnel in seconds |
| fgVpnTunEntVdom- 1.3.6.1.4.1.12356.101.12.2.2.1.21 | Virtual domain the tunnel is part of. This index corresponds to the index used by fgVdTable. |
Infoblox Proprietary MIB OIDs
Infoblox-DHCPONE-MIB
ibDHCPSubnetTable
| OID Name | Selector Queryable | Description |
|---|---|---|
| ibDHCPSubnetNetworkAddress- 1.3.6.1.4.1.7779.3.1.1.4.1.1.1.1 | DHCP Subnet in IpAddress format. A subnetwork may have many ranges for lease. | |
| ibDHCPSubnetNetworkMask- 1.3.6.1.4.1.7779.3.1.1.4.1.1.1.2 | DHCP Subnet mask in IpAddress format. | |
| ibDHCPSubnetPercentUsed- 1.3.6.1.4.1.7779.3.1.1.4.1.1.1.3 | dhcp_subnet_util | Percentage of dynamic DHCP address for subnet leased out at this time. Fixed addresses are always counted as leased for this calcuation if the fixed addresses are within ranges of leases. |
Infoblox-PLATFORMONE-MIB
ibMemberNodeServiceStatusTable
| OID Name | Selector Queryable | Description |
|---|---|---|
| ibNode1ServiceDesc- 1.3.6.1.4.1.7779.3.1.1.2.1.10.1.3 | ib_entity_temp | Service Description. |
| ibNode1ServiceName- 1.3.6.1.4.1.7779.3.1.1.2.1.10.1.1 | pan_ha_mode, pan_ha_peer_state, pan_ha_state | Service Name. |
| ibNode1ServiceStatus- 1.3.6.1.4.1.7779.3.1.1.2.1.10.1.2 | vip_addr_avail_state, vip_addr_enabled_state | Service Status. |
Juniper proprietary MIBs
JUNIPER-DOM-MIB
jnxDomCurrentTable
| OID Name | Selector Queryable | Description |
|---|---|---|
| jnxDomCurrentModuleLaneCount- 1.3.6.1.4.1.2636.3.60.1.1.1.1.30 | transceiver_lane_count_raw | Number of Lanes (Lasers) in this module |
| jnxDomCurrentModuleTemperature- 1.3.6.1.4.1.2636.3.60.1.1.1.1.8 | transceiver_temperature_raw, transceiver_temperature_high_warning_threshold_raw | Module temperature. |
| jnxDomCurrentModuleTemperatureHighAlarmThreshold- 1.3.6.1.4.1.2636.3.60.1.1.1.1.21 | Module temperature high alarm threshold. | |
| jnxDomCurrentModuleTemperatureHighWarningThreshold- 1.3.6.1.4.1.2636.3.60.1.1.1.1.23 | transceiver_temperature_high_warning_threshold_raw | Module temperature high warning threshold. |
| jnxDomCurrentModuleTemperatureLowAlarmThreshold- 1.3.6.1.4.1.2636.3.60.1.1.1.1.22 | Module temperature low alarm threshold. | |
| jnxDomCurrentModuleTemperatureLowWarningThreshold- 1.3.6.1.4.1.2636.3.60.1.1.1.1.24 | Module temperature low warning threshold. | |
| jnxDomCurrentModuleVoltage- 1.3.6.1.4.1.2636.3.60.1.1.1.1.25 | Module voltage. | |
| jnxDomCurrentModuleVoltageHighAlarmThreshold- 1.3.6.1.4.1.2636.3.60.1.1.1.1.26 | Module voltage high alarm threshold. | |
| jnxDomCurrentModuleVoltageHighWarningThreshold- 1.3.6.1.4.1.2636.3.60.1.1.1.1.28 | Module voltage high warning threshold. | |
| jnxDomCurrentModuleVoltageLowAlarmThreshold- 1.3.6.1.4.1.2636.3.60.1.1.1.1.27 | Module voltage low alarm threshold. | |
| jnxDomCurrentModuleVoltageLowWarningThreshold- 1.3.6.1.4.1.2636.3.60.1.1.1.1.29 | Module voltage low warning threshold. | |
| jnxDomCurrentRxLaserPower-1.3.6.1.4.1.2636.3.60.1.1.1.1.5 | transceiver_rx_laser_power_raw, transceiver_rx_laser_power_low_alarm_threshold_raw | Receiver laser power. |
| jnxDomCurrentRxLaserPowerHighAlarmThreshold- 1.3.6.1.4.1.2636.3.60.1.1.1.1.9 | Receiver laser power high alarm threshold. | |
| jnxDomCurrentRxLaserPowerHighWarningThreshold- 1.3.6.1.4.1.2636.3.60.1.1.1.1.11 | Receiver laser power high warning threshold. | |
| jnxDomCurrentRxLaserPowerLowAlarmThreshold- 1.3.6.1.4.1.2636.3.60.1.1.1.1.10 | transceiver_rx_laser_power_low_alarm_threshold_raw | Receiver laser power low alarm threshold. |
| jnxDomCurrentRxLaserPowerLowWarningThreshold- 1.3.6.1.4.1.2636.3.60.1.1.1.1.12 | Receiver laser power low warning threshold. | |
| jnxDomCurrentTxLaserBiasCurrent- 1.3.6.1.4.1.2636.3.60.1.1.1.1.6 | Transmitter laser bias current. | |
| jnxDomCurrentTxLaserBiasCurrentHighAlarmThreshold- 1.3.6.1.4.1.2636.3.60.1.1.1.1.13 | Transmitter laser bias current high alarm threshold. | |
| jnxDomCurrentTxLaserBiasCurrentHighWarningThreshold- 1.3.6.1.4.1.2636.3.60.1.1.1.1.15 | Transmitter laser bias current high warning threshold. | |
| jnxDomCurrentTxLaserBiasCurrentLowAlarmThreshold- 1.3.6.1.4.1.2636.3.60.1.1.1.1.14 | Transmitter laser bias current low alarm threshold. | |
| jnxDomCurrentTxLaserBiasCurrentLowWarningThreshold- 1.3.6.1.4.1.2636.3.60.1.1.1.1.16 | Transmitter laser bias current low warning threshold. | |
| jnxDomCurrentTxLaserOutputPower- 1.3.6.1.4.1.2636.3.60.1.1.1.1.7 | transceiver_tx_laser_power_raw, transceiver_tx_laser_power_low_alarm_threshold_raw | Transmitter laser output power. |
| jnxDomCurrentTxLaserOutputPowerHighAlarmThreshold- 1.3.6.1.4.1.2636.3.60.1.1.1.1.17 | Transmitter laser power high alarm threshold. | |
| jnxDomCurrentTxLaserOutputPowerHighWarningThreshold- 1.3.6.1.4.1.2636.3.60.1.1.1.1.19 | Transmitter laser power high warning threshold. | |
| jnxDomCurrentTxLaserOutputPowerLowAlarmThreshold- 1.3.6.1.4.1.2636.3.60.1.1.1.1.18 | transceiver_tx_laser_power_low_alarm_threshold_raw | Transmitter laser power low alarm threshold. |
| jnxDomCurrentTxLaserOutputPowerLowWarningThreshold- 1.3.6.1.4.1.2636.3.60.1.1.1.1.20 | Transmitter laser power low warning threshold. |
JUNIPER-MIB
jnxOperatingState
| OID Name | Selector Queryable | Description |
|---|---|---|
| jnxOperatingState- 1.3.6.1.4.1.2636.3.1.13.1.6 | jnpr_operating_state | The operating state of this subject. |
jnxOperatingTable
| OID Name | Selector Queryable | Description |
|---|---|---|
| jnxOperating5MinLoadAvg- 1.3.6.1.4.1.2636.3.1.13.1.21 | cpu_util_5min_raw | The CPU Load Average over the last 5 minutes Here it will be shown as percentage value Zero if unavailable or inapplicable. |
| jnxOperatingBuffer- 1.3.6.1.4.1.2636.3.1.13.1.11 | jnpr_mem_usage_raw | The buffer pool utilization in percentage of this subject. Zero if unavailable or inapplicable. |
| jnxOperatingCPU- 1.3.6.1.4.1.2636.3.1.13.1.8 | cpu_util_raw | The CPU utilization in percentage of this subject. Zero if unavailable or inapplicable. |
| jnxOperatingDescr- 1.3.6.1.4.1.2636.3.1.13.1.5 | The name or detailed description of this subject. |
Palo Alto Proprietary MIBs
PAN-COMMON-MIB
panGlobalProtect
| OID Name | Selector Queryable | Description |
|---|---|---|
| panGPGWUtilizationActiveTunnels- 1.3.6.1.4.1.25461.2.1.2.5.1.3 | pan_gpgw_utilization_active_tunnels | Number of active tunnels |
| panGPGWUtilizationMaxTunnels- 1.3.6.1.4.1.25461.2.1.2.5.1.2 | pan_gpgw_utilization_max_tunnels | Max tunnels allowed |
| panGPGWUtilizationPct-1.3.6.1.4.1.25461.2.1.2.5.1.1 | pan_gpgw_utilization_pct | GlobalProtect Gateway utilization percentage |
panSession
| OID Name | Selector Queryable | Description |
|---|---|---|
| panSessionActive- 1.3.6.1.4.1.25461.2.1.2.3.3 | pan_session_active, pan_session_active_icmp, pan_session_active_tcp, pan_session_active_udp, pan_session_active_ssl_proxy | Total number of active sessions. |
| panSessionActiveICMP- 1.3.6.1.4.1.25461.2.1.2.3.6 | pan_session_active_icmp | Total number of active ICMP sessions. |
| panSessionActiveSslProxy- 1.3.6.1.4.1.25461.2.1.2.3.7 | pan_session_active_ssl_proxy | Total number of active SSL proxy sessions. |
| panSessionActiveTcp- 1.3.6.1.4.1.25461.2.1.2.3.4 | pan_session_active_tcp | Total number of active TCP sessions. |
| panSessionActiveUdp- 1.3.6.1.4.1.25461.2.1.2.3.5 | pan_session_active_udp | Total number of active UDP sessions. |
| panSessionMax- 1.3.6.1.4.1.25461.2.1.2.3.2 | pan_session_max | Total number of sessions supported. |
| panSessionSslProxyUtilization- 1.3.6.1.4.1.25461.2.1.2.3.8 | pan_session_ssl_proxy_utilization | SSL proxy Session utilization percentage. Values should be between 0 and 100. |
| panSessionUtilization- 1.3.6.1.4.1.25461.2.1.2.3.1 | pan_session_utilization | Session table utilization percentage. Values should be between 0 and 100. |
panSysHaMode
| OID Name | Selector Queryable | Description |
|---|---|---|
| panSysHAMode- 1.3.6.1.4.1.25461.2.1.2.1.13 | pan_ha_mode | Current high-availability mode (disabled, active-passive, or active-active). |
| panSysHAPeerState- 1.3.6.1.4.1.25461.2.1.2.1.12 | pan_ha_peer_state | Current peer high-availability state. |
| panSysHAState- 1.3.6.1.4.1.25461.2.1.2.1.11 | pan_ha_state | Current high-availability state. |
panVsysTable
| OID Name | Selector Queryable | Description |
|---|---|---|
| panVsysActiveSessions- 1.3.6.1.4.1.25461.2.1.2.3.9.1.4 | pan_vsys_session_active | Active sessions on this Vsys |
| panVsysId- 1.3.6.1.4.1.25461.2.1.2.3.9.1.1 | Vsys id | |
| panVsysMaxSessions- 1.3.6.1.4.1.25461.2.1.2.3.9.1.5 | pan_vsys_session_max | Max sessions on this Vsys, if session limit is configured. If session limit is not configured, this value is ‘0’ |
| panVsysName- 1.3.6.1.4.1.25461.2.1.2.3.9.1.2 | User assigned vsys name (empty string if not available) | |
| panVsysSessionUtilizationPct- 1.3.6.1.4.1.25461.2.1.2.3.9.1.3 | pan_vsys_session_utilization_pct | Vsys utilization percentage, if session limit is configured. If session limit is not configured, this value is ‘0’ |
Synoptics
S5-CHASSIS-MIB
s5ChasCom
| OID Name | Selector Queryable | Description |
|---|---|---|
| s5ChasComOperState- .1.3.6.1.4.1.45.1.6.3.3.1.1.10 | The current operational state of the component. The possible values are: other(1)………some other state notAvail(2)……state not available removed(3)…….component removed disabled(4)……operation disabled normal(5)……..normal operation resetInProg(6)…reset in progress testing(7)…….doing a self test warning(8)…….operating at warning level nonFatalErr(9)…operating at error level fatalErr(10)…..error stopped operation notConfig(11)….module needs to be configured obsoleted(12)…module is obsoleted but in the chassis The allowable (and meaningful) values are determined by the component type. |
s5ChasUtilTable
| OID Name | Selector Queryable | Description |
|---|---|---|
| s5ChasUtilMemoryAvailableMB- 1.3.6.1.4.1.45.1.6.3.8.1.1.13 | memory_available_extreme | This object returns the available RAM of unit. |
| s5ChasUtilMemoryTotalMB- 1.3.6.1.4.1.45.1.6.3.8.1.1.12 | memory_total_extreme | This object returns the total RAM of unit. |