Pingmesh Integration
Contents
Overview
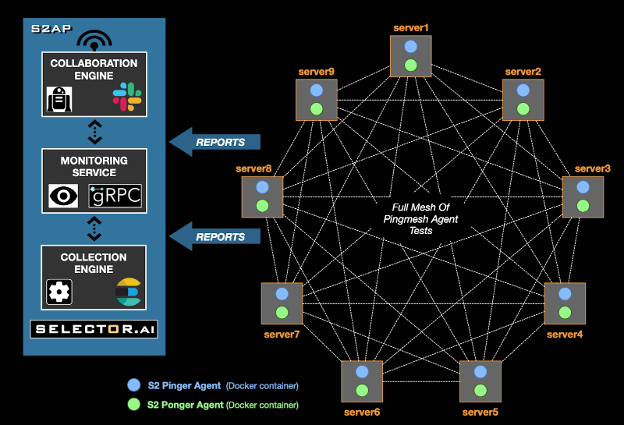
Selector Pingmesh is a comprehensive, synthetic performance measurement solution designed for hybrid networks, applications, and infrastructure. It provides an “over-the-top” mechanism for assessing network health by employing probe agents to continuously exercise the data plane.
The way Pingmesh is used in S2AP is shown in the following figure.
Key Benefits
Continuous & Synthetic Performance Measurement
Pingmesh operates by deploying agents that generate synthetic traffic to measure critical network metrics. This proactive approach ensures real-time visibility into network performance without relying solely on user traffic.
Core Metrics: Measures latency, packet loss, and jitter.
Path & Reachability: Validates network paths and reachability across the infrastructure.
Protocol Support: Utilizes UDP probes for standard measurements, with support for TCP and ICMP ping probes.
Multi-VRF Awareness for Complex Architectures
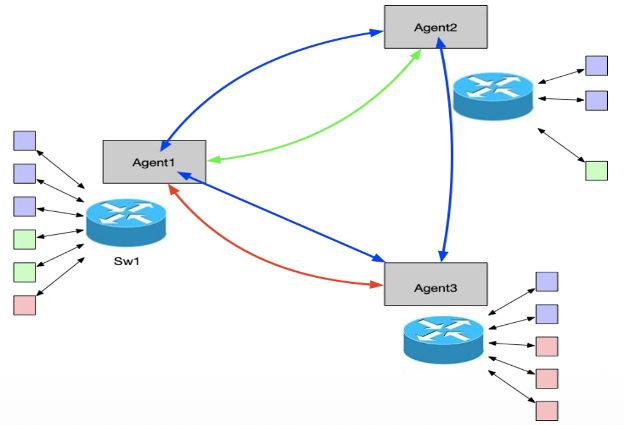
Designed for modern, segmented networks, Selector Pingmesh supports multiple Virtual Routing and Forwarding (Multi-VRF) environments.
VRF-Aware Agents: A single agent can act in multiple “pinger” and “ponger” roles simultaneously across different VRFs (e.g., VRF1, VRF2, VRF3).
Resource Efficiency: This architecture reduces the need for multiple agents on a single switch, allowing one agent to validate connectivity across segmented routing domains, as shown in the following figure.
Enhanced Path Validation with ECMP Support
To accurately validate load-balanced networks, Pingmesh employs source port randomization.
Path Diversity: By randomizing the source port or multiple source ports for probe packets, the system exercises different links in an ECMP (Equal-Cost Multi-Path) bundle.
Traffic Simulation: This ensures that probe packets traverse varying paths to the destination, detecting issues that might be hidden by a single static path.
Integrated Analytics with S2AP
The solution is powered by the Selector Software Analytics Platform (S2AP), which acts as the “brain” of the operation.
Correlation: Metrics are correlated with tags (for example, rack, pod, cluster, site) and other logs/events for deeper context.
Visualization: Data is rendered into actionable formats such as threshold violation matrices (heatmaps), line plots, and honeycomb charts.
Technical Architecture
The Pingmesh architecture consists of distributed agents communicating with a central management and analytics layer.
Components
S2 Agents: Lightweight Docker containers running on network devices (servers/switches) for active Pingmesh.
Pinger: The sender of probe packets.
Ponger: The responder to probe packets.
S2AP: Handles collection, monitoring, and analysis.
Monitoring Service: Manages agent registration and configuration using gRPC.
It is essential to understand the distinction between Active and Passive Pingmesh configurations to select the right deployment model for your network. While both active and passive modes deliver critical health metrics such as RTT and packet loss, they utilize different protocols and have distinct infrastructure requirements. The table below details the operational differences between these two types to help you align the solution with your specific monitoring goals.
| Feature | Active Pingmesh | Passive Pingmesh |
|---|---|---|
| Protocol | UDP only | ICMP only |
| Ports | Destination: UDP 52000 (Default) Source: UDP 52001 (Sequential) or 20000-32000 (Randomized) | N/A (Standard ICMP Echo probes do not use transport layer ports) |
| Agent Requirement | Multiple Agents (Requires a “Pinger” and a “Ponger” agent) | Singular Agent (One agent probes a target device or devices) |
| Metrics Collected | Round Trip Time (RTT), Packet Loss, Jitter | Round Trip Time (RTT), Packet Loss, Jitter |
| Traffic Generation | Generates synthetic UDP traffic between agents to stress-test specific paths. | Uses standard ICMP echo requests (Ping) to check reachability of non-agent devices. |
Deployment & Security
Automated Installation: Agents are installed by way of DEB/RPM packages and can be managed using Ansible scripts.
Security: Releases are signed using GnuPG (GPG), and the system supports secure distribution with APT/YUM repositories.
Inventory Management: Devices can be added dynamically using CSV upload or API, with support for automated instance creation.
Key Features at a Glance
| Feature | Description |
|---|---|
| Probe Types | UDP (default), TCP, ICMP Ping, Traceroute. |
| Topologies | Full mesh, partial mesh, and multi-node S2AP support. |
| Inventory Logic | Flexible grouping by Cluster, Rack, Site, and Suite labels. |
| Visualizations | Heatmaps for quick health checks (Red/Yellow/Green status) and time-series plots for historical trends. |
| Scalability | Supports high-scale environments with automated “fanout” reporting and configurable ping intervals. |
Example Usage
Network Health Barometer: Acts as a continuous “heartbeat” for the network data plane.
Latency & Loss Monitoring: Precise tracking of packet loss percentages and round-trip latency.
Fabric Verification: Validates connectivity across Spine, Leaf, and ToR switches in complex data center fabrics.