Selector Software Operations Guide
![]()
This is the multi-page printable view of this section. Click here to print.
![]()
This part of the S2AP Operations Guide describes the fundamentals of day-to-day access and dashboard operation for the S2AP platform from Selector AI Software. The part of the guide is divided into several major parts:
Some related features, such as widgets and maintenance windows, are covered in other documentation. Links to these documents are provided where appropriate.
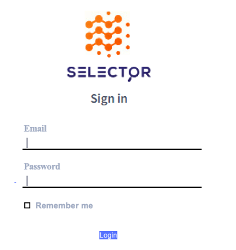
The deployed Selector platform (S2) platform is available from any browser with network access, although we recommend use of the Chrome browser. Details such as login URL and credentials are obtained from your account’s Solutions Engineer or Customer Success Engineer. Once you have this information, navigate to the provided URL and enter the credentials.
The sign in page looks like this:
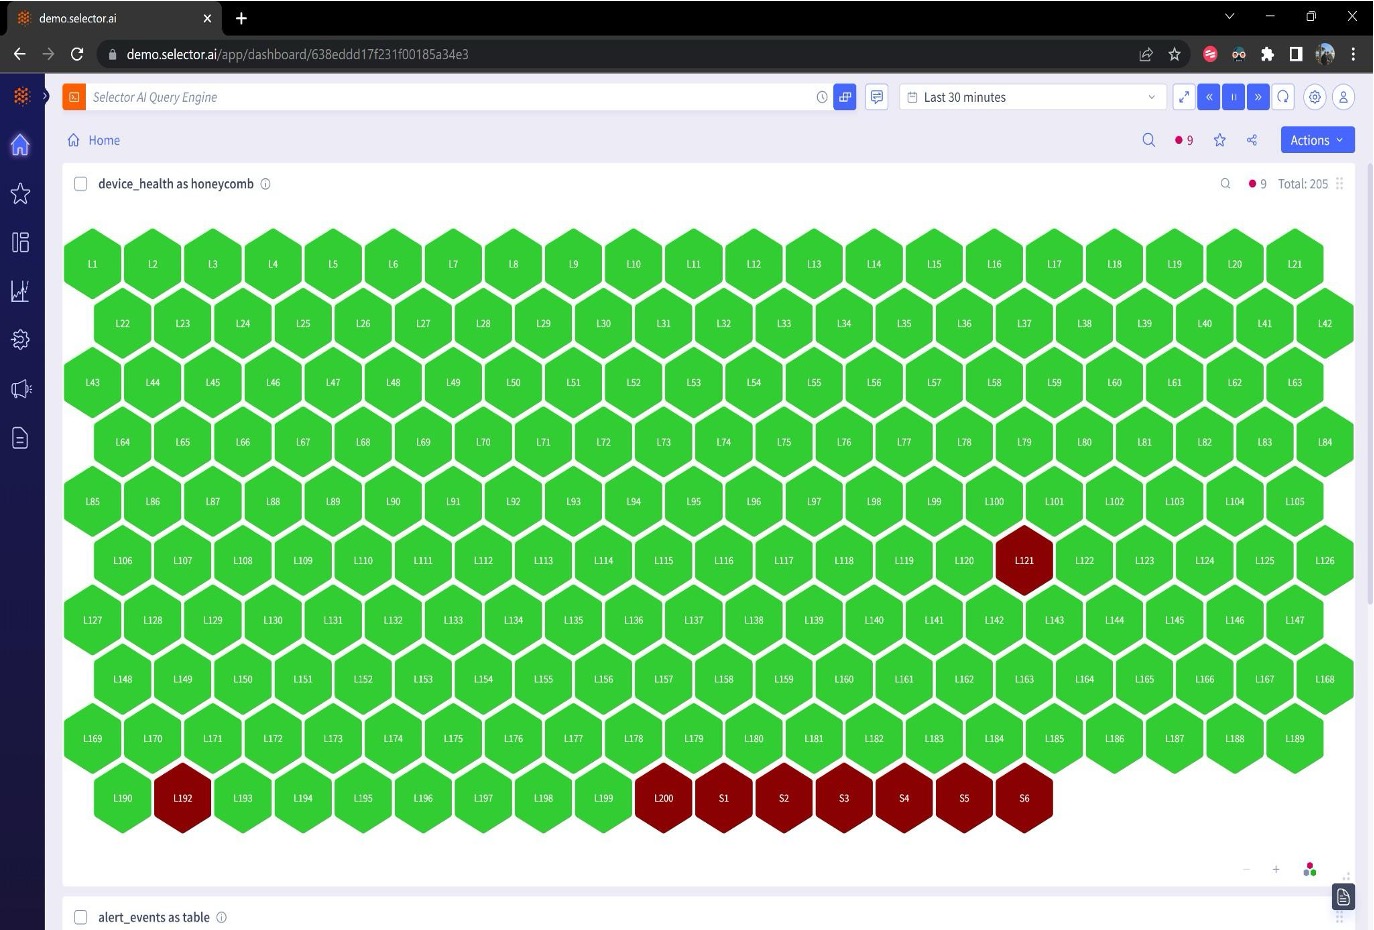
Once logged in, users are taken to the Home Dashboard. The home dashboard serves as the central hub or starting point for users with the following goals in mind:
Data visualization—The home dashboard visually presents essential data and metrics in a consolidated and easy-to-understand format. It allows users to monitor and analyze important information at a glance, providing a snapshot of the current status and performance of various aspects of their operations.
Personalization—The home dashboard can be customized based on user preferences and roles. Users can select and arrange widgets or modules according to their specific needs, ensuring that the most relevant and important information is readily available.
Quick access to features—The home dashboard includes shortcuts that allow users to access frequently used features or perform common actions with just a few clicks. It provides a centralized location for users to navigate to different areas of the software quickly, streamlining their workflow and saving time.
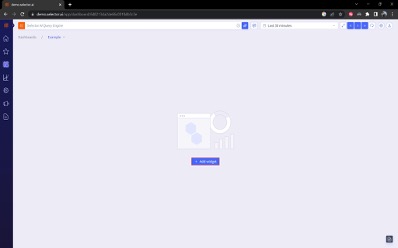
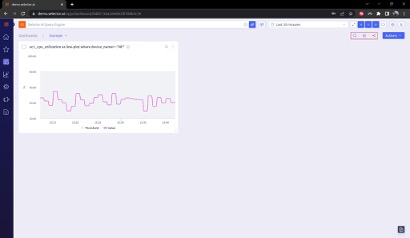
The S2 home dashboard looks like this:
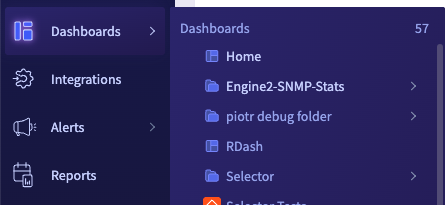
The Main Menu is on the left side of the interface. The main menu serves as the primary navigation tool, providing users with access to various features and modules within the software.
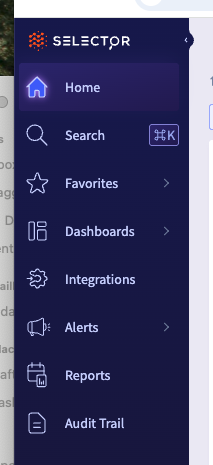
From top to bottom, the main menu item icons are:
Home—The home link always brings users back to the home dashboard.
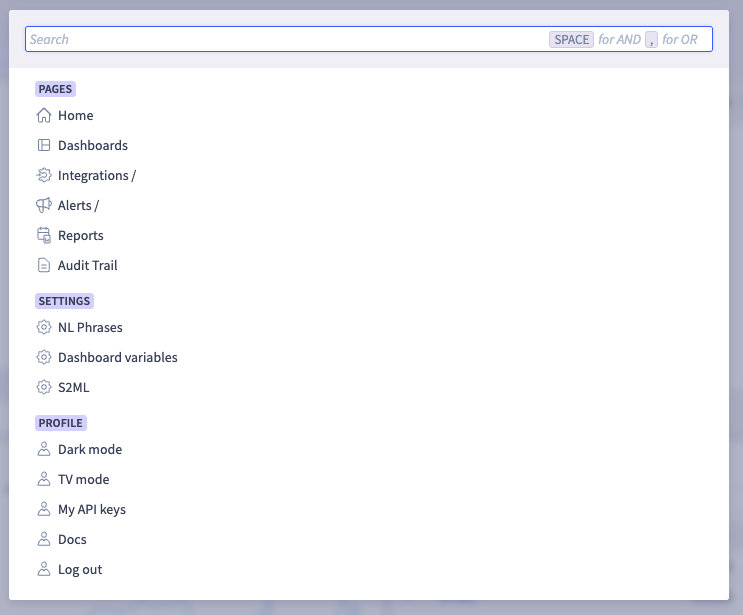
Search–This lets users search for words and phrases that are used in various dashboard and widgets. You can search for pages, settings, or profiles.
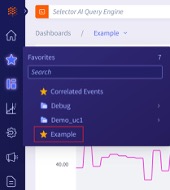
Favorites—The Favorites link will display a list of dashboards which have been marked as “favorite” from the dashboard configuration screen, as shown below.
Dashboards—The dashboards link will provide users with a list of all configured dashboards. You can designate a dashboard as global. If a dashboard is configured as global, all users of the S2 platform can view that dashboard. Dashboards can be grouped into folders.
Forecast—This takes users to the S2 platform’s Forecast Dashboard. NOTE: Generally, this dashboard is unused until the user’s S2 environment has moved well into the correlation phase of their deployment and baselined trends have been established.
Integrations—This takes users to the integrations interface. From there, the S2 platform integrations can be defined, adjusted or tested.
Alerts—This provides users with a list of various alerting sub-menus. Each of the following are covered in detail later:
Rules
Events
Suppressed Events
Incidents
Maintenances
Acknowledgements
Reports—This takes user to a series of reports that are available.
Audit—This takes users to a dashboard populated by the Audit Logs widget. This widget displays all user-driven platform events such as logins, updates, item creations (such as widgets, dashboards, notification providers, and so on), as well as screen captures.
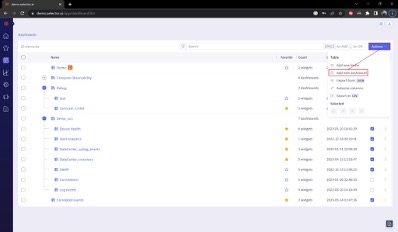
The dashboards interface lets users create, modify and delete dashboards. This interface also allows users to designate a dashboard as a “Favorite” dashboard.
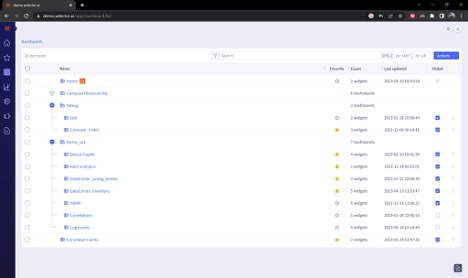
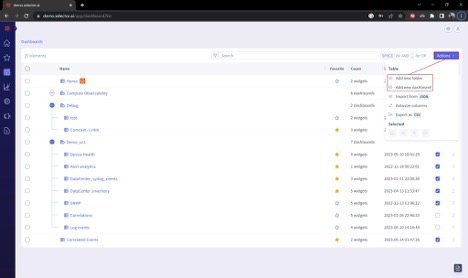
The Actions icon at the top right of the dashboards page gives the user a list of possible actions.
To create a new dashboard, select Add new dashboard. To create a new Dashboard Folder, select Add new folder.
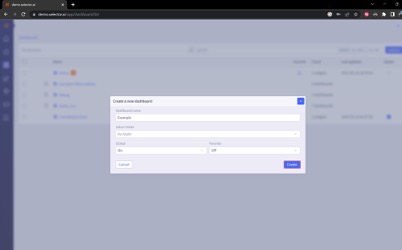
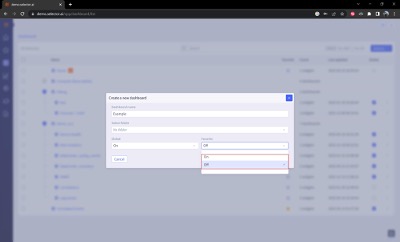
To create a new dashboard, follow the steps below:
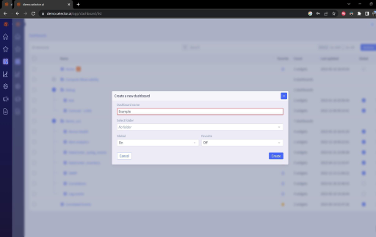
In this case, the name is Example.
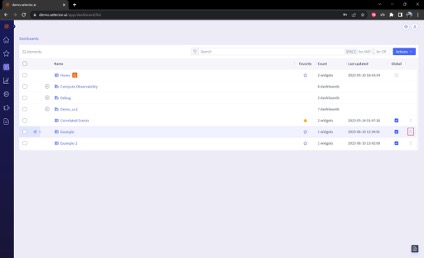
If the creation is successful, a message appears at the top right of the screen to confirm the creation of the new dashboard:
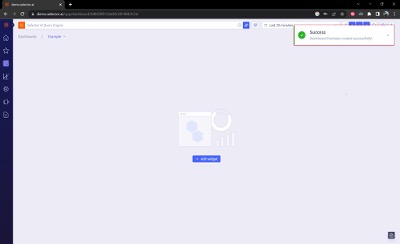
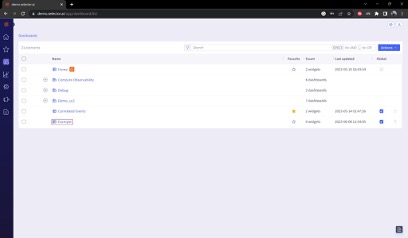
The new dashboard (Example) appears in the dashboard list:
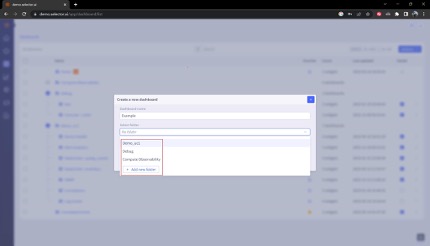
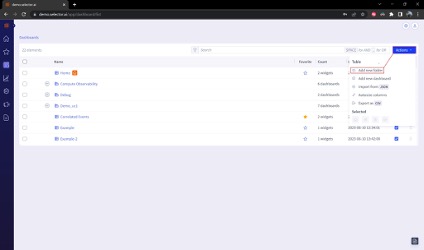
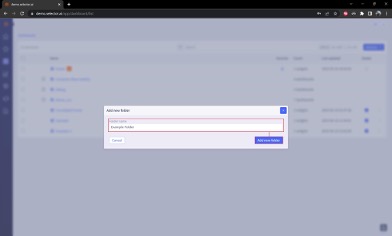
You can create new dashboard folders as part of the dashboard creation workflow. A new dashboard folder is created by navigating to the dashboard list, selecting Actions at the top right of the dashboard interface and then selecting Add new folder:
A dialog box prompts the user to enter the folder name. Enter the name and then click the Add new folder button:
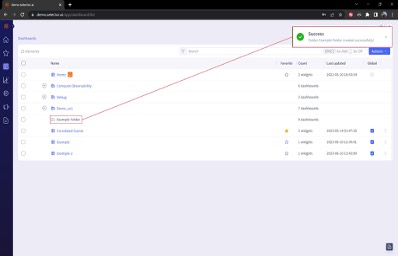
If the new folder was successfully created a confirmation message appears and the new folder appears in the dashboard list. Dashboards can be created in the folder directly or existing dashboards can be moved into that folder by adjusting their configuration properties:
If you want to change a dashboard’s configured name, folder membership, global or favorite setting, first navigate to the dashboard list and locate your dashboard.
Hover the mouse over the left side of the list to reveal a slide out list of options:
To modify the dashboard’s configuration settings, select the Edit option to display the dashboard’s details:
The following options can be changed:
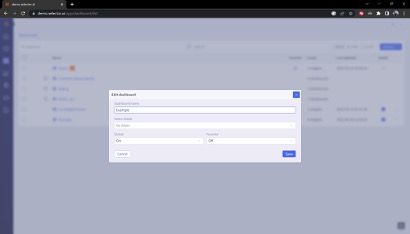
When the changes have been entered, click Save.
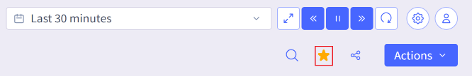
The Dashboard interface provides three quick actions:
A dialog box containing a text prompt appear after clicking the Page Search icon:
Enter the search criteria and press Enter. Note that SPACE is used to combine terms with for AND. A comma (,) is used to combine terms with an inclusive OR.
For example, to search for CPU and memory, enter CPU memory.
To search for CPU or memory, enter CPU,memory.
This is not an exclusive OR (XOR).
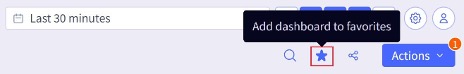
Clicking the Add Dashboard to Favorites icon adds the current dashboard to the Favorites dashboard list:
Once added, the blue star turns gold:
The added dashboard now appears in the list of dashboards on the Favorites menu:
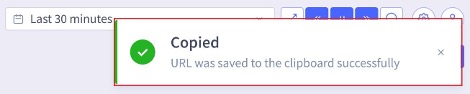
Clicking the Share Dashboard quick action icon copies the URL of that dashboard to the system’s clipboard.
Once the Share Dashboard quick action icon has been clicked, a message appears confirming that the URL for the dashboard has been copied to the system’s clipboard.
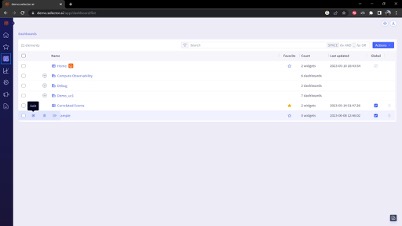
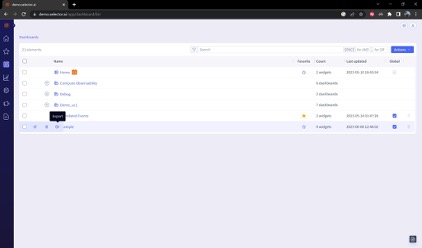
Dashboards can be moved up and down in the dashboard list by clicking on it, then dragging up or down on the dots associated with the dashboard:
Dashboards can be exported in two formats: JSON and CSV. To export a dashboard to either format, navigate to the dashboard list, locate the dashboard in question, and hover your cursor over the left side of the entry. Then click on the Export icon on the right side of the slide-out menu, as shown below:
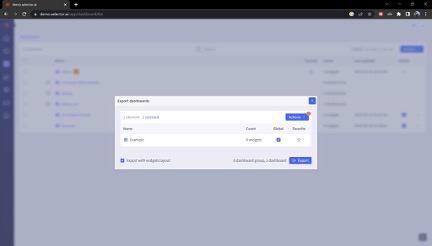
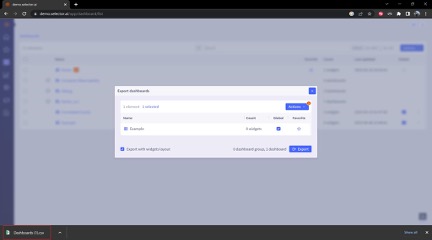
Once the Export option has been clicked, the Export Dashboards panel appears:
At this point, the Actions button provides two options:
These options are shown below:
When the Export as CSV option is clicked, a CSV file is downloaded:
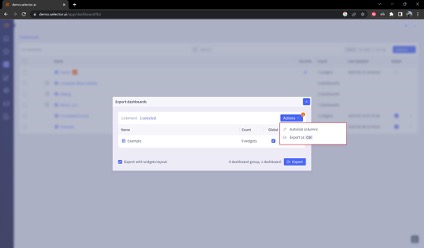
When exporting the dashboard as a JSON file, there are two configuration options defined:
Additionally, you can select specific widgets from a dashboard. There is also a checkbox allowing preservation of the widget layouts (boc=x on lower left):
After the configuration options have been selected, click the Export button to export the JSON file:
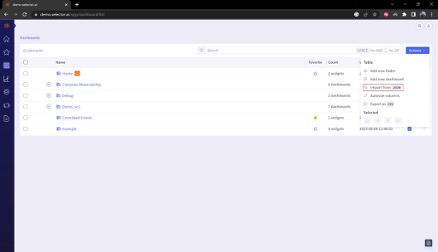
To import a dashboard JSON file, navigate to the dashboard list, and click the Action button at the top right of the display. Then click Import from JSON:
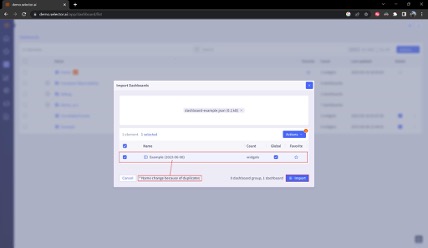
A dialog box appears. Click Upload File:
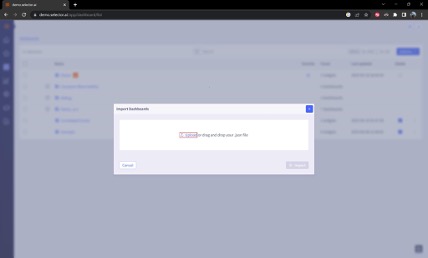
The dialog updates automatically. The dialog box allows modification of the Global and Favorite setting of the dashboard. Update these and then confirm that the correct file is selected. Note that because we are importing a dashboard named Example, which already exists, a message appears informing the user that the name of the widget is updated to include the import data in its name. Once everything looks correct, click Import:
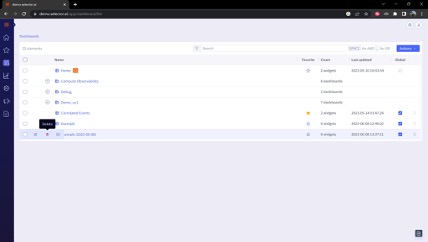
To delete a dashboard, navigate to the dashboard list and locate the desired dashboard. Hover over the left side of the dashboard name and select Delete, as shown in the following:
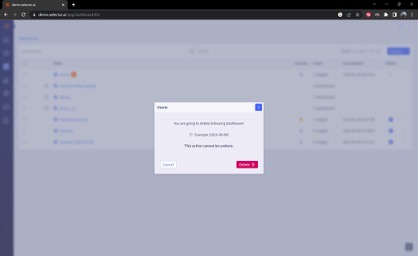
A new dialog box appears confirming the name of the dashboard to be deleted and warning the user that the deletion action cannot be undone. After verifying that the correct dashboard has been selected, click Delete:
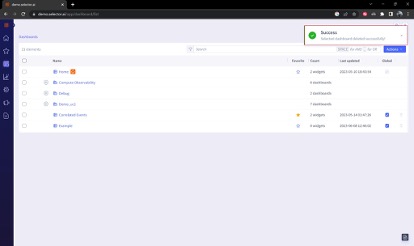
A message appears informing the user that the deletion was successful. The deleted dashboard no longer appears in the Dashboard list:
The Actions menu of the dashboard interface provides a list of user actions related to dashboards:
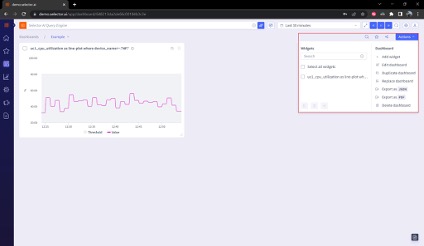
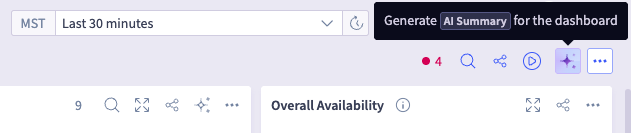
One of the things you can do for dashboards and some other levels like syslogs, is to quickly generate an AI summary of the dashboards and widget (and syslogs) in an easy-to-read format, This allows a users to see a fast summary of conditions with a lot of drilldown into details. The text appears in the right margin of the screen.
Invoke the AI summary feature by clicking the Generate AI Summary button near the dashboard actions menu:
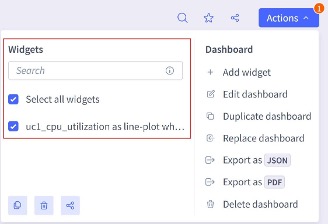
The Actions menu provides two possible sets of actions:
Both are shown below:
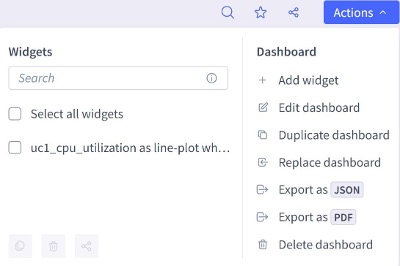
Dashboard widgets must be selected to modify them. To select widgets, click the checkbox by the desired widget. Once the widget’s checkbox is checked, a small exclamation mark will appear on the Actions menu icon;
Clicking the Actions button reveals the Actions menu. Note that the widget has been selected, The All widgets checkbox is selected as well because it was the only widget in the dashboard:
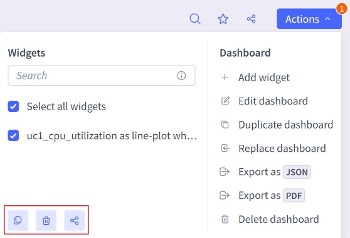
Once a widget selection has been made, three icons appear at the bottom left of the Actions. These are, from left to right:
Copy widget
Delete widget
Share widget
These widget actions are covered in detail below, in the Working with Widgets section.
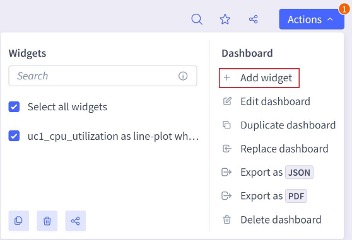
The first option in the list of dashboard actions is add widget. Clicking this option opens the Query Builder interface to create the widget. Once created, the widget can be added to the dashboard. This addition is covered in the Widgets and Dashboards section.
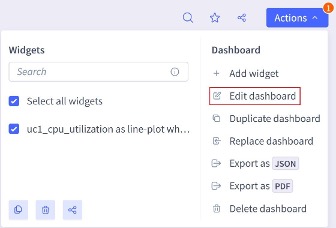
The second option in the list of dashboard actions is Edit dashboard. This selection opens the dashboard configuration interface. Use of the dashboard configuration interface is covered in the Modifying Dashboard Configuration Settings section:
The third option in the list of dashboard actions is Duplicate dashboard. This selection opens the dashboard duplication interface:
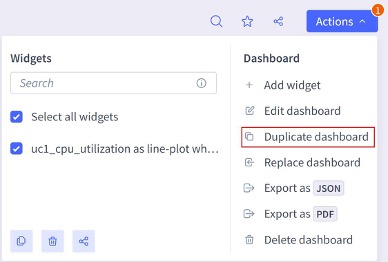
The dashboard duplication interface allows the user to create a new copy of the current dashboard. The user enters the new name (in this case the new name is Example-2), selects a dashboard folder (if required) and configures the Global and Favorite settings:
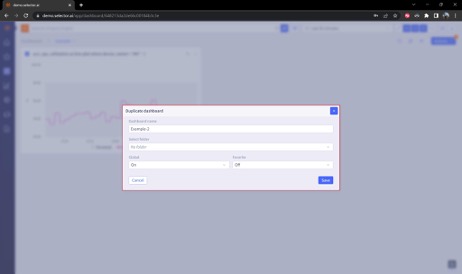
When the configuration for the destination dashboard is complete, click Save:

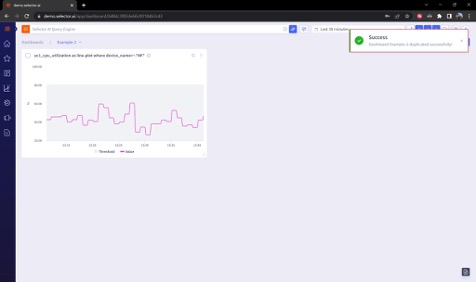
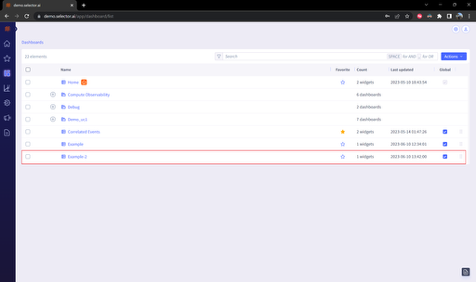
A message appears confirming the creation of the new duplicate dashboard:
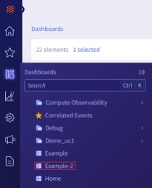
The new dashboard can now be viewed in both the dashboard list and dashboard menu (in this case, Example 2):
This part of the S2AP Operations Guide describes the fundamentals of widget operation for the S2AP platform from Selector AI Software. The part of the guide is divided into several major parts:
Some related features, such as dashboards and maintenance windows, are covered in other documentation. Links to these documents are provided where appropriate.
Widgets provide the representation and abstraction of data ingested by the S2 platform. By default, unless the dashboard was imported from a JSON configuration file, a new dashboard contains no widgets.
To create a widget, navigate to the empty dashboard and click the Add Widget button: