Selector S2AP Operations Guide - Integrations and Alerts
Selector Software Operations Guide - Part 3
This part of the S2AP Operations Guide describes the fundamentals of alert handling for the S2AP platform from Selector AI Software.
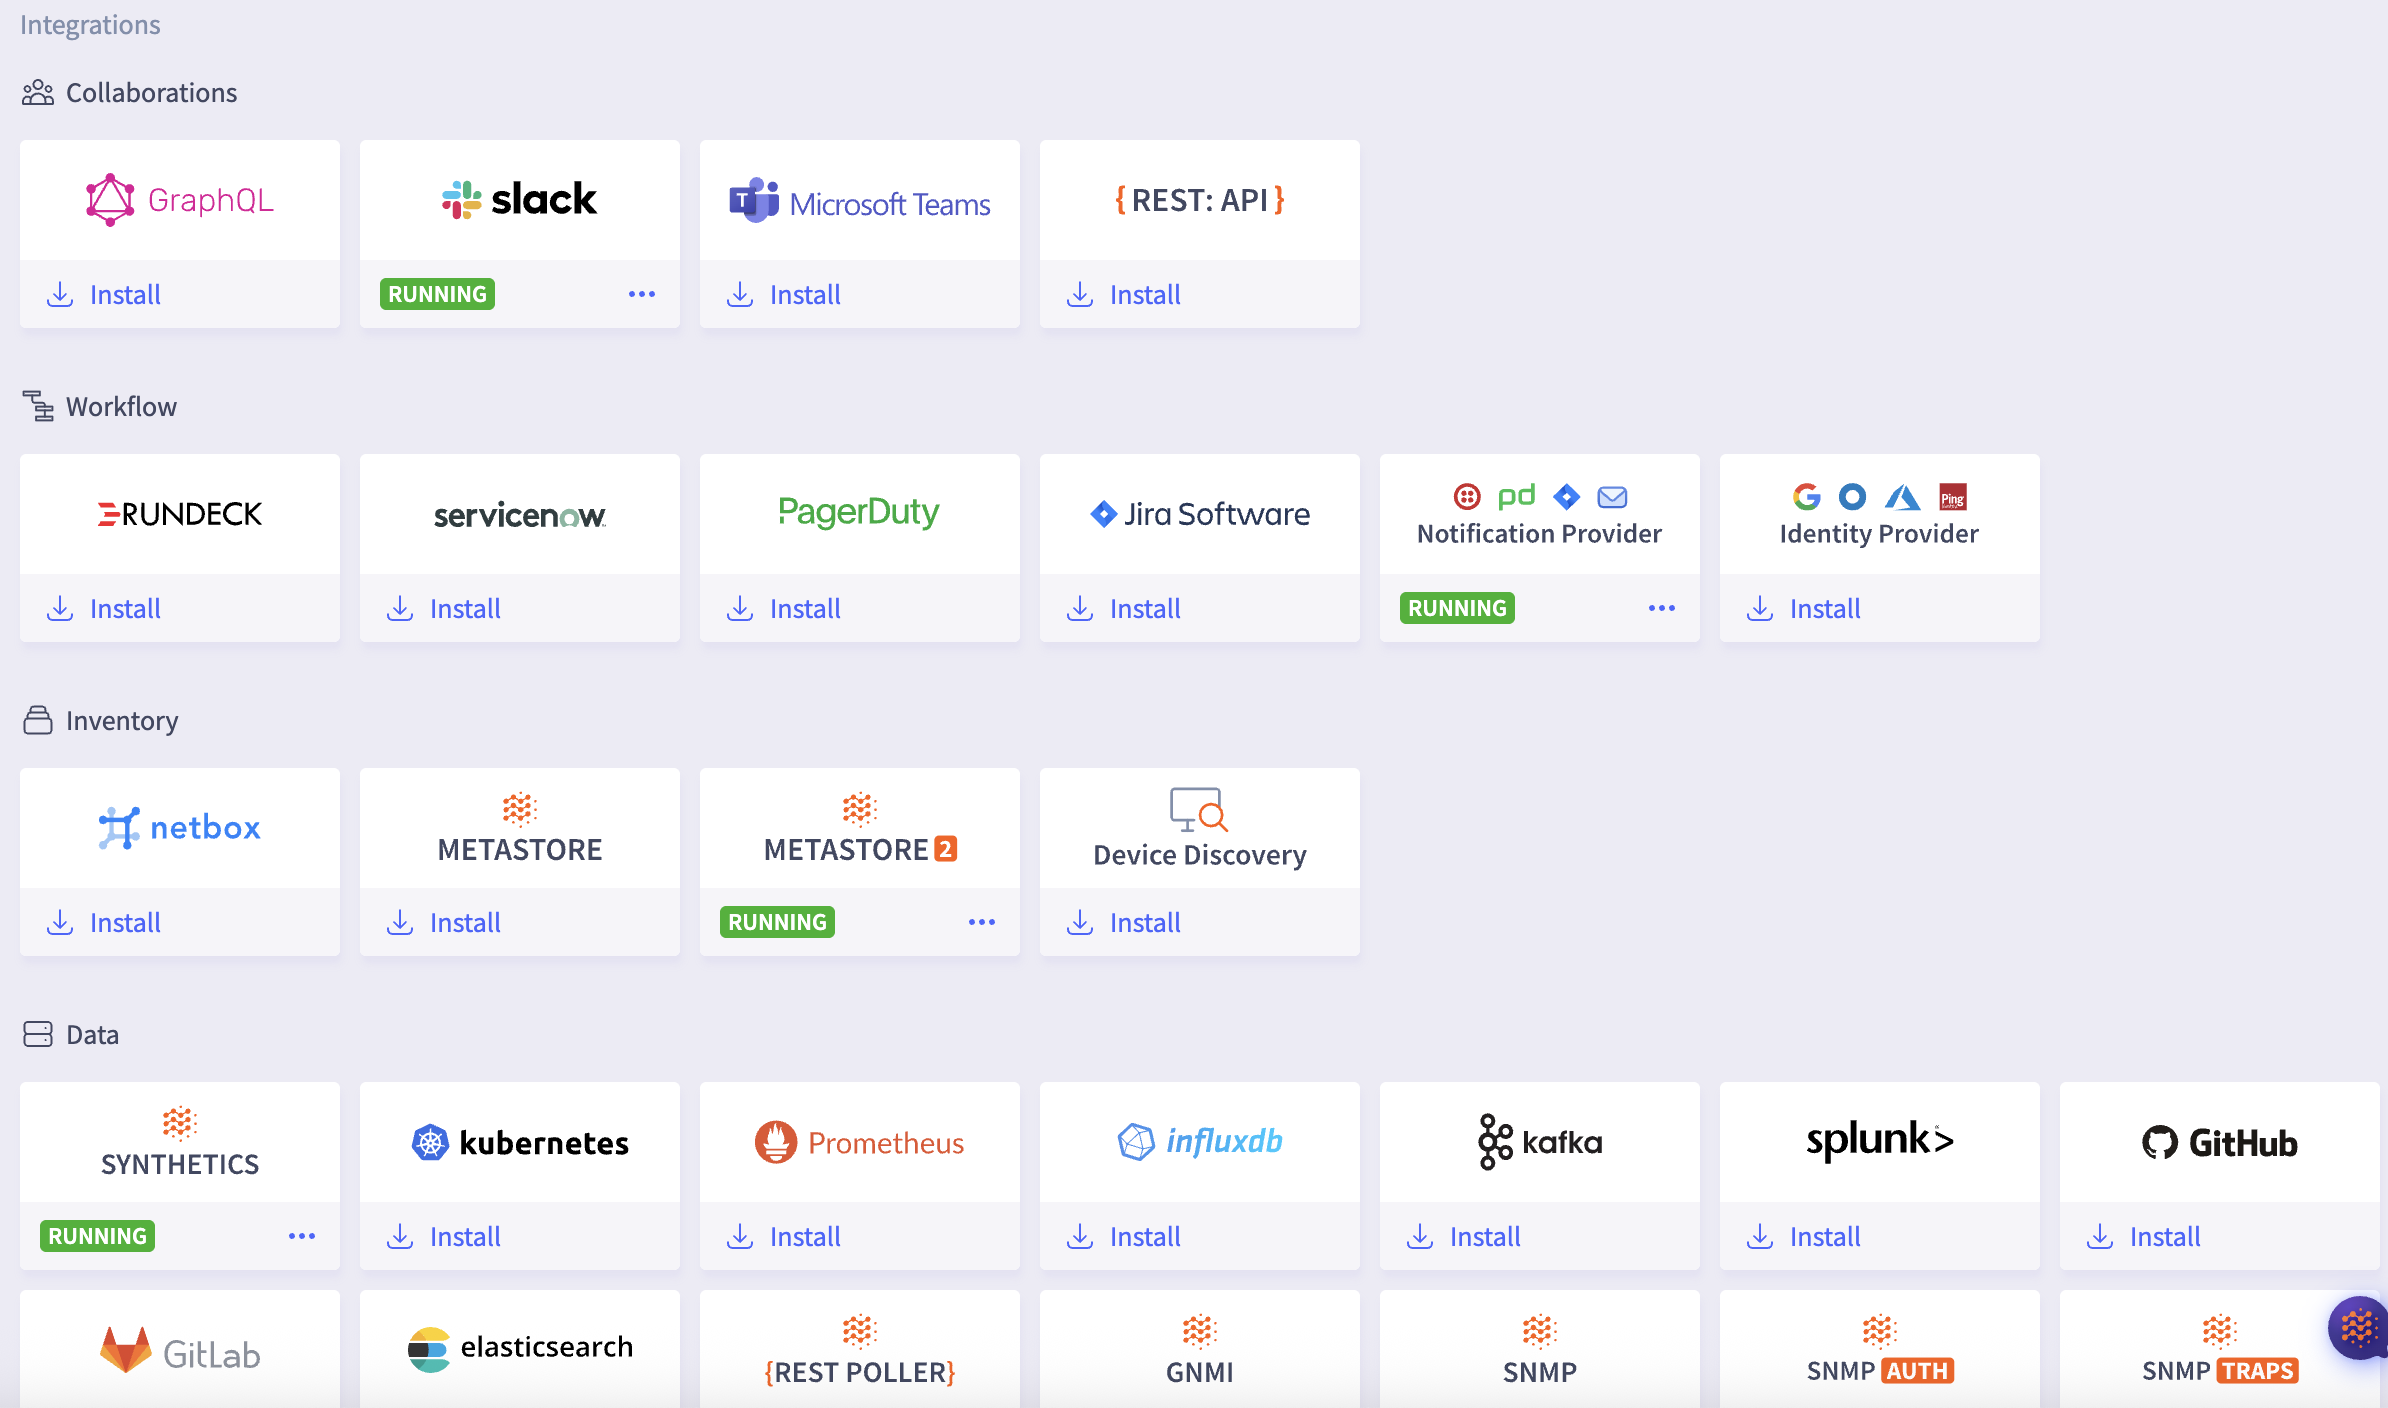
There are various integrations which provide the necessary linkage for the S2 platform to ingest data from your infrastructure. These integrations can be added, configured, tested, or removed. Integrations comprise the backbone of the S2 platform because they are the data ingestion points for the entire solution.
For more information on Selector Software integrations, see yhe following:
The Alerts Interface
This section explores the alerting configuration of the Selector UI. This section is composed of six sections, each of which is covered in depth in this section:
- Creating Alert Rules: Establish the rules used for alerts
- Modifying Global Alert Settings
- Alert Events: Alert IDs and incidents
- Suppressed Alert Events: When to ignore alert conditions
- Alert Incidents: How alerts become events and incidents
Creating Alert Rules
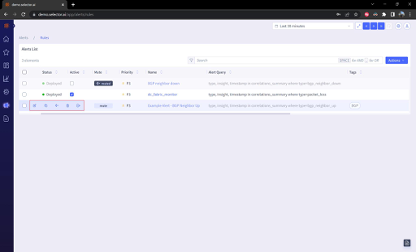
The alert rules interface allows you to create, import, export, copy, modify, mute, and delete alerting rules:
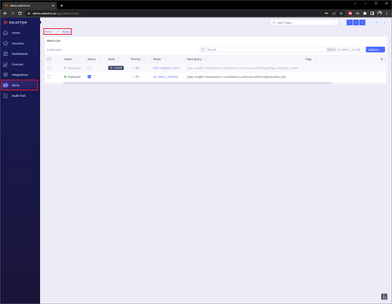
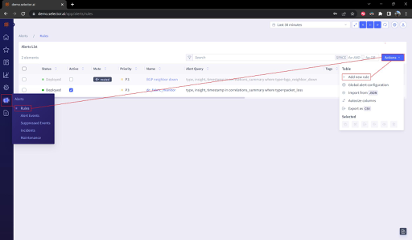
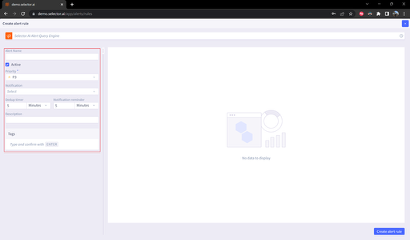
To create a new alert rule, navigate to the Alerts menu and click Rules. Then click Actions and select + Add new rule:
The following settings need to be defined in the Alert Rule Builder:
- Alert Name
- Alert State (Active/Inactive)
- Alert Priority
- Notification
- Dedup Timer
- Notification Timer
- Description
- Tags
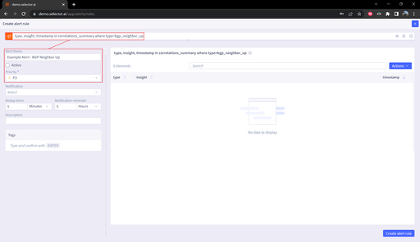
For example, consider the following S2QL query:
type, insight, timestamp in correlations_summary where type=bgp_neighbor_up
For this example, the alert name is Example Alert - BGP Neighbor Up. The alert is set to inactive for the time being until the alert has been built and has been confirmed to be correctly configured. Note that by default, new alerts are set to Active.
Alert priorities range from P1 (highest) to P5 (lowest). This example alert is given the default priority of P3:
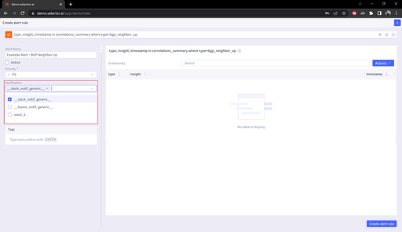
Next, define the notifications setting by clicking the Notifications dropdown menu and selecting the relevant notification provider for the alert. The notification providers are configured in the Integrations interface under the Notification Provider Integration under the Workflow Integrations section.
Note that multiple notification providers can be selected in the alert rule configuration. For this example, the slack_notif_generic___ notification provider is selected:
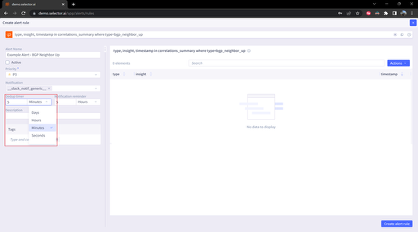
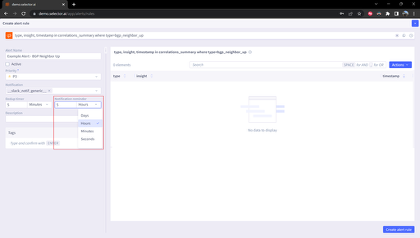
Next, in this example, the Dedup Timer is set to 5 minutes. The data deduplication timer (dedup timer) is used to eliminate redundant data generated during an alert, cutting down on processing and storage requirements and improving efficiency. Duplicate alerts are ignored during this time period.
The following time settings can be used for the Dedup timer:
- Days
- Hours
- Minutes
- Seconds
In this example, the Notification timer is set to 5 hours. The following time settings can be used for the Notification timer:
- Days
- Hours
- Minutes
- Seconds
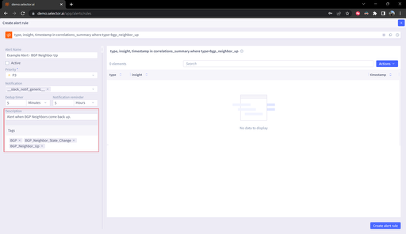
You also need to define the description and any desired tags. For this example, the description is Alert when BGP Neighbors come back up.
The following tags are used for this alert rule:
- BGP
- BGP_Neighbor_State_Change
- BGP_Neighbor_Up
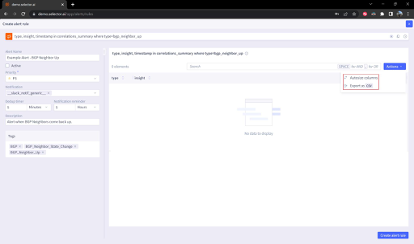
Note that there is an Actions button at the top of the Alert Rule Builder interface. If the alert rule creates an output in the Alert Rule builder, two options are provided by the Actions button:
- Auto-size columns
- Export as CSV
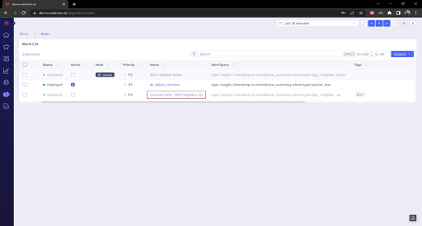
When all the parameters have been set, click the Create Alert Rule button at the bottom of the Alert Rule Builder interface. This returns the user to the Alert Rules interface. The new Alert Rule appears on the list of alert rules:
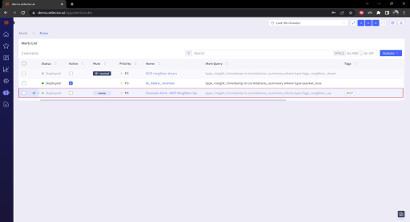
Note that there are two columns indicating the state of the alert rule:
- Active
- Mute
Both settings can be modified directly from the Alert Rules interface.
Working with Alert Rules
Hovering over the left of an alert rule reveals a slide out menu containing the following options:
- Edit
- Copy
- Mute
- Delete
- Share
Editing an Alert Rule
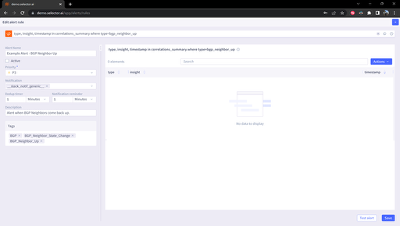
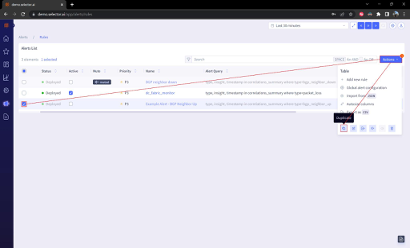
You can edit an alert rule by hovering over the left of the alert rule and clicking on the Edit icon:

The Alert Builder interface opens and all of the alert rule properties can be modified:
You can also edit a rule using the Actions Menu in the Alert Rules interface. To do so, check the box to the left of the desired alert rule, click the Actions button at the top of the Alert Rules interface. Then select Edit on the Actions Menu:
Duplicating an Alert Rule
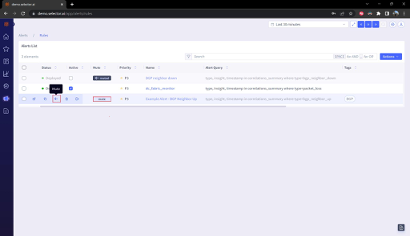
To duplicate an alert rule, hover over the left side of the alert rule in question and select the “Duplicate” icon:

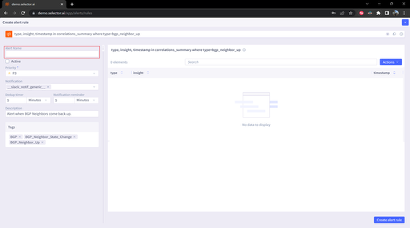
The Alert Builder interface opens to allow the configuration of the duplicated alert. By default, no alert name is specified, and all settings are inherited from the source alert rule:
Note that a rule can also be duplicated from the Actions Menu in the Alert Rules interface. To use this method, check the box to the left of the alert rule, click the Actions button at the top of the Alert Rules interface. Then click Duplicate from Actions Menu:
Muting an Alert Rule
You can “mute” an alert rule to prevent it from sending out notifications through the notification provider. There are several ways to mute and arlet rule.
One way to mute an alert rule is to hover over the left of the alert rule and select the Mute icon:
An alert rule can also be muted by clicking the Mute icon on the alert rule display.
A rule can also be muted from the Actions Menu in the Alert Rules interface. Check the box to the left of the desired alert rule, then click the Actions button at the top of the Alert Rules interface. Click Mute on the Actions Menu:
Alternatively, the notification provider configuration for the alert rule can be blank to mute the rule because the notification provider is not required to create an alert rule.
Deleting an Alert Rule
You can delete an alert rule if the rule is no longer needed. To delete an alert rule, hover over the left of the alert rule in question and select the “Delete” icon:
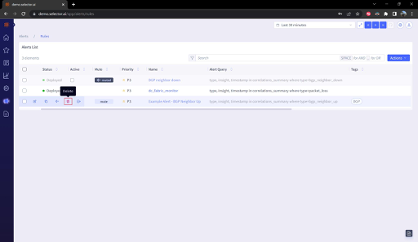
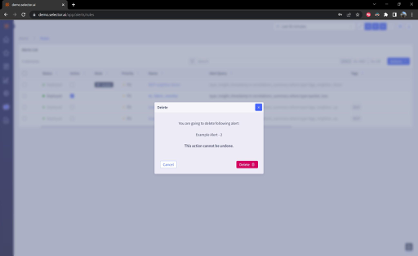
A dialog box confirms the alert rule being deleted and warns that the deletion of the alert rule cannot be undone. Click Delete to complete the deletion:
A success message confirms successful deletion of the alert rule:

You can also delete a rule from the Actions Menu in the Alert Rules interface. Check the box to the left of the alert rule, then click the Actions button at the top of the Alert Rules interface, Click Delete from the Actions Menu:
Exporting an Alert Rule
You can export an alert rule to be downloaded as a JSON file, or as a CSV file.
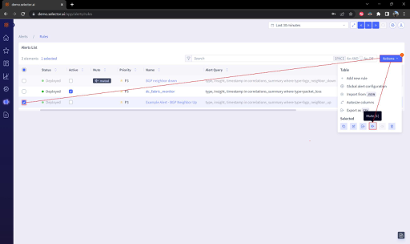
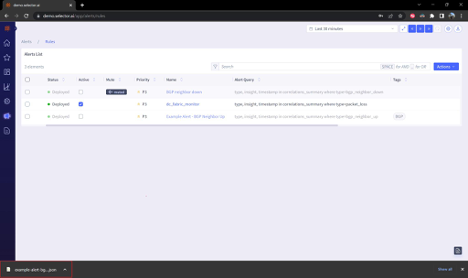
To export an alert rule as a JSON file, hover over the left of the alert rule and click the Export icon:

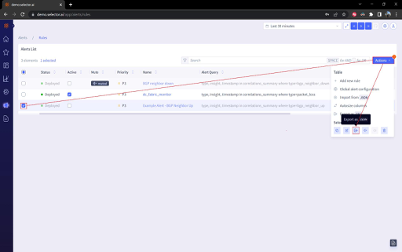
You can also export an alert rule as a JSON file from the Actions Menu in the Alert Rules interface. Check the box to the left of the alert rule, then click the Actions menu at the top of the interface. Click Export at the bottom of the Actions menu:
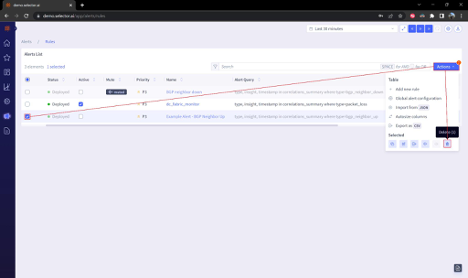
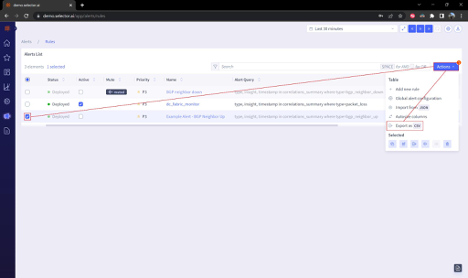
To export an alert rule as a CSV file, check the box to the left of the alert rule, then click the Actions button at the top of the Alert Rules interface. Click Export as CSV from the dropdown action list:
Testing an Alert Rule
There are several reasons to test an alert rule, such as for debugging, regulatory examination, UAT compliance testing, or to check for rule accuracy.
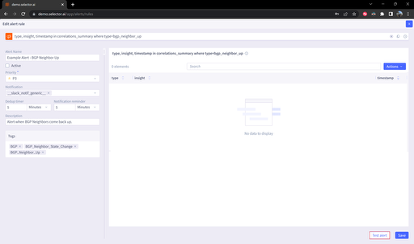
To test an alert rule, navigate to the Alert Rules interface and click the name of the alert rule:
Click the Test alert button at the bottom of the Alert Builder interface:
The alert rule test should take only a couple of seconds to complete. A success message appears confirming that a mock alert has been triggered:
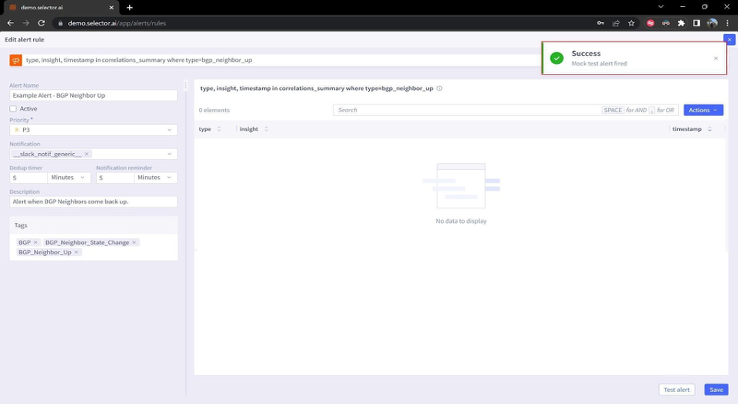
The results of the test are sent to any notification provider that has been configured on the system and applied to the alert rule. Check the relevant notification system and verify that the alert arrived as intended.
If any difficulties are encountered, or the alert rule test produces an error message, please bring this to the attention of the Customer Success Engineer assigned to your account. They troubleshoot the process with your account’s solutions engineer.
Modifying Global Alert Settings
There are two alert settings which are global in scope:
Dedup timer controls the dedup frequency
Notification reminder frequency
By default, these have a global configuration of 5 minutes and can be modified for the customer’s requirements.
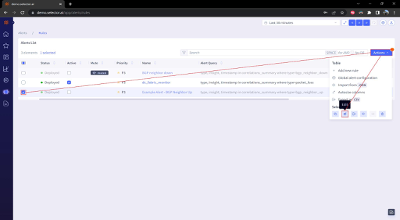
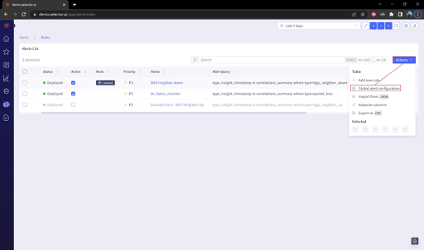
The alter these settings, click the Actions button on the Alerts List and select the Global alert configuration option from the dropdown list:
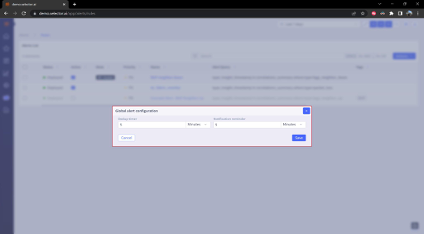
A dialog box will appear allowing Make your modifications to the Dedup timer and Notification reminder settings in the dialog box:
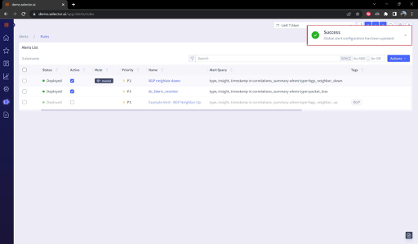
Update the values and click Save. A success message appears to confirm that the settings have been successfully changed:
Note that these defaults can be overridden for each alert.
Alert Events
The Alert Events dashboard captures and displays instances of the defined alert rules. The dashboard detects violations and initiates alert notifications. By default, the widgets in the Alert Event dashboard are manually configured and initially populated by your account’s Solutions Engineer.
The widgets in the Alert Events dashboard use the stacked-event-plot visualization by default:
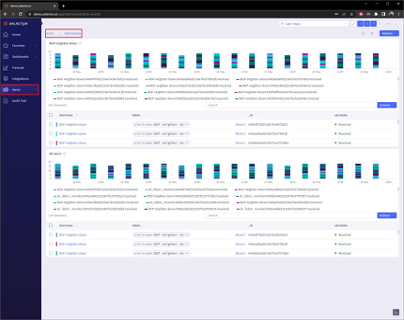
Alert IDs
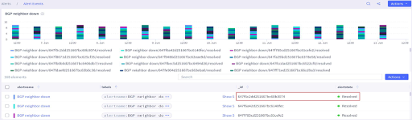
Every alert is given a unique alert ID. The alert ID is displayed In the stacked-event-plot widget along with the state of the alert (either firing or resolved):
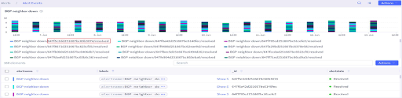
The same information is also displayed below the stacked-event-plot widget:
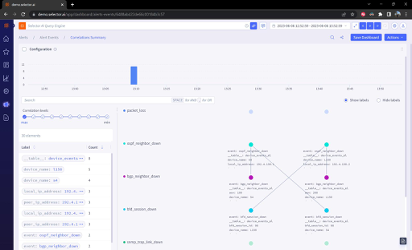
Clicking on an alertname in the stacked-event-plot widget displays the correlations page for that alert:
The correlations page displays additional events related to the displayed alert event. The correlations page operates on a displayed events confidence score. Initially, the interface displays only the events that have a 90% or high confidence score. The slider is used to display additional events with lower confidence scores for additional context:
Working with Alert Events
You can take several actions with the widgets on the Alert Events dashboard.
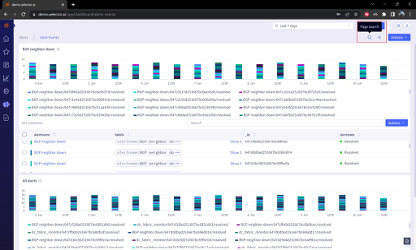
Two Quick Action buttons are at the top of the Alert Events dashboard:
- Page Search
- Share dashboard
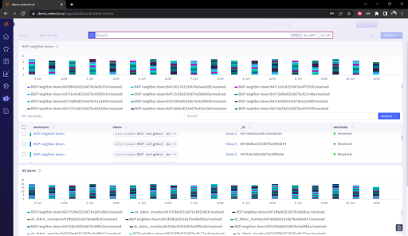
Clicking Page Search presents an input bar to enter search terms:
Hit Enter to start the search:
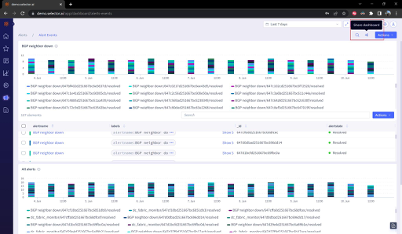
The other button, Share dashboard, allows you to share the dashboard’s URL:
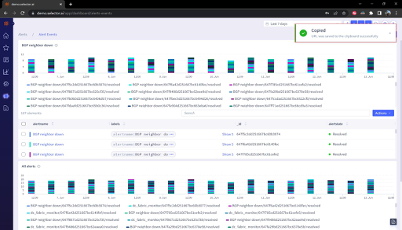
A success message appears confirming that the dashboard’s URL has been copied to the clipboard:
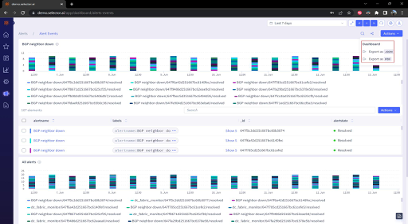
All dashboards are exported as a JSON file or a PDF file:
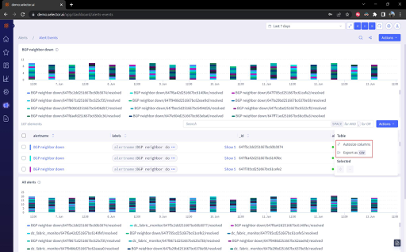
All widgets of this type can be auto-sized and exported as a CSV file:
Adding Alert Events to Incidents
Alert events can be added to an incident. An incident is a collection of events related to a specific larger scope issue (the incident) detected by the system.
More on creating and managing incidents is covered in the section Alert Incidents.
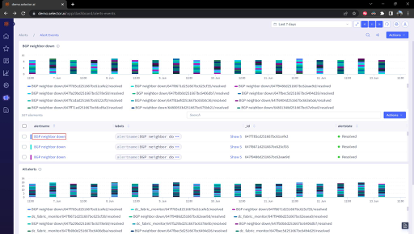
Consider a situation where numerous hosts go offline around the same time, and a configuration change was made which shut down a LAG port. All of these events can be added to an incident named Partial User Access Outage in Building 3.
The search bar built into this stacked event plot widget allows a search for a specific event.
For the situation outlined above, the example adds the top event in the list to an incident by checking the box for the desired incident. Then click the Actions button on the widget and select Add Widget:
The Add to incident button opens the Incident Builder interface. Configure this incident and then click the Create incident button:
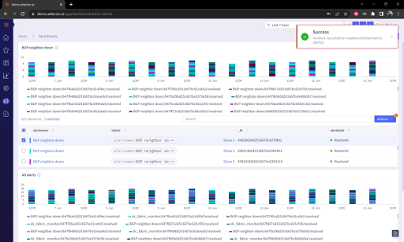
A success message appears confirming that an incident was created and the selected alerts were successfully added:
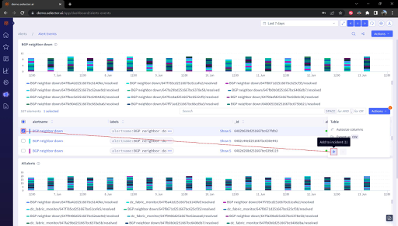
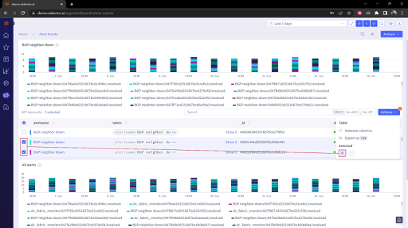
If adding an alert to an existing incident, the process is slightly different. In that case, select the alerts and then click the Actions button and select Add to incident:
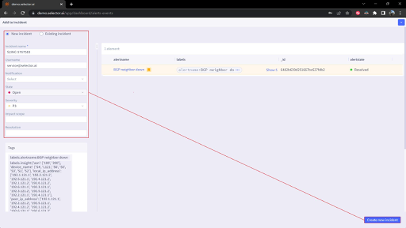
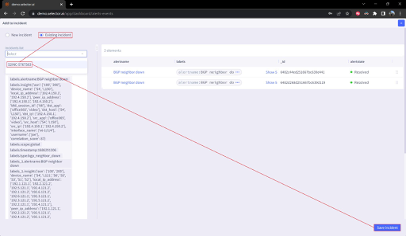
To add selected alert events to an existing incident, select the Add to existing incident radio button and then select the incident from the dropdown list. Then click Save incident:
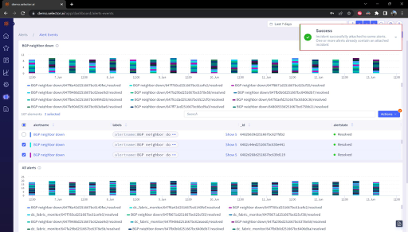
A success message appears confirming that the selected alerts were attached to the incident:
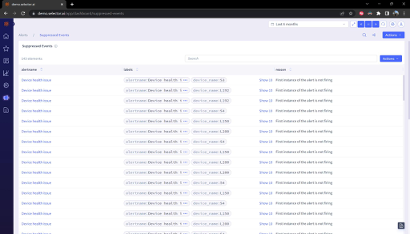
Suppressed Alert Events
The suppressed alerts interface displays a dashboard populated with widgets detailing information about suppressed alerting rules, usually due to a planned maintenance window or from alerts that have been muted:
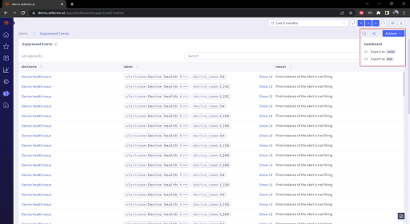
The Page search and Share dashboard quick action buttons are available. The dashboard also can be exported as either a JSON or PDF file.
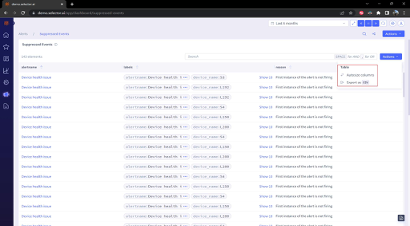
All widgets allow output to be autosized and exported to a CSV:
Alert Incidents
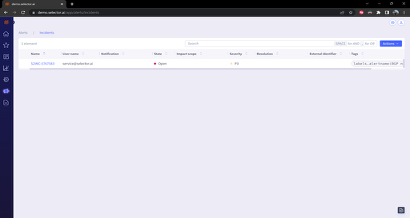
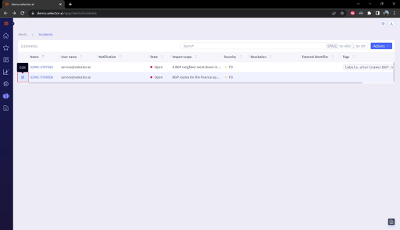
The Incident interface displays a dashboard populated incidents manually created in the S2 interface. Incidents allow alert events to be associated with a particular situation. The incident
Interface displays several key pieces of information about each defined incident:
- Incident name
- Username of the person who created the incident
- Notification
- State (open/resolved)
- Impact scope
- External identifier (ticket number)
- Tags (S2 labels)
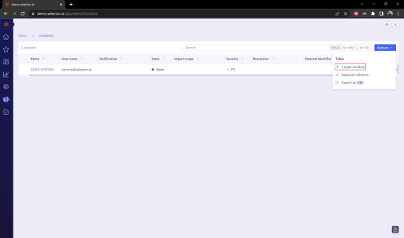
The incidents widget output can be autosized or exported as a CSV file from the Actions menu:
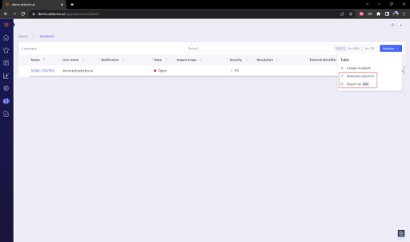
Creating a New Incident
Create a new incident by selecting New Incident from the Actions menu at the top right of the widget:
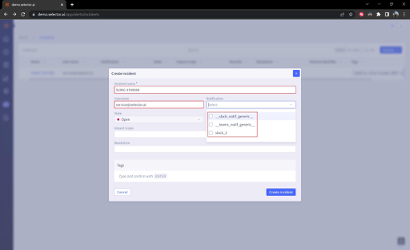
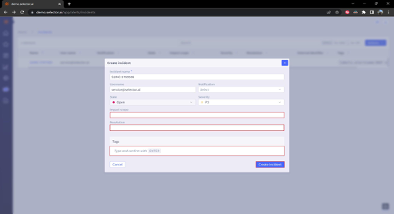
The Incident Builder interface appears, prompting the user to enter several pieces of information:
- Incident name
- Username
- Notification
- State
- Severity
- Impact Scope
- Resolution
- Tags

As you work your way through the incident creation interface, begin with the Incident name, Username and Notification. If your environment has a prescribed naming convention for incidents, make sure to follow that convention.
Enter the username of either the person who reported the incident or the person who created the incident (depending on your environment’s policies).
Select the appropriate notification provider from the dropdown menu:
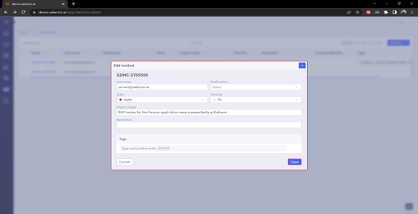
Then define the priority of the incident, P1 through P5, with P1 being the highest priority and P5 being the lowest. P3 is the default priority for new incidents. The alert state cannot be altered when creating an incident, this can only be changed once the incident has been created:
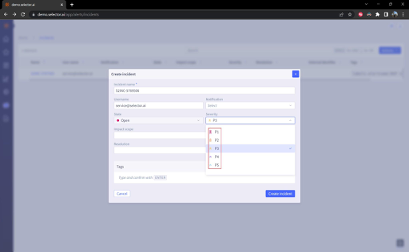
Next, enter the impact scope and, if applicable, resolution. Usually, the resolution is left blank during incident creation and updated during incident closure. Additionally, tags can be added during incident creation and if alert events are added to the incident. Tags (S2 labels) from the alert events will automatically be added to the incident’s tag (S2 label) list.
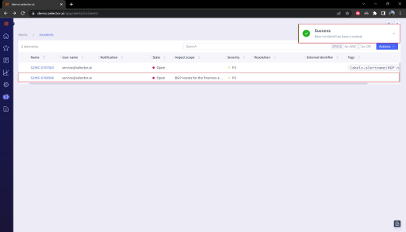
The Impact scope field is unique to the incident. For example, a phrase such as User access impacted for all users on the third floor of building 5 or BGP routes for the finances application were unexpectedly withdrawn are helpful to put the incident in context.
The Resolution field is normally left blank at incident creation (unless the incident is being created retroactively). An example of a resolution is Bouncing the router X3/0/0/1.100 interface caused the missing BGP routes to be announced correctly.
Finally, click the Create incident button:
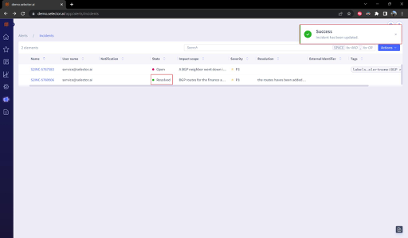
A message appears informing the user that the incident has been created successfully. The incident is added to the incident list:
Viewing Incident Details
By default, clicking on an incident name in the incidents list takes the user to a blank dashboard displaying the Add widget button:
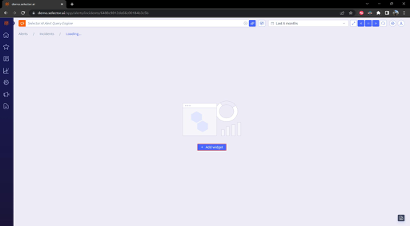
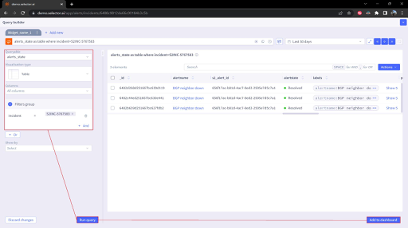
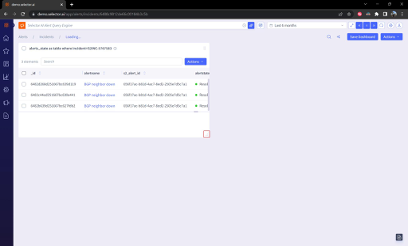
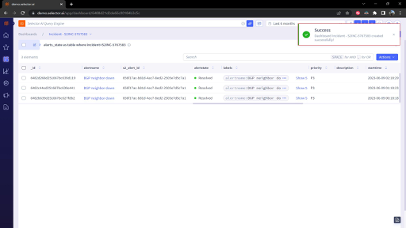
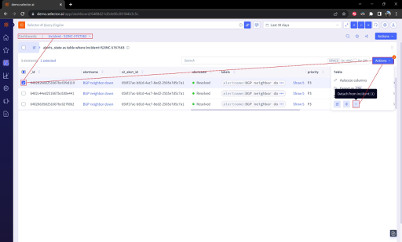
Clicking Add widget opens the Query Builder interface. The query is built with a table and a name. The alerts_state is a table where the incident is set to the incident_name. This directs the system to use the alerts_state KPI/metric and display it as a table. The output is filtered to only alert events that are attached to the desired incident. For this example, the exact query used is:
alerts_state as table where incident=S2INC-5767583
Click the Run query button and verify that the widget successfully displays the correct output.
When satisfied, click Add to dashboard:
A dialogue box appears displaying the S2QL query used for the widget and prompting the user to select the destination dashboard:
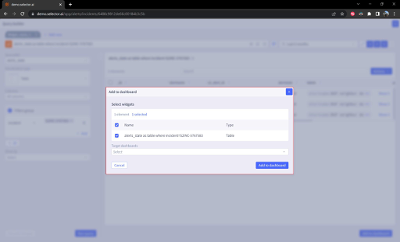
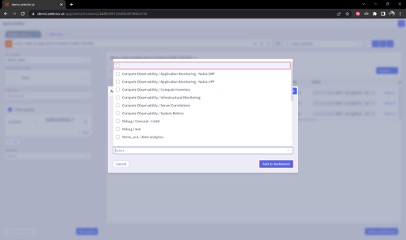
Click the Target dashboards dropdown menu and select the top entry (it will be blank), Then click the Add to dashboard button:
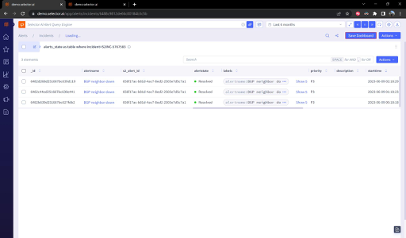
The new widget is visible in the incident’s dashboard. However, it will render at the default widget size. To adjust the widget’s size, click the dots at the bottom of the widget and adjust its size:
Once the size is adjusted, you can view the widget in its entirety. Once the dashboard is adjusted to your satisfaction, click Save Dashboard:
Enter details about the dashboard in the dialog box that appears. Enter dashboard name, dashboard folder (if required), global setting and favorite setting. Then click the Create button:
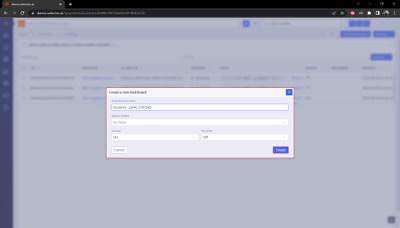
A message appears confirming successful creation of the dashboard:
Modifying and Resolving an Incident
To modify or close an incident, click on the edit button to the left of the incident:
From the incident configuration interface, you can update any of the displayed settings or enter the resolution details and change the state of the incident to closed.
Click the Save button at the bottom right of the interface once updates are completed:
A success message appears confirming that the incident updates were successfully saved. Also, notice that if the incident was resolved, that state updates to resolved:
Remove an Alert Event from an Incident
There are two ways to remove an alert event from an incident:
- Using the alert event dashboard
- Using the incident’s dashboard
When using the Alert Events dashboard, there is a good chance that new alerts have occurred and are at the top of the list of alert events. This can make the desired alert events challenging to locate. Find the alert event ID from the list of alerts attached to the incident and use the widget’s search bar to find the specific alert:
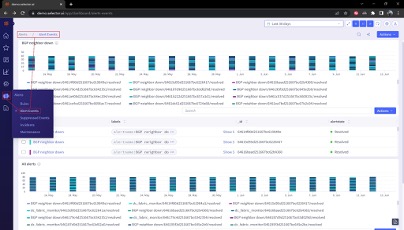
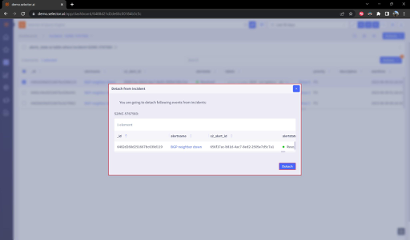
To remove the alert event, check the box to the left of the alert event. Next, click the Actions button on the right side of the widget and then click the Detach from incident button at the bottom of the dropdown menu:
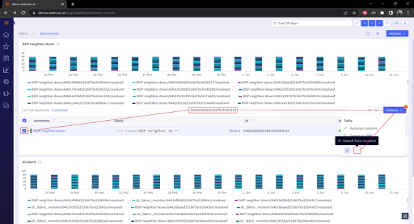
When using the incident’s dashboard, locate the desired alert event to be removed and check the box to the left of the alert event. Next, click the Actions button on the right side of the widget and then click the Detach from incident button at the bottom of the dropdown menu:
A dialogue box appears confirming the alert event removal from the incident. Verify that information is correct and click the Detach button at the bottom right of the interface.