Overview
These use cases are all based on documents that function correctly in proof of concept and other operational environments.
Many, but not all of these use cases, include figures and images of the use case in action.
This is the multi-page printable view of this section. Click here to print.
These use cases are all based on documents that function correctly in proof of concept and other operational environments.
Many, but not all of these use cases, include figures and images of the use case in action.

You can use SNMP to monitor both physical and virtual firewalls from Palo Alto Networks and Check Point.
The Firewall Console monitors both physical and virtual (logical) firewalls, providing comprehensive insight into firewall health and performance. Virtual firewalls, which run on physical devices, are monitored for key metrics such as Active Sessions, VSYS ID, and VSYS Name.
Selector leverages the Simple Network Management Protocol (SNMP) to monitor the key metrics of virtual and physical firewall instances. The following data points are collected for each firewall:
The Firewall Console continuously polls the SNMP Management Information Base (MIB) values in the next sections to determine the health status of the virtual and physical firewalls.
This document includes only values for Palo Alto Networks and Check Point devices, which are used in the examples. SNMP OIDs are readily available for other firewall devices.
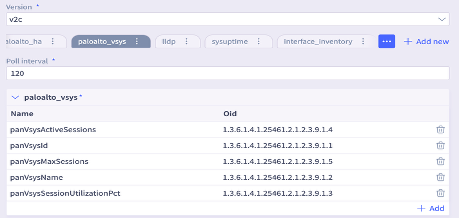
Here are the relevant Object Identifiers (OIDs) for Palo Alto Networks devices.
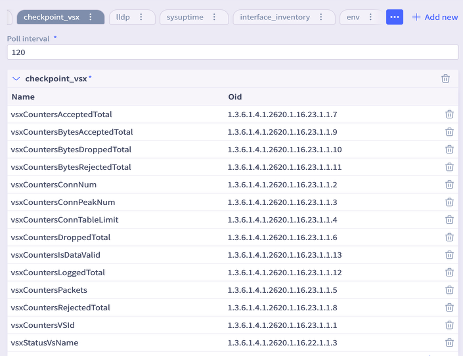
Here are the relevant Object Identifiers (OIDs) for Check Point devices.
The Firewall Console dashboard provides a comprehensive view of all physical and virtual firewalls in the environment. This global overview includes the following key information:
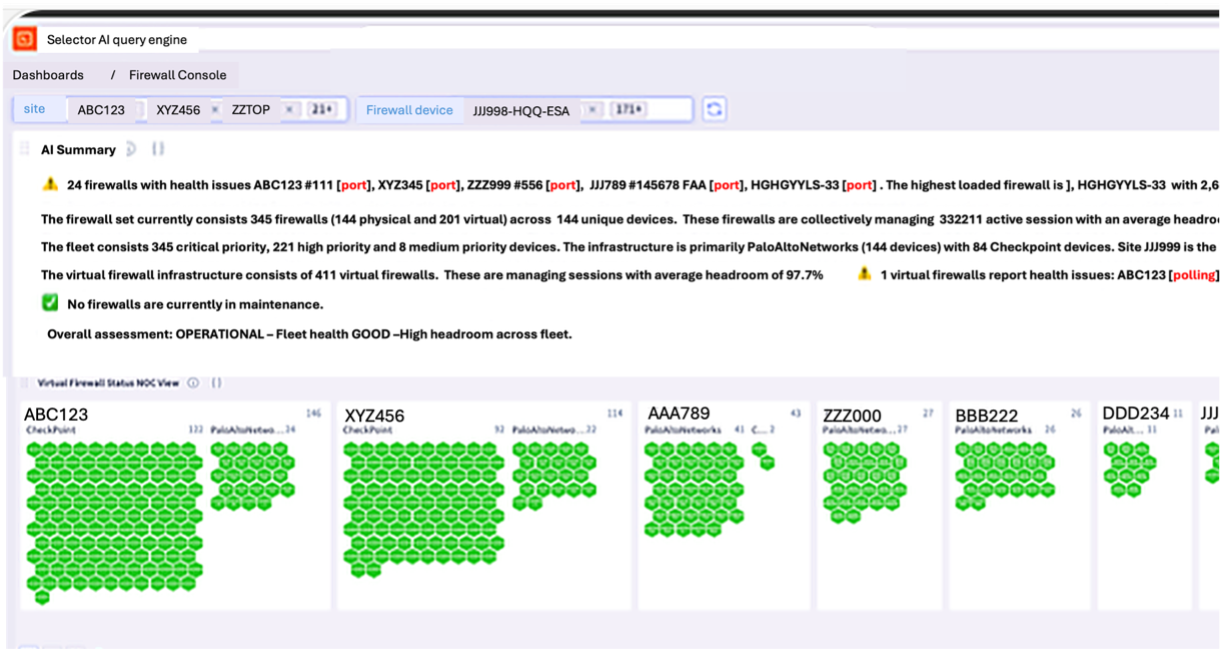
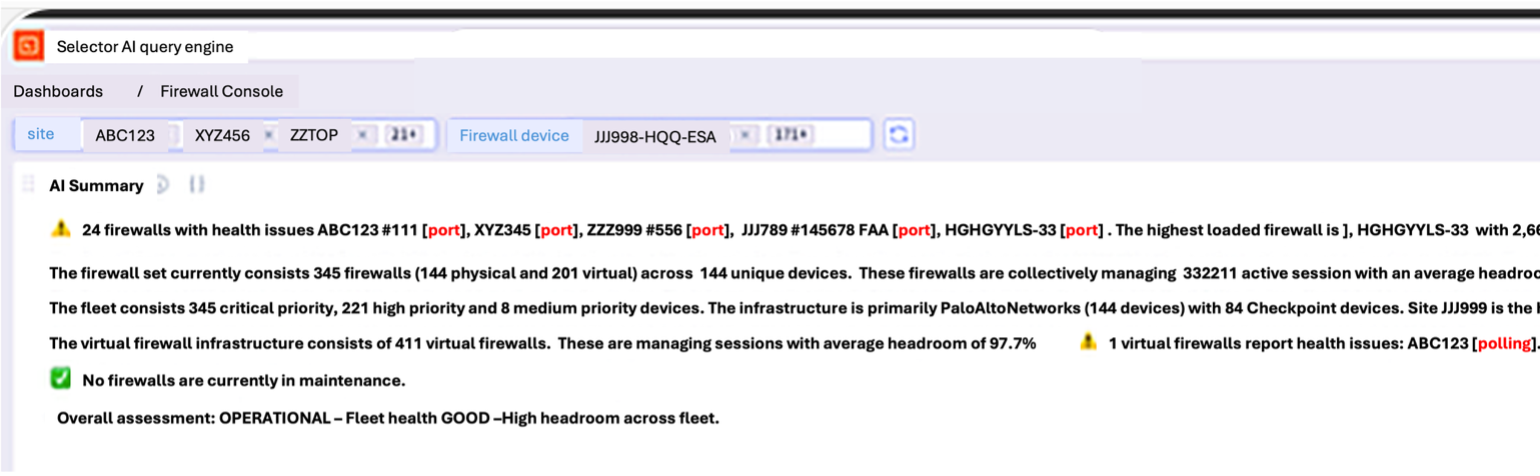
The AI Summary delivers a clear, plain-English overview of the entire dashboard, covering all physical and virtual firewalls. The summary also flags any firewall with violations and provides details. This AI summary eliminates the need for admins to perform multiple drilldowns or excessive clicks. To view specific data, use the filter at the top to select the desired name or firewall.
The Virtual Firewall widget provides a honeycomb view of the status of all Virtual Firewalls grouped by type of firewall: Palo Alto Networks and Check Point in this example.

Note on Alerts: A new alert is created when a virtual firewall instance goes into “Red” status for the first time. This alert is generated only if the individual virtual firewall or parent physical firewall is not in a maintenance window.
Users can also drill down into individual firewall instances to view additional details, such as the physical device hosting the virtual firewall, the number of active sessions, VSYS configuration, and historical performance trends.

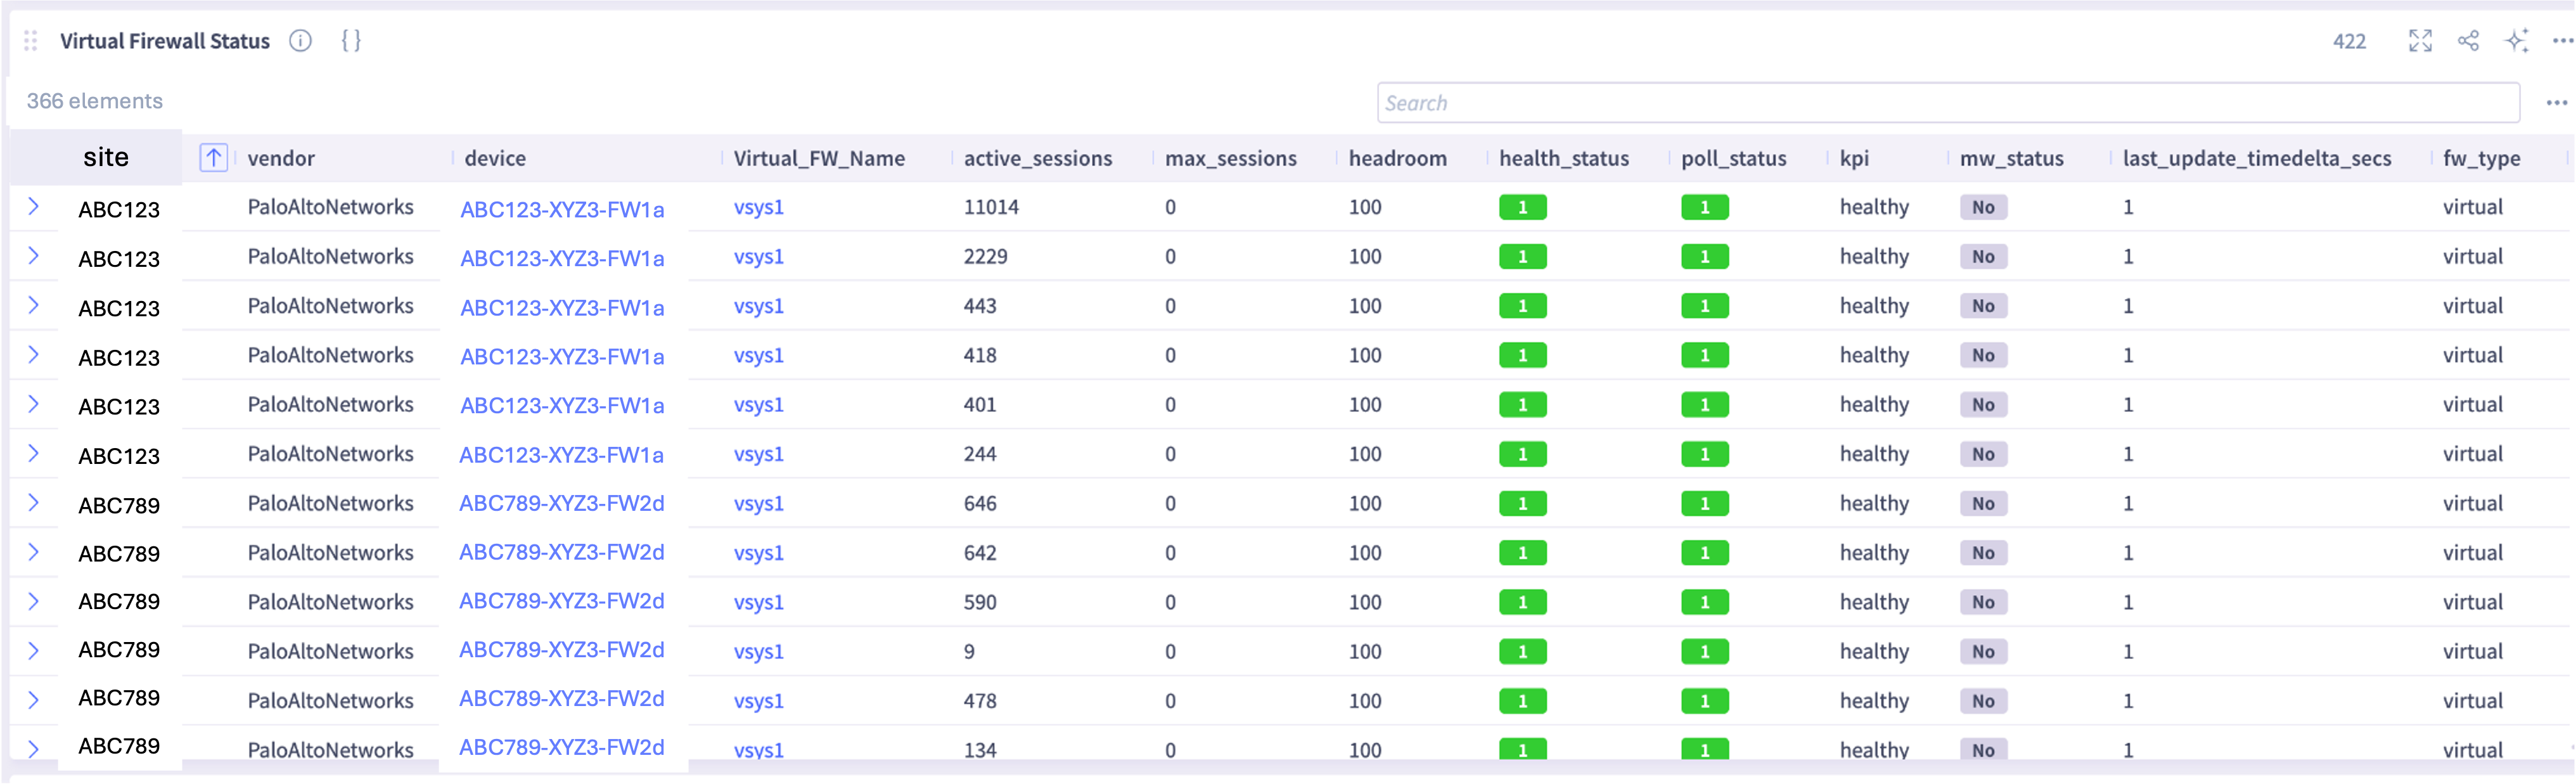
The virtual firewall widget provides a tabular view of all virtual firewalls.
Firewalls are sorted first by health status, with unhealthy firewalls displayed at the top. Within each health status group, firewalls are further sorted by their active sessions count in descending order, highlighting the virtual firewalls with the highest traffic load.
This intuitive dashboard allows administrators to quickly identify problematic virtual firewalls that require immediate attention, without the need to navigate through multiple drilldowns or perform complex queries.
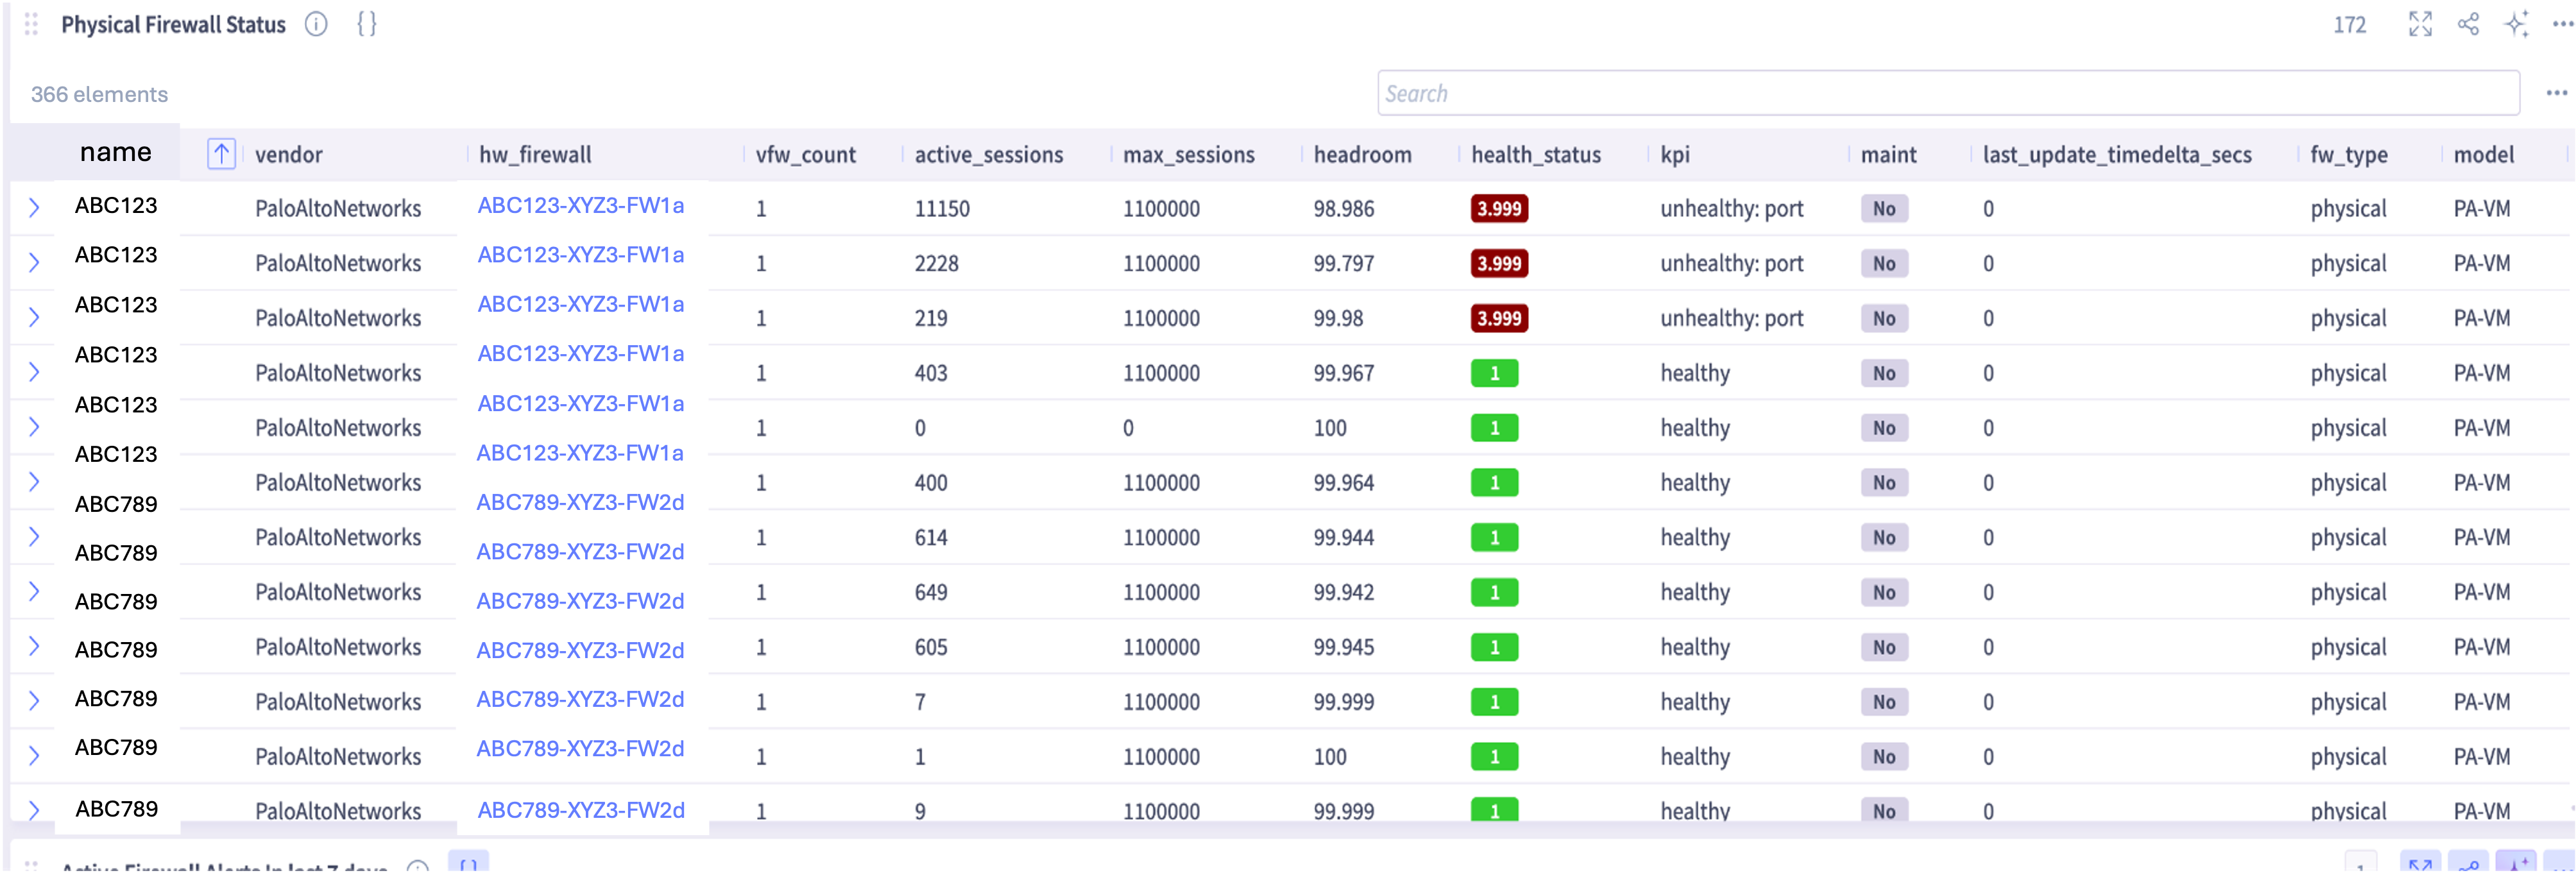
The physical firewall widget provides a tabular view of all physical firewalls.
Firewalls are sorted first by health status, with unhealthy firewalls displayed at the top. Within each health status group, firewalls are sorted based on firewall count and type.
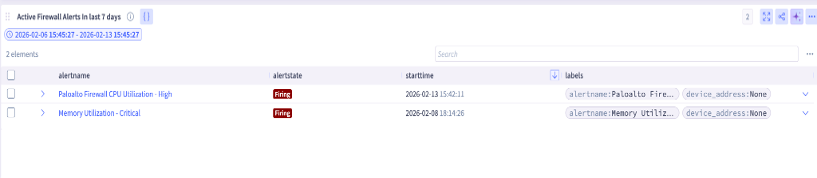
The active firewall alert widget displays a list of active alerts triggered by firewalls over the past seven days, along with detailed information about each alert. This allows administrators to track recent operational issues quickly.
Condition 1 – If a physical firewall goes offline, every virtual firewall instance hosted within it will naturally fail as well. Instead of triggering a separate notification for each individual virtual instance, Selector AI suppresses the redundant secondary alarms.
In the following example figure, there is only a single correlated alert that is shown when a physical firewall and virtual firewall within the same physical firewall goes down.
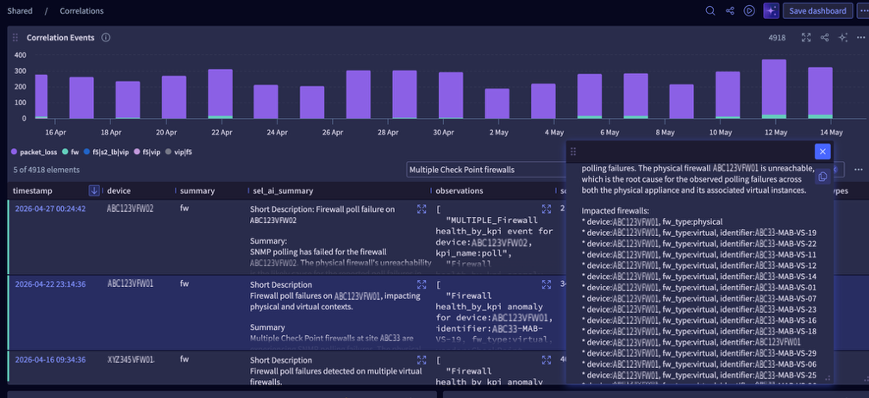
Condition 2 – Only a single correlated alert is generated when multiple virtual firewalls fail simultaneously within the same physical firewall chassis, even if the physical hardware itself remains operational.
In the following example figure, there is only a single correlated alert shown when there are multiple virtual firewalls going down within the same physical firewall.
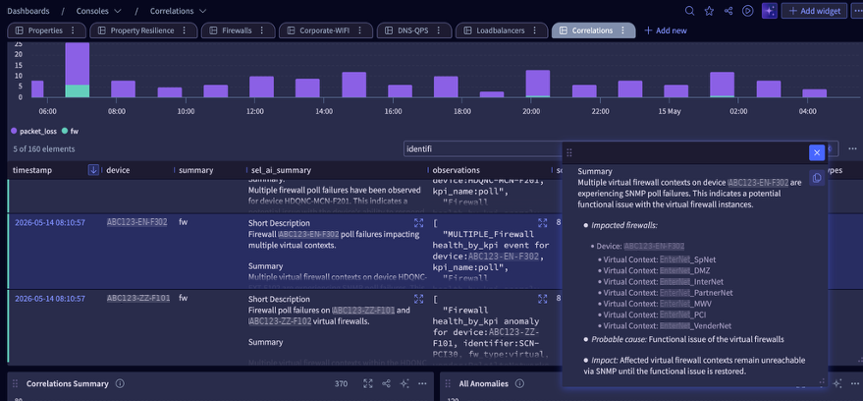
These correlations for virtual firewalls are established from SNMP data. Note that existing ICMP alerts for the physical firewall are still fired.