Overview
These use cases are all based on alerts and queryables that function correctly in proof of concept and other operational environments.
Many, but not all of these use cases, include dashboard images of the use case in action.
This is the multi-page printable view of this section. Click here to print.
These use cases are all based on alerts and queryables that function correctly in proof of concept and other operational environments.
Many, but not all of these use cases, include dashboard images of the use case in action.

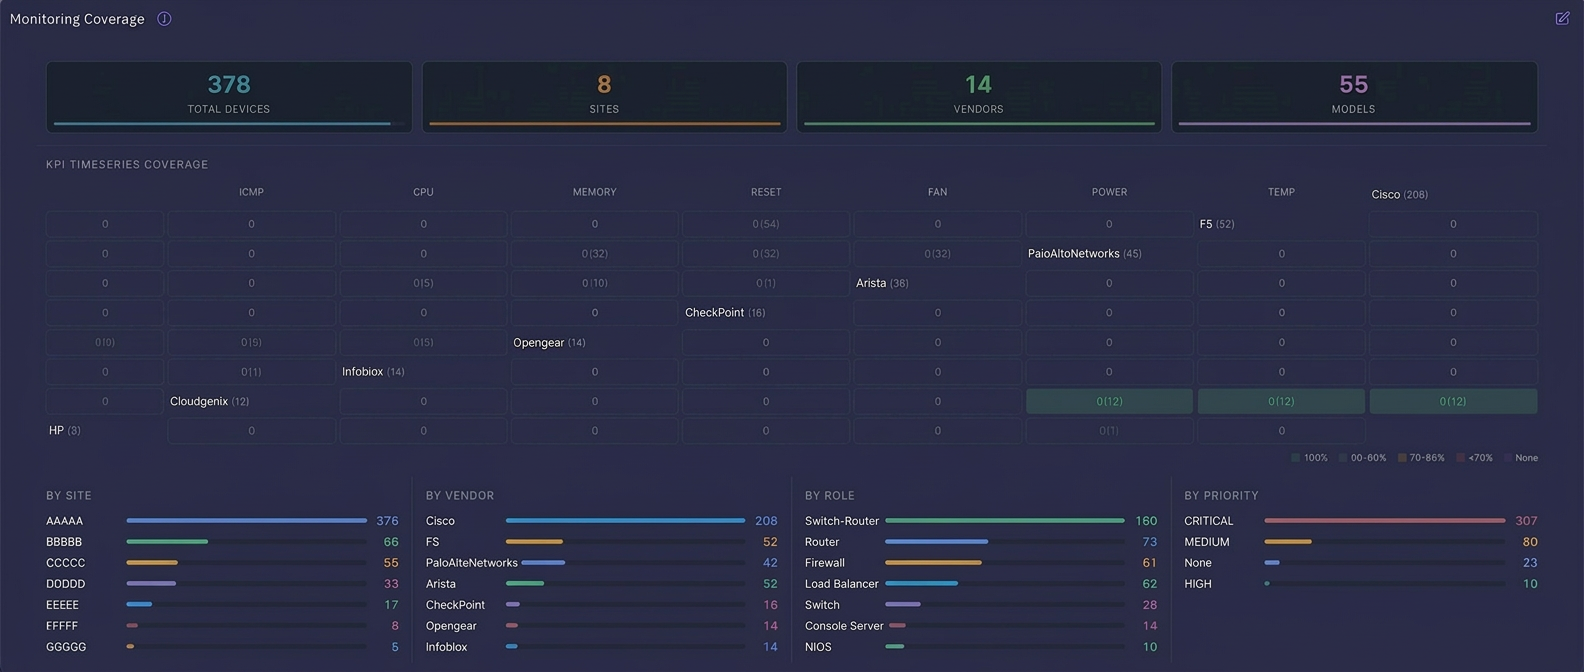
Outcome: Monitoring and alerting capabilities are enabled for Device Reset. Device reset KPI is about identifying when a device reboots. The feature is enabled for all the devices deployed in all environments.
Dashboard Example:

| Alert Name | Priority | Queryable | Notes |
|---|---|---|---|
| Device Reboot | P3 | device_reset_state_violation | An alert is generated when the Device reboots. |
As defined in RFC 1213, the SNMP sysUpTime counter is a 32-bit value that peaks at 4,294,967,295. This represents approximately 497.1 days (specifically 497 days, 2 hours, 27 minutes, and 53 seconds). Once this limit is reached, the counter “wraps around” and automatically resets to zero.
A decrease in the sysUpTime value does not automatically trigger a reboot alert. This is because a lower value could simply indicate a natural counter rollover after 497 days rather than a physical restart.
In Selector, we precisely monitor the sysUpTime calculations to distinguish between a routine counter wrap-around and a genuine system reboot.
By accounting for this 497-day cycle, we ensure that “Device Reset” alerts are only dispatched for actual hardware or software reboots, eliminating false positives caused by counter limitations.

device_reset_state_violation where device_vendor!~“CA|Firemon|Forescout|InfoBlox|ISE|NetBrain|NetMRI|Netscout|CISCO ISE|UDPD”
NOTE: Vendor list should be adjusted for equipment environment.

This use case establishes monitoring and alerting capabilities for Administrative state of Field Replaceable Units (FRUs)—things like line cards, supervisor engines, or power supplies—within modular chassis devices deployed in various physical environments such as data centers or headquarters.
Scale of this example: 297 devices, 4 vendors( Cisco, Arista, Palo Alto and HP), with many different models.
Alerts, including alarm codes, are configured and BigPanda is successfully receiving all configured alerts.
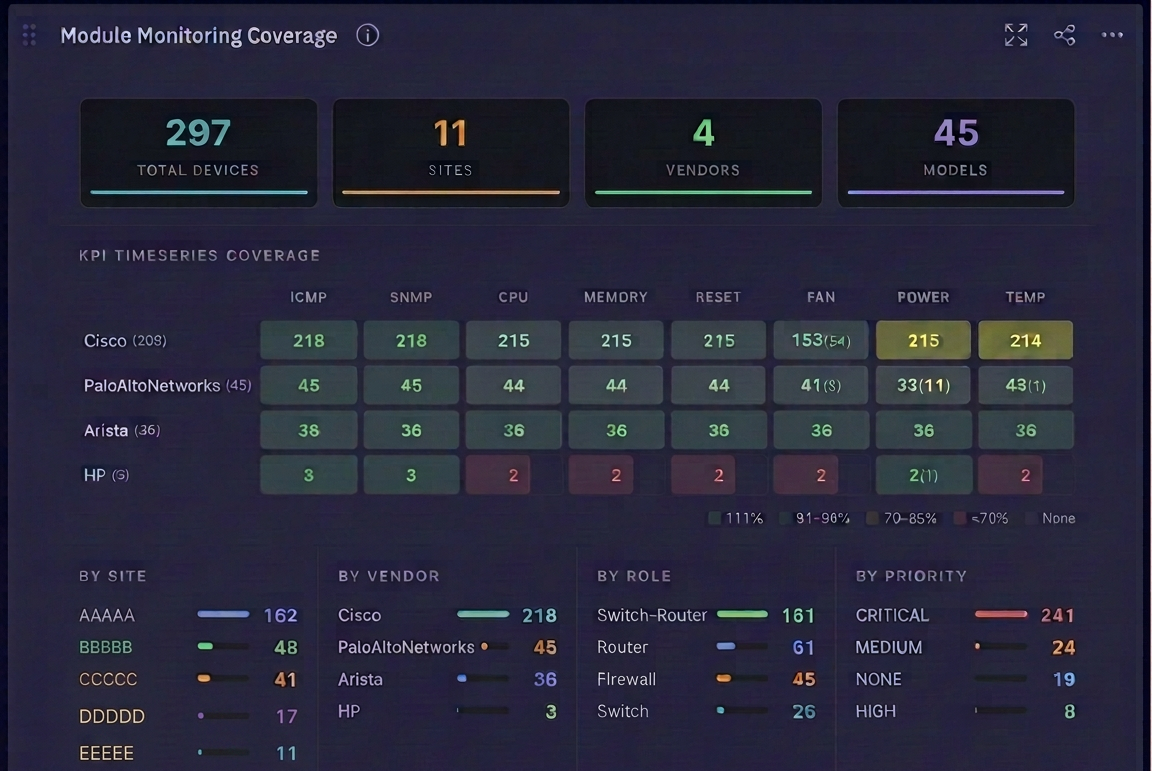
The following table shows the administrative state of Field Replaceable Units (FRUs)—things like line cards, supervisor engines, or power supplies—within a modular chassis.
| Alert Name | Priority | Queryable | Notes |
|---|---|---|---|
| ModuleStatusDown | P3 | module_admin_oper_status as honeycomb where module_admin_oper_status_violation>0 group-by device, entity_model_name | An alert is generated when the state of any FRU module is violating the condition of Status UP. |
An Alert is triggered if ModuleAdminStatus is not equal to enabled (1) or if ModuleOperStatus is not equal to OK (2).

When the Cisco MIB OID ModuleAdminStatus- 1.3.6.1.4.1.9.9.117.1.2.1.1.1 and ModuleOperStatus - 1.3.6.1.4.1.9.9.117.1.2.1.1.2 is polled with SNMP, an integer is returned. Each integer corresponds to a specific state, as shown in the following tables.
| Value | State | Description | Alert |
|---|---|---|---|
| 1 | enabled | The module is powered on and allowed to initialize. | No |
| 2 | disabled | The module is administratively shut down/powered off. | Yes |
| 3 | reset | Setting this value triggers a hardware reset (reboot) of the module. | Yes |
| 4 | outOfServiceAdmin | The module is taken out of service for administrative reasons (maintenance). | Yes |
| Value | State | Description | Alert |
|---|---|---|---|
| 1 | unknown | The status cannot be determined (often seen during a quick transition). | Yes |
| 2 | ok | Normal Operation. The module is powered on and functioning correctly. | No |
| 3 | disabled | The module is powered off (usually via ModuleAdminStatus). | Yes |
| 4 | okButMsiamMismatch | Operational, but there is a backplane/interface mismatch. | Yes |
| 5 | outOfService | The module is powered on but not providing service (manual override). | Yes |
| 6 | standby | The module is in hot-standby mode (common for redundant supervisors). | Yes |
| 7 | powerUp | The module is currently receiving power and beginning to boot. | Yes |
| 8 | identify | The module is being identified by the supervisor software. | Yes |
| 9 | boot | The module is currently loading its operating software. | Yes |
| 10 | mismatchConfig | The physical module does not match the provisioned configuration. | Yes |
| 11 | diagFailed | Hardware Failure. The module failed its Power-On Self-Test (POST). | Yes |
| 12 | dormant | The module is waiting for an internal/external event to go active. | Yes |
| 13 | outOfServiceAdmin | Put into a low-power maintenance mode by an administrator. | Yes |
An Alert is triggered if StateAdmin is not equal to unlocked (4) or if StateOper is not equal to enabled (3)

An Alert is triggered if StateAdmin is not equal to unlocked (4) or if StateOper is not equal to enabled (3)

An Alert is triggered if StateAdmin is not equal to unlocked (4) or if StateOper is not equal to enabled (3).

module_admin_oper_status as honeycomb where module_admin_oper_status_violation>0 group-by device, entity_model_name
When the OID entStateAdmin- 1.3.6.1.2.1.131.1.1.1.2 and entStateOper - 1.3.6.1.2.1.131.1.1.1.2 is polled with a SNMP, an integer Is returned. Each integer corresponds to a specific state, as shown in the following tables.
| Value | State | Description | Alert |
|---|---|---|---|
| 1 | unknown | The administrative state is unknown or cannot be determined. | Yes |
| 2 | locked | The entity is administratively prohibited from providing service (similar to a “shutdown” command). | Yes |
| 3 | shuttingDown | The entity is in the process of shutting down and will soon transition to the locked state. | Yes |
| 4 | unlocked | Normal Operation. The entity is administratively permitted to provide service. | No |
| Value | State | Description | Alert |
|---|---|---|---|
| 1 | unknown | Status cannot be determined (e.g., during a system initialization). | Yes |
| 2 | disabled | The entity is non-functional, usually because the Admin state is locked. | Yes |
| 3 | enabled | Normal Operation. The entity is fully functional and providing service. | No |
| 4 | testing | The entity is currently undergoing internal diagnostics or loopback tests. | Yes |

Selector implements the following 5 alerts to monitor the health of Load Balancers. While these alerts will work for all F5 load balancers, for this example document, Selector has enabled these alerts only for two example devices : ABCDEFGHIJ01 and ABCDEFGHIJ02.
This document describes the specific device conditions that trigger these alerts:
Alert 1: VIPServerAvailState down alert at device level
Alert 2: VIPAddrAvailState “unavailable” alert at device level
Alert 3: LTMPoolAvailState down alert at device level
ALert 4: LTMPoolMemberAvailState down alert at device level
Alert 5: Load Balancer Cluster down alert at cluster level
| Alert Name | Priority | Queryable | Notes |
|---|---|---|---|
| LoadBalancerDeviceVIPServerAvailState | P2 | vip_server_avail_state_5m_controlled as honeycomb where device=~ ABCDEFGHIJ01 | ABCDEFGHIJ01, vip_server_avail_state_5m_controlled_violation>0 | Load Balancer VIPServerAvailState at device level. |
The Selector platform tracks the Virtual Server Availability Status on a continuous basis using SNMP polling of the OID ltmVirtualServStatAvailabilityState variable. If that polling shows that the server is in a down state for 5 minutes, this alert fires at the P2 level.

Other parameters related to this alert are shown below:
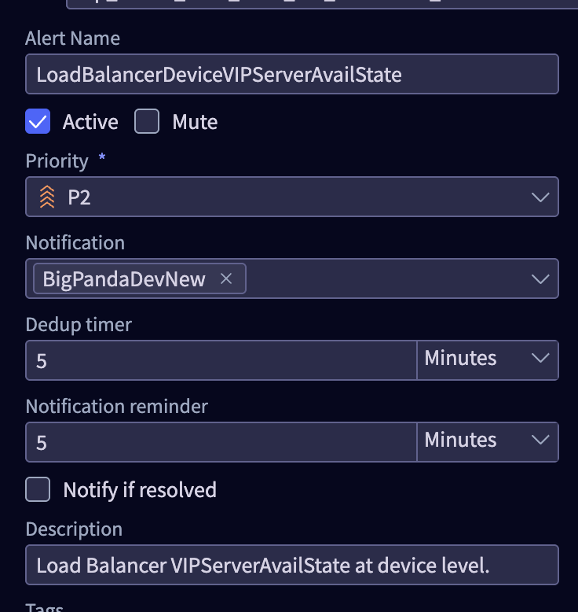
| Alert Name | Priority | Queryable | Notes |
|---|---|---|---|
| LoadBalancerDeviceVIPAddrAvailState | P2 | vip_addr_avail_state_5m_controlled as honeycomb where device=~ABCDEFGHIJ01 | ABCDEFGHIJ02, vip_addr_avail_state_5m_controlled_violation>0 | Load Balancer VIP address availability state at device level |
The Selector platform tracks the Virtual IP Address Availability Status on a continuous basis using SNMP polling of the OID ltmVAddrStatusAvailState variable. If that polling shows that the VIP address is in a “down” state for 5 minutes, this alert fires at P2 level.

Other parameters related to this alert are shown below:
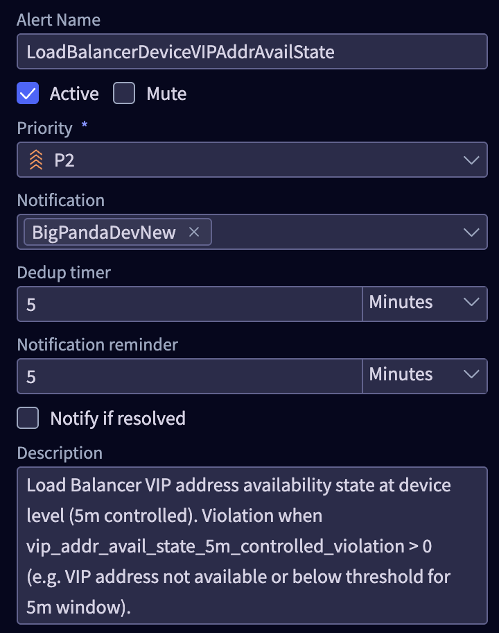
| Alert Name | Priority | Queryable | Notes |
|---|---|---|---|
| LoadBalancerDeviceLTMPoolAvailState | P2 | ltm_pool_avail_state_5m as honeycomb where device=~ABCDEFGHIJ01 | ABCDEFGHIJ02, ltm_pool_avail_state_5m_violation>0 show-by device , ltm_pool_name | Load Balancer LTM pool availability state at device level. Violation when pool availability below expected threshold or pool down for 5 minutes |
The Selector platform tracks the Load Balancer LTM pool availability state at the device level by continuous SNMP polling of the OID ltmPoolStatAvailabilityState variable. A violation occurs when pool availability falls below the expected threshold or the pool is down for 5 minutes. A P2 Alert fires when the parameters are violated.

Other parameters related to this alert are shown below:
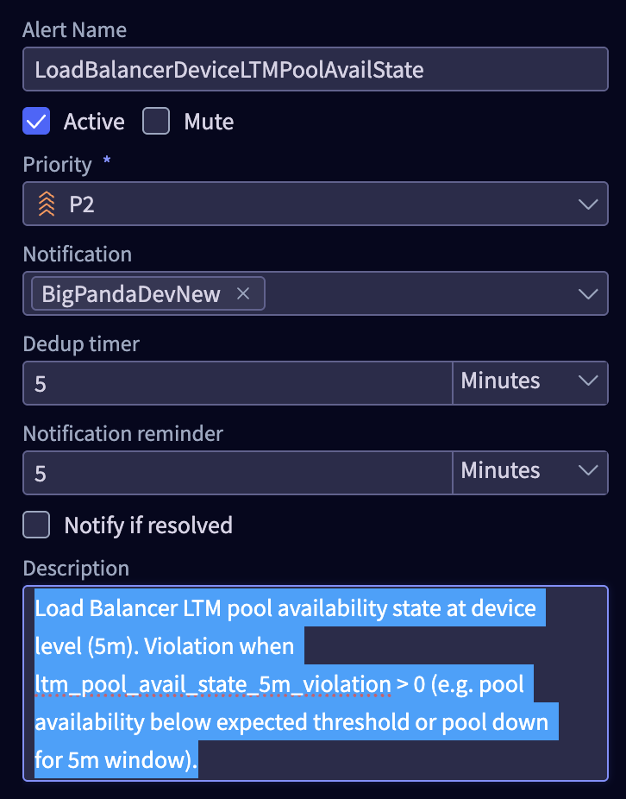
| Alert Name | Priority | Queryable | Notes |
|---|---|---|---|
| LoadBalancerDeviceLTMPoolMemberAvailState | P2 | ltm_pool_member_avail_state_5m as honeycomb where device=~ABCDEFGHIJ01 | ABCDEFGHIJ 02, ltm_pool_member_avail_state_5m_violation>0 | Load Balancer LTM pool member availability state at device level (5m). |
The Selector platform tracks the Load Balancer LTM Pool Member Availability State at device level by continuous SNMP polling of the OID ltmPoolMemberStatAvailabilityState variable. A violation occurs when one or more pool members is unavailable or below the threshold for a 5-minute window. A P2 Alert fires when the parameters are violated.

Other parameters related to this alert are shown below:
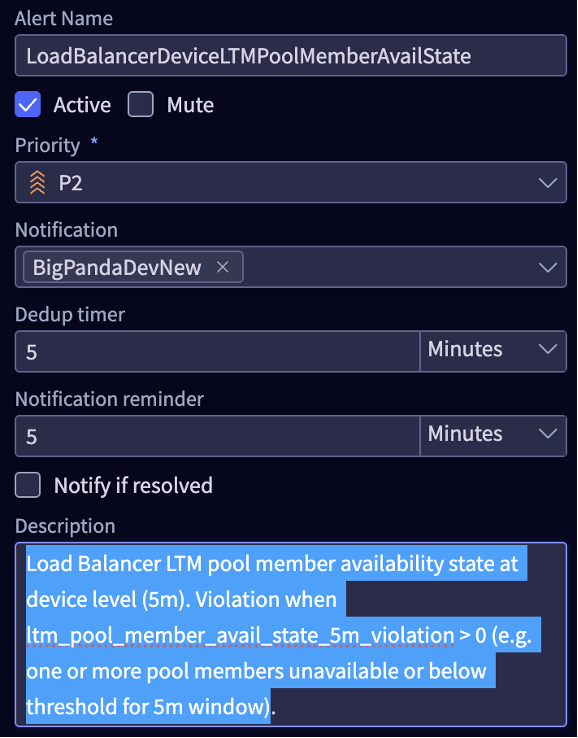
| Alert Name | Priority | Queryable | Notes |
|---|---|---|---|
| LoadBalancerHAClusterDown | P2 | site1_lb_ha_cluster_harddown as threshold-violation-matrix where site2_lb_ha_cluster_harddown_violation>0 | Indicates the HA cluster is fully unavailable; all devices within the cluster are down. |
The Selector platform tracks the status of all load balancers in a cluster by continuously monitoring the status of each device in a cluster. When ALL devices in the cluster go down the entire cluster unavailable. A P2 Alert fires when ALL LB devices in the cluster are down.
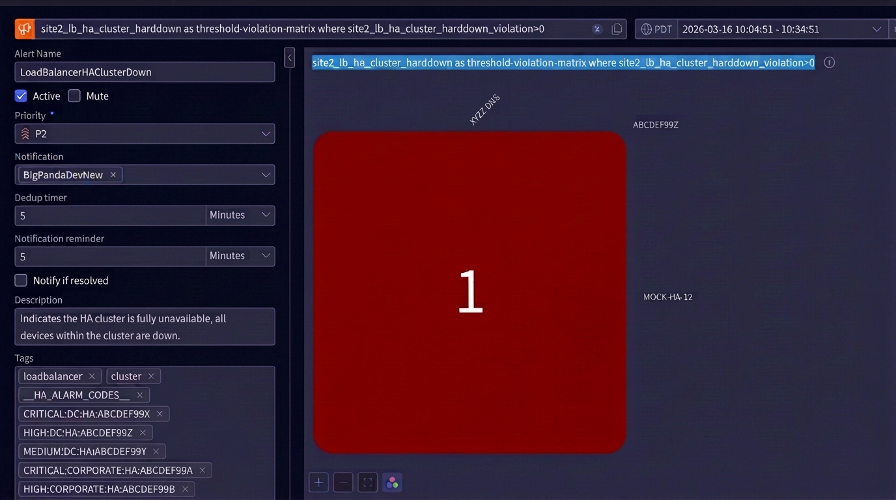

This use case establishes monitoring and alerting capabilities for Cisco switch stacks deployed in various physical environments such as data centers or headquarters.
Scale of this example: 735 devices, including 80 switches in stacks and 655 switches as standalone.
Alerts, including alarm codes, are configured and BigPanda is successfully receiving all configured alerts.
| Alert Name | Priority | Queryable | Notes |
|---|---|---|---|
| CiscoStackMemberStatus | P2 | cisco_stack_switch_status as line-plot where cisco_stack_switch_status_violation>0 group-by device | An alert will be triggered if the state of the switch stack is not “ready” or “added”. State of the stack is polled via SNMP MIB cswSwitchState - 1.3.6.1.4.1.9.9.500.1.2.1.1.6 |
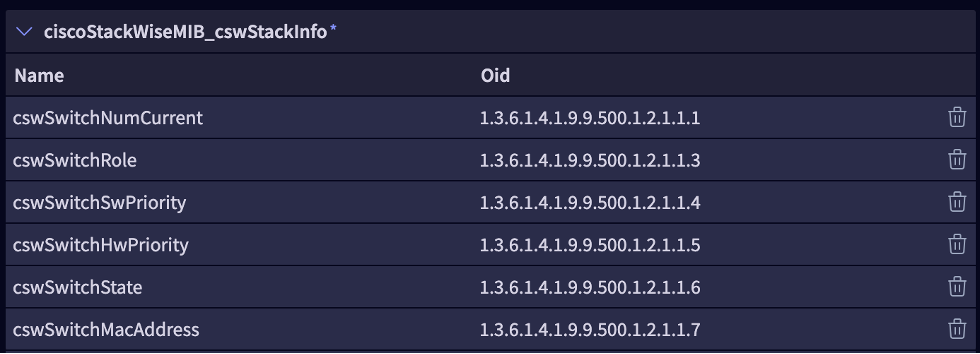
cisco_stack_switch_status as line-plot where cisco_stack_switch_status_violation>0 group-by device
When the Selector platform polls the OID “cswSwitchState - 1.3.6.1.4.1.9.9.500.1.2.1.1.6“ using SNMP, an integer is returned. Each integer corresponds to a specific state of the member switch, as shown in the following table.
| Value | State | Description | Alert |
|---|---|---|---|
| 1 | waiting | The switch is waiting for an event to transition to another state. | Yes |
| 2 | progressing | The switch is in the process of booting or joining the stack. | Yes |
| 3 | added | The switch has been added to the stack but is not yet fully functional. | No |
| 4 | ready | Normal Operation. The switch is fully functional and a member of the stack. | No |
| 5 | sdmMismatch | The SDM template on this switch does not match the stack master. | Yes |
| 6 | verMismatch | Version Mismatch. The IOS software version is incompatible with the master. | Yes |
| 7 | featureMismatch | The software feature set (e.g., IP Base vs. IP Services) does not match. | Yes |
| 8 | newMasterInit | The switch is transitioning to become the new Stack Master. | Yes |
| 9 | provisioned | The switch is configured in the running-config but is not physically present. | Yes |
| 10 | invalid | The switch state cannot be determined or is in an error state. | Yes |

This use case establishes monitoring and alerting capabilities for the High Availability (HA) status for critical Checkpoint and Palo Alto Firewalls deployed in various physical environments such as data centers or headquarters.
Scale of this Example: Checkpoint (11), and Palo Alto (150) devices are covered.
Alerts, including alarm codes, are configured and BigPanda is successfully receiving all configured alerts.
The alert triggers when there is a violation on Palo Alto or Checkpoint firewall HA status. The specifics are shown as shown in the following table.
| Alert Name | Priority | Queryable | Notes |
|---|---|---|---|
| Checkpoint Firewall Connections Utilization - High | P2 | fw_connections_concurrent_utilization where device_priority=HIGH, fw_connections_concurrent_utilization>80, device_ip!=None | Alert triggered for high-priority Checkpoint firewall devices if concurrent connection utilization exceeds 80%. Devices with a “None” IP address are excluded from this alerting rule. |
| Checkpoint Firewall Connections Utilization | P4 | fw_connections_concurrent_utilization where device_priority=None, fw_connections_concurrent_utilization>85, device_ip!=None | Alert triggered if the concurrent connection utilization for Checkpoint firewall devices, which currently have no specific type mentioned (“None”), exceeds 85%. |
| Checkpoint Firewall Connections Utilization - Critical | P1 | fw_connections_concurrent_utilization where device_priority=CRITICAL, fw_connections_concurrent_utilization>75, device_ip!=None | P1 alert triggered when concurrent connections on critical Checkpoint firewall devices exceed the 75% threshold. Note: Devices lacking an assigned IP address are excluded from this specific alerting rule. |
| Checkpoint Firewall Connections Utilization - LOW | P3 | fw_connections_concurrent_utilization where device_priority=LOW, fw_connections_concurrent_utilization>95, device_ip!=None | Alert triggered if the concurrent connection utilization for low priority Checkpoint firewall devices exceeds 95%. Devices lacking an associated IP address(None) are excluded from this alerting rule. |
| Paloalto Firewall CPU Utilization - Low | P1 | fw_pan_cpu where device_priority=LOW, fw_pan_cpu>75 | Alert triggered when CPU for Low priority PAN firewall devices exceeds 75%. |
| Paloalto Firewall CPU Utilization - Low | P1 | fw_pan_cpu where device_priority=LOW, fw_pan_cpu>75 | Alert triggered when CPU for Low priority PAN firewall devices exceeds 75%. |
| VirtualFirewallSNMPPollFailure | P1 | fw_last_poll_timedelta_secs where fw_type=“virtual”, identifier!~“vsys1|*VLAN*”, fw_last_poll_timedelta_secs_color >= 3.5 | Alert triggered when Virtual firewall SNMP polling is stale—last-poll age meets or exceeds threshold (3.5), excluding vsys1/VLAN-style identifiers; indicates possible poll failure or unreachable device. |
| FanStatus | P1 | device_fan_state where device_fan_state_violation>0,device_vendor=Arista|PaloAltoNetworks|CheckPoint|F5|Cloudgenix|Cisco|HP|Arista|PaloAltoNetworks|CheckPoint|F5|Cloudgenix|Cisco|HP|Infoblox group-by vendor | Alert triggered when Hardware health when power supply/module reports a violation (non-OK state) on Arista, Palo Alto, Check Point, or F5 gear; grouped by vendor |
| PowerStatus | P1 | device_power_state where device_vendor=Arista|PaloAltoNetworks|CheckPoint|F5, device_power_state_violation>0 group-by device_vendor | Alert triggered when Hardware health when power supply/module reports a violation (non-OK state) on Arista, Palo Alto, Check Point, or F5 gear; grouped by vendor. |
| TemperatureStatus | P1 | device_temperature_f where device_temperature_f_violation>0, device_vendor=Arista|PaloAltoNetworks|CheckPoint|F5|Infoblox|Cloudgenix|Cisco|HP|Infoblox group-by vendor | Alert triggered when Hardware health: temperature violates policy on Arista, Palo Alto, Check Point, or F5 devices. |
| Paloalto Firewall Connections Utilization | P3 | fw_session_count_headroom_percentage as honeycomb where fw_session_count_headroom_percentage_violation>0, ipaddress != None , model!=“PA-VM” | Alert triggered when session headroom percentage violates policy. |
| AWS Paloalto Firewall CPU Utilization | P3 | pan_cpu as honeycomb where pan_cpu_violation>0 , device_model=“PA-VM” | CPU violates priority-based thresholds |
| Paloalto Firewall Memory Utilization | P3 | pan_memory_util as honeycomb where pan_memory_util_violation>0 , device_model!=“PA-VM” | memory utilization violates policy |
| AWS Paloalto Firewall Memory Utilization | P3 | pan_memory_util as honeycomb where pan_memory_util_violation>0 , device_model=“PA-VM” | memory utilization violates policy |
| LoadBalancerHAClusterDown | P2 | s2_lb_ha_cluster_harddown as threshold-violation-matrix where s2_lb_ha_cluster_harddown_violation>0 | Alert triggered when HA cluster hard-down—entire cluster reported unavailable (all members down) per threshold-violation matrix. |
| ModuleStatusDown | P3 | module_admin_oper_status as honeycomb where module_admin_oper_status_violation>0 group-by device, entity_model_name | Alert triggered when Line card/module administrative/operational status violates policy |
| haStatus | P2 | ha_status as line-plot where ha_status_violation>0 group-by device | Alert triggered when there is violation on Palo alto/Checkpoint firewall devices. |